83 Nc 2813 · Jasper, AR
Flood risk No data
- FEMA flood zone
- —
- Chance of flooding over 30 yrs
- —
- Est. flood insurance / yr
- —
Fire risk No data
- Est. fire insurance / yr
- —
Heat risk No data
- Hot days now (above threshold)
- —
- Hot days in 30 yrs
- —
Wind risk No data
- Chance of severe wind over 30 yrs
- —
Air-quality risk No data
- Unhealthy air days now
- —
- Unhealthy air days in 30 yrs
- —
Risk factors via First Street. Map © Google.
Why this score? — see what drove the C- grade
The composite is a weighted blend of 9 inputs, each scored 0–100. Each bar is that input's sub-score; the figure is the points it added to the 100-point composite (weight × sub-score).
- Cash flow +19.4/30.0
- ARV discount +7.5/15.0
- DSCR +6.1/10.0
- 1% rule +5.2/10.0
- Appreciation +5.0/10.0
- Livability +3.1/5.0
- Schools +3.0/10.0
- Rent growth +2.5/5.0
- Condition / age +2.2/5.0
$85,000
🖨 Deal sheet (PDF) 📄 Offer letter ✓ Due diligence
Listing remarks
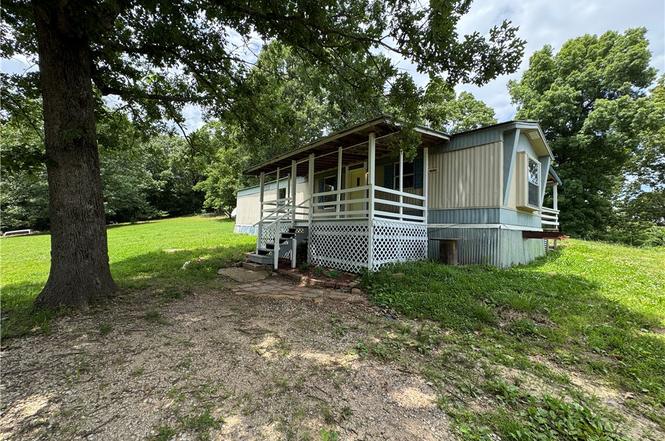
Escape to the beautiful Ozarks with this 2-bedroom, 1-bathroom home situated on 3.48 scenic acres in Marble Falls! Nestled in the heart of Newton County, this property offers excellent privacy, mature trees, and gorgeous wooded views. Whether you are looking for an affordable full-time residence, a weekend getaway, or an outdoor enthusiast's basecamp, this acreage has endless potential. The manufactured home features a functional 2-bed, 1-bath layout ready for your personal touches. Enjoy the peace and quiet of country living with plenty of room to garden, expand, or enjoy the local wildlife. Best of all, you are just minutes away from Scenic Highway 7, Jasper, and world-class hiking, float
Key facts
- Excellent privacy
- Scenic acres
- Country living
Tags
Property features AI
Finance
- HOA & community: Monthly association fee; Near a state park
Exterior
- Utilities: Electricity available; Public water available; Septic available (septic tank)
- Home design: Single-story; Metal siding
- Construction: Metal roof; Tie-down foundation; Built 25+ years ago
- Exterior features: Deck and porch; Gravel driveway; Wire fencing; Rolling slope, rural and wooded lot; Approximately 3.48 acres with about 3 acres of pasture and 0.48 acres wooded; County road frontage
Interior
- Kitchen: Convection oven; Refrigerator
- Flooring: Laminate flooring
- Bathrooms: 1 full bathroom
- Heating & cooling: Gas heating; Central air conditioning
- Interior features: Blinds and window treatments; Eat-in kitchen
Neighborhood map
What this means for you Summary
Snapshot
- This is a 2-bed/1.0-bath manufactured listed at $85k. Condition is rated fair.
Deal economics
- At list price, monthly cash flow is $95 ($1k/yr) — positive.
- The deal already cash-flows at list — no discount required.
- Meets the 1% rule at list price ($864 rent vs $85k).
- Cap rate 7.6% vs local median 3.5% in Jasper — top-decile yield for the area; either an underpriced asset or a hidden risk that comps aren't pricing in. Stress-test before assuming the spread holds.
Location & tenants
- Location reads 62/100 on livability (#217 in AR) — a middle-class / working-renter tenant base. Strengths: cost of living A+, health & safety A+; Watch: crime F, amenities F, commute F.
- Jasper School District (rural): math 33% / reading 39% proficiency, ranked #115 of 238 in AR (top 48%) — families likely to look elsewhere, expect single-tenant / working-renter base with shorter leases.
- Zoned schools: Jasper Elementary School (math 47% / reading 37%, grade F, #173 of 454 statewide, top 43%, 271 students, 65% FRL); Jasper High School (math 22% / reading 42%, grade F, #119 of 292 statewide, top 43%, 208 students, 61% FRL) — zoned schools at 63% FRL track the district average.
- Market conditions: 26 active listings in the ZIP.
Forward outlook
- In year one you build about $3k of equity ($588 loan paydown + $3k appreciation (3.0% local appreciation)).
- Newton County population projected at -36% by 2050 — secular population decline; favor cash flow + early exit over multi-decade hold.
- At projected returns (3.0% appreciation + 3.0% rent growth), your $24k cash investment doubles in ~5 years — after that, you're playing with house money.
- By year 10, paydown + projected appreciation supports a ~$30k cash-out refi (75% LTV) — recoverable capital for the next deal without selling this one.
Negotiation context
- Only 6 days on market — expect competitive offers; lowballing is unlikely to land.
Questions for the listing agent
- Have any recent inspections been done? Can we get a copy of the seller's disclosures and any deferred-maintenance estimates?
- Is there a deadline driving the sale (1031 exchange, divorce, estate, relocation)? That informs how much negotiation room exists.
- Schools are D-rated, which usually means shorter tenancies and higher turnover. Who's the typical renter profile here, and what's been the actual vacancy rate?
- Crime grade is F in this area — have there been break-ins, vandalism, or insurance claims at this property in the last 3 years? What carrier currently insures it and at what premium?
- What's the average days-on-market for RENTAL listings here right now (not sales)? A rising rental-DOM trend means longer vacancies and softer asking-rent achievability than the comps imply.
- What's the recent tenant-quality profile in this submarket — average credit score on applications, eviction rate, late-payment / NSF rate, and stable-employment percentage? A property-management company in the area should have these aggregated.
- How much new for-sale + rental construction is in the pipeline within 1–3 miles? Heavy new supply typically softens prices + rents 12–24 months out; constrained supply supports both.
Investment metrics
- 1% rule
- 1.02% ✓
- Cap rate
- 7.64%
- Cash-on-cash
- 4.80%
- DSCR
- 1.21
- GRM
- 8.2
CMA / ARV
No comps found within radius.
Projected returns pro-forma
3.0% appreciation · 3.0% rent growth · sell at horizon
- IRR
- 12.0%
- Equity multiple
- 1.69×
- Total profit
- $16,313
- Equity at exit
- $38,220
- IRR
- 14.1%
- Equity multiple
- 3.08×
- Total profit
- $49,610
- Equity at exit
- $58,901
Cash invested: $23,800 (down + closing). Projections, not guarantees.
Landlord ↔ Tenant lean methodology
- Overall (STATE)
- 92 Strongly Landlord-Friendly
- State Arkansas
- 92 Strongly Landlord-Friendly · R+14
- County
- — inherits STATE
- City
- — inherits STATE
ZIP-level market 72648
- Active inventory
- 26
- Price-to-rent
- 8.2×
Monthly cashflow live
- Estimated rent
- $864 medium interval (Pro) →
- Mortgage (P&I)
- −$446
- Tax est. 1.5%
- −$106 /mo · $1,275/yr
- Insurance
- −$35
- HOA
- −$0
- Vacancy / Maint / Mgmt
- −$181
- Net cashflow
- $95
Break-even live
Sensitivity live
| Price | -10% $154 | -5% $125 | +0% $95 | +5% $66 | +10% $36 |
|---|---|---|---|---|---|
| Rent | -10% $27 | -5% $61 | +0% $95 | +5% $129 | +10% $163 |
| Rate | -1.0pp $138 | -0.5pp $117 | base $95 | +0.5pp $73 | +1.0pp $51 |
UW: 25.0% down · 7.5% · 30yr · 1.5% tax · 5.0% vac · 8.0% maint · 8.0% mgmt
Financing live
Cash to close
- Down payment
- $21,250
- Closing costs
- $2,550
- Reserves months
- —
- Total cash needed
- —
Loan-product check · same deal, 3 products live
Conventional
25% down · 7.5% · 30yr
- Down + closing
- —
- Monthly P&I
- —
- Monthly cashflow
- —
- DSCR
- —
- Eligible?
- —
Personal DTI + credit; lowest rate.
DSCR
20% down · 8.5% · 30yr
- Down + closing
- —
- Monthly P&I
- —
- Monthly cashflow
- —
- DSCR
- —
- Eligible?
- —
No personal income docs; deal must DSCR.
Hard money
10% down · 12.0% · 12mo
- Down + closing
- —
- Monthly P&I
- —
- Monthly cashflow
- —
- DSCR
- —
- Eligible?
- —
Short-term bridge; refi at stabilization.
Listing history 6 events
-
2026-06-22days on market $85,000 Active 6 DOM
-
2026-06-21days on market $85,000 Active 5 DOM
-
2026-06-19days on market $85,000 Active 3 DOM
-
2026-06-18days on market $85,000 Active 2 DOM
-
2026-06-17remarks 699-char remark
-
2026-06-17$85,000 Active 1 DOM
ⓘ Source: listings_history table (triggers on properties + properties_extension) + one-shot
backfill from property_details.listing_events for pre-trigger history.
Nearby sold comps map
Loading sold comps map…
Walkable amenities ~0.75 mi
Loading nearby amenities…
Taxation est. · year 1
- Rental income
- $10,368
- − Mortgage interest
- −$4,761
- − Property taxes
- −$1,275
- − Insurance
- −$425
- − Repairs & maintenance
- −$829
- − Management
- −$829
- − Depreciation
- −$2,473
- Taxable loss
- −$225
- Est. tax savings @ 24.0%
- +$54
- After-tax cash flow
- $1,196/yr
For passive investors: Depreciation is non-cash, so a rental often shows a tax loss while cash-flowing — sheltering income. Rental losses are passive: they offset passive income freely, and up to $25,000/yr can offset ordinary (W-2) income if you actively participate and your MAGI is under $100k (phasing out to $0 by $150k); unused losses carry forward. On sale, claimed depreciation is recaptured at up to 25%, and gains may owe capital-gains tax (a 1031 exchange can defer both). Figures are a year-1 estimate at your 24.0% rate — not tax advice; consult a CPA.
Condition & rehab AI · 12 photos
This manufactured home requires moderate repairs and updates to improve its condition and value. Key areas for improvement include the kitchen, bathroom, and exterior. Painting and replacing cabinets, countertops, and appliances would significantly enhance its resale and rental value.
Repairs flagged
- Moderate kitchen cabinets — dated and in need of replacement
- Moderate kitchen countertops — dated and in need of replacement
- Moderate kitchen appliances — dated and in need of replacement
- Moderate bathroom fixtures — dated and in need of replacement
Value-add opportunities
- Resale paint interior walls — fresh paint enhances curb appeal
- Resale replace kitchen cabinets and countertops — new cabinets and countertops improve functionality and aesthetics
- Resale replace kitchen appliances — new appliances improve functionality and aesthetics
- Resale replace bathroom fixtures — new fixtures improve functionality and aesthetics
- Both landscaping — improved landscaping enhances curb appeal and outdoor living space
Renovation cost estimate screening
| Repair item | Severity | Est. cost |
|---|---|---|
| kitchen cabinets · dated and in need of replacement | Moderate | $3,000–15,000 |
| kitchen countertops · dated and in need of replacement | Moderate | $3,000–15,000 |
| kitchen appliances · dated and in need of replacement | Moderate | $3,000–15,000 |
| bathroom fixtures · dated and in need of replacement | Moderate | $3,000–15,000 |
| Total estimated repair cost · 4 items | $12,000–60,000 |
Value-add ROI direction
- Resale paint interior walls — fresh paint enhances curb appeal ↑
- Resale replace kitchen cabinets and countertops — new cabinets and countertops improve functionality and aesthetics ↑
- Resale replace kitchen appliances — new appliances improve functionality and aesthetics ↑
- Resale replace bathroom fixtures — new fixtures improve functionality and aesthetics ↑
- Both landscaping — improved landscaping enhances curb appeal and outdoor living space ↑
ⓘ Cost ranges are severity-bucket heuristics (US national rule-of-thumb). Get contractor quotes + a written scope before underwriting a rehab budget.
Schools (NCES district)
- District
- Jasper School District
- NCES district ID
- 0508240
- Math proficiency
- 33% ▼ -5.00%
- Reading proficiency
- 39% ▼ -5.00%
- Median HH income
- $33,615
- Composite
- 29.59/100
- National rank
- #6480
- State rank
- #115 of 238 in AR
Livability — Jasper
- Score
- 62/100
- State rank
- #217
- US rank
- #16736
Category grades
Schools grade is shown separately in the Schools card above.
Census & demographics
- Population (ZIP)
- 502
Population outlook (Newton County) Hauer SSP2
- Today (2025)
- 7,052 people
- By 2030
- 6,509 · -7.7%
- By 2040
- 5,424 · -23.1%
- By 2050
- 4,502 · -36.2%
- By 2075
- 3,018 · -57.2%
- By 2100
- 1,985 · -71.9%
Race, ethnicity, and origin ACS 2023
- Neighborhood character
- Predominantly White (86%)
- Race & ethnicity
- White 86% Two or more races 14%
- Common ancestry
- Lithuanian 6% Romanian 5% Serbian 5%
Political lean MEDSL · Newton
- 2024 margin
- Solid R (+64.2) · D 17.1% · R 81.2% · Other 1.7%
- 2008→2024 swing
- -28.7pp toward R · 2008: -35.5pp · 2024: -64.2pp
- All cycles
- 2024: R+64.2 2020: R+62.1 2016: R+58.3 2012: R+41.4 2008: R+35.5
Not yet ingested
- Civics
- —
Market trends
- HPI YoY
- —
- Current HPI
- —
- Rent YoY
- —
- Metro
- —
- State GDP YoY
- ▲ 3.80%
- F500 in state
- 10
Industry mix (Fortune 500 HQ in AR)
| Industry | F500 HQs | Revenue |
|---|---|---|
| Retail | 1 | $681B |
|
||
| Food / Agriculture | 1 | $53B |
|
||
| Retail / Energy | 1 | $22B |
|
||
| Transportation / Logistics | 1 | $12B |
|
||
| Energy | 1 | $4B |
|
||
Price history
1 event — show timeline
- 2026-06-16 Listed $85,000 NWARMLS
Cash-flow waterfall
monthlySold comps — $/sqft
last 12 mo · ≤1 miLoading sold comps…