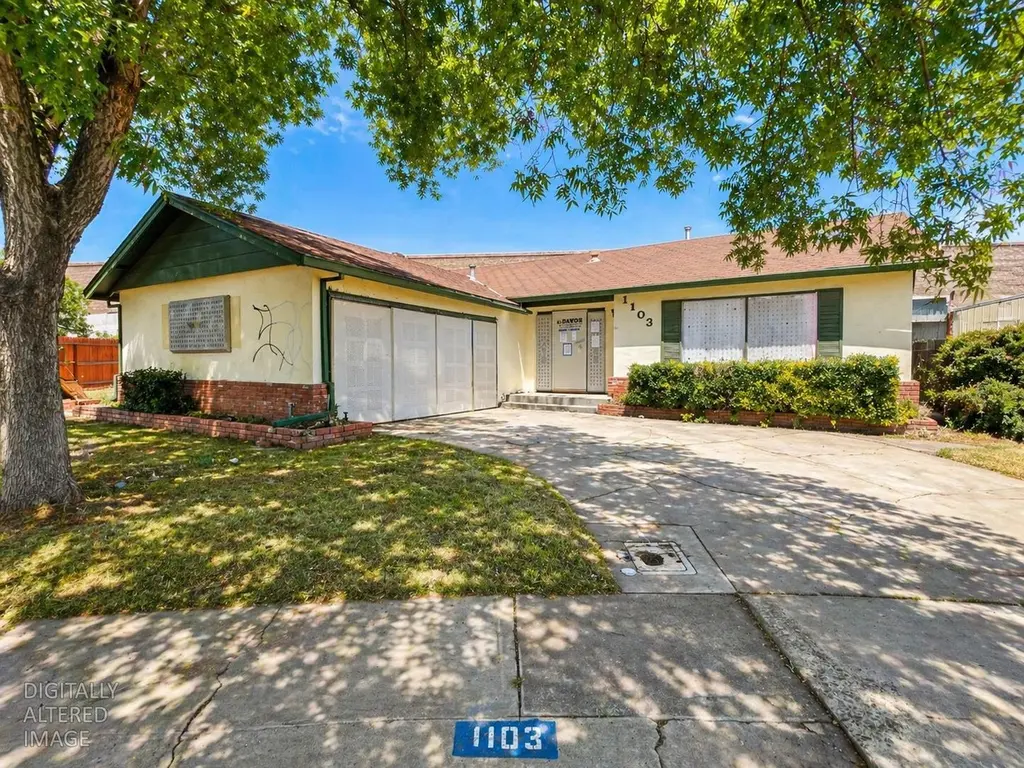
1103 Custer Ct · Modesto, CA
Flood risk 7/10 · Major
- FEMA flood zone
- X (unshaded)
- Chance of flooding over 30 yrs
- 0.77%
- Est. flood insurance / yr
- $507 – $1,088
Fire risk 5/10 · Moderate
- Est. fire insurance / yr
- $659 – $1,223
Heat risk 7/10 · Major
- Hot days now (above 102°F)
- 7 days/yr
- Hot days in 30 yrs
- 16 days/yr
Wind risk 1/10 · Minimal
- Chance of severe wind over 30 yrs
- —
Air-quality risk 10/10 · Severe
- Unhealthy air days now
- 33 days/yr
- Unhealthy air days in 30 yrs
- 38 days/yr
Risk factors via First Street. Map © Google.
Why this score? — see what drove the C grade
The composite is a weighted blend of 9 inputs, each scored 0–100. Each bar is that input's sub-score; the figure is the points it added to the 100-point composite (weight × sub-score).
- Cash flow +25.8/30.0
- DSCR +8.6/10.0
- ARV discount +7.5/15.0
- 1% rule +5.6/10.0
- Livability +3.2/5.0
- Rent growth +2.5/5.0
- Condition / age +2.5/5.0
- Schools +1.7/10.0
- Appreciation +0.0/10.0
$190,000
🖨 Deal sheet 📄 Offer letter ✓ Due diligence
Listing remarks
Opportunity awaits with this 3-bedroom, 2-bath HUD home offering approximately 1,252 square feet of potential. Featuring a functional floor plan, spacious living areas, and a generous lot, this property provides a great foundation for buyers ready to make it their own. With the right vision, this home offers the chance to personalize and enhance to fit your style and needs. FHA 203(k) financing may be an excellent option for buyers looking to finance eligible improvements and updates into one convenient loan. HUD may also contribute up to 3% toward buyer's closing costs when negotiated in the purchase contract. A valuable opportunity for owner-occupants or buyers seeking affordability, flex
Key facts
- 8,403 sq ft lot
- 2 garage spots
- Built 1966
Property features AI
Finance
- HOA & community: No homeowners association; Not a senior community
Exterior
- Parking: Attached garage facing side; 2 garage spaces
- Utilities: Public water; Public sewer; Electric service: Other; No irrigation
- Home design: Detached single-family residence; Built in 1966; Single-story
- Construction: Other roof
- Exterior features: No horses allowed; Other lot features
Interior
- Kitchen: Laminate counters; Hood over range
- Bedrooms: 3 bedrooms (main level)
- Flooring: Carpet; Concrete; Tile; Other
- Bathrooms: 2 full bathrooms; Bathtub in bathroom(s)
- Heating & cooling: Ceiling fans; No central air (none specified); Other heating
- Interior features: Hood over range; One-level living; Family room fireplace
- Laundry & utility: Laundry area in garage
Neighborhood map
What this means for you Summary
Snapshot
- This is a 3-bed/2.0-bath single-family listed at $190k.
Deal economics
- At list price, monthly cash flow is $394 ($5k/yr) — positive.
- The deal already cash-flows at list — no discount required.
- Meets the 1% rule at list price ($2k rent vs $190k).
- Cap rate 9.2% vs local median 3.2% in Modesto — top-decile yield for the area; either an underpriced asset or a hidden risk that comps aren't pricing in. Stress-test before assuming the spread holds.
Location & tenants
- Location reads 63/100 on livability (#451 in CA) — a middle-class / working-renter tenant base. Strengths: housing A+; Watch: amenities C-, schools D+, health & safety D+.
- Modesto City Elementary (urban): math 15% / reading 26% proficiency, ranked #462 of 517 in CA (top 89%) — low school quality limits family demand, transient renter base, plan for 1-2y turnover; 77% free/reduced lunch — lower-income household profile, screen leases tightly.
- Market conditions: 109 active listings in the ZIP; 7 comparable units currently listed for rent nearby; rentals leasing fast (median 14d on market — plan ~1-2 weeks tenant-placement turnaround); 923 units permitted in Stanislaus County in 2024 (63 in 5+ unit buildings).
- This rent runs 41% of the median local income ($58k/yr) — at the standard rent-burdened threshold; future hikes will face affordability resistance.
Forward outlook
- Local home prices are declining (-3.0%/yr); year-one equity from $1k of loan paydown is wiped out by about $6k of value loss. Plan a longer hold.
- Stanislaus County population projected at +14% by 2050 — modest demand growth; plan on rents tracking national, not racing it.
Negotiation context
- Only 4 days on market — expect competitive offers; lowballing is unlikely to land.
Risks & watch-outs
- Watch-outs: flood insurance adds $66/mo.
- Climate carrying-cost: major flood risk; moderate wildfire risk; extreme-heat days projected 7→16/yr by 2055 (HVAC capex compounding) — expect insurance premiums to compound above CPI over the hold.
Questions for the listing agent
- Built in 1966 — when were the roof, HVAC, electrical panel, plumbing, and water heater last replaced?
- What's the actual annual flood-insurance premium (NFIP or private), and is the property in a SFHA with mandatory coverage?
- Is there a deadline driving the sale (1031 exchange, divorce, estate, relocation)? That informs how much negotiation room exists.
- Schools are D-rated, which usually means shorter tenancies and higher turnover. Who's the typical renter profile here, and what's been the actual vacancy rate?
- Crime grade is F in this area — have there been break-ins, vandalism, or insurance claims at this property in the last 3 years? What carrier currently insures it and at what premium?
- What's the average days-on-market for RENTAL listings here right now (not sales)? A rising rental-DOM trend means longer vacancies and softer asking-rent achievability than the comps imply.
- What's the recent tenant-quality profile in this submarket — average credit score on applications, eviction rate, late-payment / NSF rate, and stable-employment percentage? A property-management company in the area should have these aggregated.
- How much new for-sale + rental construction is in the pipeline within 1–3 miles? Heavy new supply typically softens prices + rents 12–24 months out; constrained supply supports both.
Investment metrics
- 1% rule
- 1.06% ✓
- Cap rate
- 9.20%
- Cash-on-cash
- 10.39%
- DSCR
- 1.46
- GRM
- 7.9
CMA / ARV
- ARV (on-the-fly)
- $419,120
- Comps found
- 12
Show comp detail 12 sales within ~0.75 mi
| Address | Dist | Beds/Ba | Sqft | Sold | Price | $/sf | Match |
|---|---|---|---|---|---|---|---|
| 1026 Elm Ave | 0.10mi | 4/2.0 (+1) | 1,228 (-1%) | 7mo | $379,909 | $309 | 83 |
| 613 Laurel Ave | 0.33mi | 3/2.0 | 1,180 (-5%) | 2mo | $399,000 | $338 | 75 |
| 512 Rachelle Dr | 0.45mi | 3/2.0 | 1,250 (+1%) | 7mo | $389,000 | $311 | 72 |
| 600 Rachelle Dr | 0.39mi | 3/2.0 | 1,250 (+1%) | 11mo | $379,000 | $303 | 71 |
| 204 Daisy Ln | 0.31mi | 4/2.0 (+1) | 1,260 (+2%) | 9mo | $380,000 | $302 | 70 |
| 320 Luinda Way | 0.44mi | 3/2.0 | 1,180 (-5%) | 7mo | $399,000 | $338 | 65 |
| 1709 Nighthawk Way | 0.59mi | 3/2.0 | 1,279 (+3%) | 6mo | $429,000 | $335 | 62 |
| 1017 Jayhawk Way | 0.66mi | 3/2.0 | 1,279 (+3%) | 2mo | $440,000 | $344 | 62 |
| 430 Laurel Ave | 0.49mi | 3/2.0 | 1,350 (+9%) | 2mo | $490,000 | $363 | 61 |
| 417 Laurel Ave | 0.57mi | 3/2.0 | 1,140 (-8%) | 5mo | $625,000 | $548 | 56 |
| 301 S Emerald Ave | 0.58mi | 3/2.0 | 1,104 (-11%) | 0mo | $394,000 | $357 | 54 |
| 1717 Judy Ct | 0.74mi | 3/2.0 | 1,380 (+11%) | 11mo | $435,000 | $315 | 38 |
Match score weights: distance 35% · size 25% · config 20% · recency 20%. Top-matched comps best support the ARV.
Projected returns pro-forma
-3.0% appreciation · 3.0% rent growth · sell at horizon
- IRR
- -2.9%
- Equity multiple
- 0.89×
- Total profit
- $-5,738
- Equity at exit
- $28,330
- IRR
- 6.8%
- Equity multiple
- 1.51×
- Total profit
- $27,137
- Equity at exit
- $16,428
Cash invested: $53,200 (down + closing). Projections, not guarantees.
Landlord ↔ Tenant lean methodology
- Overall (STATE)
- 18 Strongly Tenant-Friendly
- State California
- 18 Strongly Tenant-Friendly · D+13
- County
- — inherits STATE
- City
- — inherits STATE
ZIP-level market 95351
- Active inventory
- 109
- Price-to-rent
- 7.9×
Monthly cashflow live
- Estimated rent
- $2,007 high interval (Pro) →
- Mortgage (P&I)
- −$996
- Tax from tax record
- −$49 /mo · $592/yr
- Insurance
- −$79
- Flood insurance flood zone
- −$66 /mo · $798/yr
- HOA
- −$0
- Vacancy / Maint / Mgmt
- −$421
- Net cashflow
- $394
Break-even live
UW: 25.0% down · 7.5% · 30yr · 1.5% tax · 5.0% vac · 8.0% maint · 8.0% mgmt
Financing live
Cash to close
- Down payment
- $47,500
- Closing costs
- $5,700
- Reserves months
- —
- Total cash needed
- —
Loan-product check · same deal, 3 products live
Conventional
25% down · 7.5% · 30yr
- Down + closing
- —
- Monthly P&I
- —
- Monthly cashflow
- —
- DSCR
- —
- Eligible?
- —
Personal DTI + credit; lowest rate.
DSCR
20% down · 8.5% · 30yr
- Down + closing
- —
- Monthly P&I
- —
- Monthly cashflow
- —
- DSCR
- —
- Eligible?
- —
No personal income docs; deal must DSCR.
Hard money
10% down · 12.0% · 12mo
- Down + closing
- —
- Monthly P&I
- —
- Monthly cashflow
- —
- DSCR
- —
- Eligible?
- —
Short-term bridge; refi at stabilization.
Rent comps 7 comps
| Address | Beds | Baths | Sqft | Rent | $/sqft | DOM | Units | Dist |
|---|---|---|---|---|---|---|---|---|
| 1017 Jayhawk Way Modesto, CA | 3.0 | 2.0 | 1279 | $2,495 | $1.95 | 13d | 1 | 0.70mi |
| 1001 Stoddard Ave Modesto, CA | 2.0 | 1.0 | 816 | $1,850 | $2.27 | 13d | 1 | 1.02mi |
| 508 College Ave Unit 1 Modesto, CA | 2.0 | 1.0 | 816 | $1,395 | $1.71 | 13d | 1 | 1.02mi |
| 814 2nd St Unit 2 Modesto, CA | 2.0 | 1.0 | 700 | $1,350 | $1.93 | 21d | 1 | 1.19mi |
| 1229 W Roseburg Ave Apt 7 Modesto, CA | 2.0 | 1.0 | 896 | $1,750 | $1.95 | 13d | 1 | 1.34mi |
| 1506 W Orangeburg Ave Unit 1506 Modesto, CA | 2.0 | 1.0 | 780 | $1,600 | $2.05 | 13d | 1 | 1.41mi |
| 2712 Peek Ct Modesto, CA | 3.0 | 2.0 | 1408 | $2,350 | $1.67 | 13d | 1 | 1.41mi |
Tax reassessment forecast CA · Resets to sale price
- Current annual tax
- $592 · $49/mo
- Projected year-2 tax
- $1,444 · $120/mo
- Expected delta
- +$852/yr (+$71/mo · 144.1%)
ⓘ Screening estimate from a state-policy table — verify with the county assessor before closing.
Climate risk First Street
- Flood 7/10 Severe FEMA zone X (unshaded) · 77% chance over 30 yrs
- Wildfire 5/10 Major
- Heat 7/10 Severe 7 d/yr ≥102°F today · 16 d/yr by 30 yrs out
- Wind 1/10 Low
- Air quality 10/10 Extreme 33 unhealthy d/yr today · 38 by 30 yrs out
Nearby sold comps map
Loading sold comps map…
Walkable amenities ~0.75 mi
Loading nearby amenities…
Taxation est. · year 1
- Rental income
- $24,081
- − Mortgage interest
- −$10,643
- − Property taxes
- −$592
- − Insurance
- −$1,748
- − Repairs & maintenance
- −$1,926
- − Management
- −$1,926
- − Depreciation
- −$5,527
- Taxable income
- $1,719
- Est. tax owed @ 24.0%
- −$412
- After-tax cash flow
- $4,316/yr
For passive investors: Depreciation is non-cash, so a rental often shows a tax loss while cash-flowing — sheltering income. Rental losses are passive: they offset passive income freely, and up to $25,000/yr can offset ordinary (W-2) income if you actively participate and your MAGI is under $100k (phasing out to $0 by $150k); unused losses carry forward. On sale, claimed depreciation is recaptured at up to 25%, and gains may owe capital-gains tax (a 1031 exchange can defer both). Figures are a year-1 estimate at your 24.0% rate — not tax advice; consult a CPA.
Schools (NCES district)
- District
- Modesto City Elementary
- NCES district ID
- 0625130
- Math proficiency
- 15% ▼ -7.00%
- Reading proficiency
- 26% ▼ -5.00%
- Median HH income
- $39,725
- Composite
- 17.31/100
- National rank
- #9083
- State rank
- #462 of 517 in CA
Livability — Modesto
- Score
- 63/100
- State rank
- #451
- US rank
- #15229
Category grades
Schools grade is shown separately in the Schools card above.
Census & demographics
- Census place
- Modesto, CA
- County
- Stanislaus County · 445,786 people
- City population
- 225,261
- Metro
- Modesto, CA
- Population (ZIP)
- 48,498
- Household income
- $58,275
- Rent vs Own
- Severe rent burden
- 1964.0
Population outlook (Stanislaus County) Hauer SSP2
- Today (2025)
- 579,493 people
- By 2030
- 598,000 · +3.2%
- By 2040
- 630,930 · +8.9%
- By 2050
- 658,300 · +13.6%
- By 2075
- 712,363 · +22.9%
- By 2100
- 719,805 · +24.2%
Race, ethnicity, and origin ACS 2023
- Neighborhood character
- Predominantly Hispanic (76%)
- Race & ethnicity
- Hispanic / Latino 76% Two or more races 40% White 13% Asian 5% Black 3% Native American 2%
- Hispanic origin (detail)
- Mexican 72%
- Common ancestry
- Russian 1% Lithuanian 1% Slovak 1%
- Foreign-born
- 30% · Canada
- Languages at home
- 34% English-only · Spanish 62% Other Asian/Pacific 2% Other Indo-European 1%
Political lean MEDSL · Stanislaus
- 2024 margin
- R (+11.0) · D 43.2% · R 54.2% · Other 2.6%
- 2008→2024 swing
- -12.7pp toward R · 2008: 1.7pp · 2024: -11.0pp
- All cycles
- 2024: R+11.0 2020: D+0.8 2016: D+0.6 2012: D+0.7 2008: D+1.7
Not yet ingested
- Civics
- —
Market trends
- HPI YoY
- ▼ -405.77%
- Current HPI
- 360.246
- Rent YoY
- —
- Metro
- Modesto, CA
- State GDP YoY
- ▲ 3.21%
- F500 in state
- 116
Industry mix (Fortune 500 HQ in CA)
| Industry | F500 HQs | Revenue |
|---|---|---|
| Technology | 27 | $1,492B |
|
||
| Financial Services | 3 | $174B |
|
||
| Retail | 3 | $44B |
|
||
| Insurance | 3 | $26B |
|
||
| Media / Entertainment | 2 | $115B |
|
||
| Pharmaceuticals / Biotech | 2 | $62B |
|
||
Property tax history
+2.4%/yrLatest (2025): $592 · +5.0% YoY. Source: county tax records.
Cash-flow waterfall
monthlySold comps — $/sqft
last 12 mo · ≤1 miLoading sold comps…