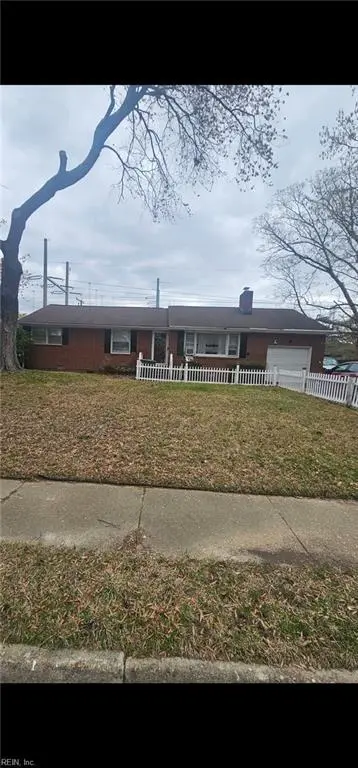
334 Brout Dr · Hampton, VA
Flood risk 1/10 · Minimal
- FEMA flood zone
- X (unshaded)
- Chance of flooding over 30 yrs
- 0.0%
- Est. flood insurance / yr
- $473 – $860
Fire risk 1/10 · Minimal
- Est. fire insurance / yr
- $666 – $1,236
Heat risk 9/10 · Severe
- Hot days now (above 105°F)
- 7 days/yr
- Hot days in 30 yrs
- 16 days/yr
Wind risk 8/10 · Major
- Chance of severe wind over 30 yrs
- 80.0%
Air-quality risk 2/10 · Minimal
- Unhealthy air days now
- 1 days/yr
- Unhealthy air days in 30 yrs
- 1 days/yr
Risk factors via First Street. Map © Google.
Why this score? — see what drove the C grade
The composite is a weighted blend of 9 inputs, each scored 0–100. Each bar is that input's sub-score; the figure is the points it added to the 100-point composite (weight × sub-score).
- Cash flow +16.2/30.0
- ARV discount +15.0/15.0
- Schools +5.5/10.0
- DSCR +5.0/10.0
- 1% rule +4.3/10.0
- Livability +3.8/5.0
- Rent growth +3.5/5.0
- Condition / age +2.5/5.0
- Appreciation +0.0/10.0
$205,000
🖨 Deal sheet (PDF) 📄 Offer letter ✓ Due diligence
Listing remarks
This 3 bedroom 1 1/2 bath Rancher has plenty of potential. Home is a fixer upper and the seller will make no repairs! This property is being sold as is.
Key facts
- 9,600 sq ft lot
- Garage
- Built 1964
Property features AI
Finance
- HOA & community: No homeowners association
Exterior
- Parking: Attached 1-car garage; Additional off-street parking and driveway space
- Utilities: City/County water; City/County sewer; Electric water heater; Electric power
- Home design: Detached ranch-style home; Single-story
- Construction: Crawl foundation
- Exterior features: Brick siding; Wood fence; Asphalt shingle roof; Lot roughly 0.22 acres (approximate); Lot dimensions about 80' x 120'
Interior
- Kitchen: Electric range; Refrigerator
- Bedrooms: At least one bedroom on the first floor
- Flooring: Carpet; Wood
- Bathrooms: One full bathroom; One half bathroom
- Heating & cooling: Baseboard heating; Window/wall air conditioning
- Interior features: One fireplace; Carpet and wood flooring; Bedroom and full bathroom on the first floor; Six total rooms
- Laundry & utility: Washer hookup; Dryer hookup
Neighborhood map
What this means for you Summary
Snapshot
- This is a 3-bed/1.5-bath single-family listed at $205k.
Deal economics
- At list price, monthly cash flow is $109 ($1k/yr) — positive.
- The deal already cash-flows at list — no discount required.
- To meet the 1% rule (rent ≥ 1% of price), the offer needs to be $190k (7.1% below list).
- Recommended offer: $190k (7.1% below list) — sets the bar for 1% rule.
- Cap rate 6.9% vs local median 4.5% in Hampton — top-decile yield for the area; either an underpriced asset or a hidden risk that comps aren't pricing in. Stress-test before assuming the spread holds.
Location & tenants
- Location reads 75/100 on livability (#133 in VA, #4,302 nationally) — a middle-class / working-renter tenant base. Strengths: housing A+, health & safety A+, cost of living A; Watch: crime C-, amenities D+, commute F.
- Hampton City Public School District (urban): math 60% / reading 70% proficiency, ranked #40 of 131 in VA (top 30%) — acceptable for families but not a draw, mixed tenant base, ~2y average lease.
- Zoned schools: Alfred S. Forrest Elementary (math 47% / reading 62%, grade C, #650 of 1,108 statewide, top 62%, 540 students, 85% FRL); Cesar Tarrant Middle (math 64% / reading 71%, grade A-, #98 of 342 statewide, top 30%, 676 students, 74% FRL); Bethel High (math 64% / reading 84%, grade B+, #120 of 319 statewide, top 38%, 1,777 students, 86% FRL) — zoned schools average 82% FRL vs 49% district-wide (33 pts higher); higher-poverty schools than district average — tighter screening recommended.
- Market conditions: Rents rising fast (+4.0%/yr); 238 active listings in the ZIP; 19 comparable units currently listed for rent nearby; rentals at typical pace (median 26d on market — plan ~3-4 weeks tenant-placement turnaround); 68 units permitted in Hampton city in 2024 (0 in 5+ unit buildings).
- This rent runs 31% of the median local income ($73k/yr) — at the standard rent-burdened threshold; future hikes will face affordability resistance.
Forward outlook
- Local home prices are declining (-3.0%/yr); year-one equity from $1k of loan paydown is wiped out by about $6k of value loss. Plan a longer hold.
- Hampton County population projected at -13% by 2050 — secular population decline; favor cash flow + early exit over multi-decade hold.
Negotiation context
- Only 7 days on market — expect competitive offers; lowballing is unlikely to land.
- Current owner paid $86k; list at $205k implies a 138% gain — meaningful room to come down on a strong offer.
Risks & watch-outs
- Climate carrying-cost: severe wind risk, 80% chance of damaging wind over 30y; extreme-heat days projected 7→16/yr by 2055 (HVAC capex compounding) — expect insurance premiums to compound above CPI over the hold.
Questions for the listing agent
- Built in 1964 — when were the roof, HVAC, electrical panel, plumbing, and water heater last replaced?
- Is there a deadline driving the sale (1031 exchange, divorce, estate, relocation)? That informs how much negotiation room exists.
- Schools are B-rated — typically a magnet for longer-tenancy family renters. What's the average tenant stay here, and is there a school-zone premium baked into asking?
- What's the average days-on-market for RENTAL listings here right now (not sales)? A rising rental-DOM trend means longer vacancies and softer asking-rent achievability than the comps imply.
- What's the recent tenant-quality profile in this submarket — average credit score on applications, eviction rate, late-payment / NSF rate, and stable-employment percentage? A property-management company in the area should have these aggregated.
- How much new for-sale + rental construction is in the pipeline within 1–3 miles? Heavy new supply typically softens prices + rents 12–24 months out; constrained supply supports both.
Investment metrics
- 1% rule
- 0.93% ✗
- Cap rate
- 6.93%
- Cash-on-cash
- 2.27%
- DSCR
- 1.10
- GRM
- 9.0
CMA / ARV
- ARV (median comp)
- $263,693
- List price
- $205,000
- Delta
- -22.26%
- Verdict
- UNDERPRICED
- Comps
- 20 within 1.0 mi
Show comp detail 12 sales within ~0.75 mi
| Address | Dist | Beds/Ba | Sqft | Sold | Price | $/sf | Match |
|---|---|---|---|---|---|---|---|
| 8513 Orcutt Ave | 0.38mi | 3/1.0 | 1,282 (+1%) | 3mo | $259,900 | $203 | 76 |
| 444 Martha Lee Dr | 0.31mi | 3/1.5 | 1,348 (+6%) | 1mo | $205,000 | $152 | 74 |
| 17 Roberta Dr | 0.50mi | 3/2.0 | 1,282 (+1%) | 2mo | $320,000 | $250 | 71 |
| 512 Big Bethel Rd | 0.51mi | 3/1.0 | 1,300 (+3%) | 0mo | $250,000 | $192 | 69 |
| 423 Big Bethel Rd | 0.54mi | 3/1.0 | 1,308 (+3%) | 1mo | $245,000 | $187 | 67 |
| 505 Big Bethel Rd | 0.49mi | 3/1.0 | 1,197 (-6%) | 1mo | $268,000 | $224 | 65 |
| 377 Whealton Rd | 0.23mi | 3/2.0 | 1,426 (+13%) | 4mo | $205,000 | $144 | 63 |
| 633 Brewer St | 0.73mi | 3/2.0 | 1,300 (+3%) | 2mo | $255,000 | $196 | 58 |
| 713 Big Bethel Rd | 0.62mi | 4/2.0 (+1) | 1,315 (+4%) | 3mo | $294,000 | $224 | 56 |
| 4827 81st St | 0.50mi | 4/1.0 (+1) | 1,153 (-9%) | 1mo | $263,900 | $229 | 54 |
| 4817 81st St | 0.49mi | 3/2.0 | 1,450 (+14%) | 2mo | $299,000 | $206 | 49 |
| 1008 80th St | 0.60mi | 3/1.0 | 1,121 (-12%) | 2mo | $122,000 | $109 | 49 |
Match score weights: distance 35% · size 25% · config 20% · recency 20%. Top-matched comps best support the ARV.
Projected returns pro-forma
-3.0% appreciation · 4.05% rent growth · sell at horizon
- IRR
- -11.5%
- Equity multiple
- 0.58×
- Total profit
- $-24,243
- Equity at exit
- $30,566
- IRR
- -0.9%
- Equity multiple
- 0.94×
- Total profit
- $-3,608
- Equity at exit
- $17,725
Cash invested: $57,400 (down + closing). Projections, not guarantees.
Landlord ↔ Tenant lean methodology
- Overall (STATE)
- 55 Moderately Landlord-Leaning
- State Virginia
- 55 Moderately Landlord-Leaning · D+2
- County
- — inherits STATE
- City
- — inherits STATE
ZIP-level market 23666
- Home prices YoY
- -15.7%
- Rents YoY
- 4.0%
- Active inventory
- 238
- Price-to-rent
- 9.0×
Monthly cashflow live
- Estimated rent
- $1,903 high interval (Pro) →
- Mortgage (P&I)
- −$1,075
- Tax from tax record
- −$234 /mo · $2,814/yr
- Insurance
- −$85
- HOA
- −$0
- Vacancy / Maint / Mgmt
- −$400
- Net cashflow
- $109
Break-even live
Sensitivity live
| Price | -10% $225 | -5% $167 | +0% $109 | +5% $51 | +10% $-7 |
|---|---|---|---|---|---|
| Rent | -10% $-42 | -5% $34 | +0% $109 | +5% $184 | +10% $259 |
| Rate | -1.0pp $212 | -0.5pp $161 | base $109 | +0.5pp $56 | +1.0pp $2 |
UW: 25.0% down · 7.5% · 30yr · 1.5% tax · 5.0% vac · 8.0% maint · 8.0% mgmt
Financing live
Cash to close
- Down payment
- $51,250
- Closing costs
- $6,150
- Reserves months
- —
- Total cash needed
- —
Loan-product check · same deal, 3 products live
Conventional
25% down · 7.5% · 30yr
- Down + closing
- —
- Monthly P&I
- —
- Monthly cashflow
- —
- DSCR
- —
- Eligible?
- —
Personal DTI + credit; lowest rate.
DSCR
20% down · 8.5% · 30yr
- Down + closing
- —
- Monthly P&I
- —
- Monthly cashflow
- —
- DSCR
- —
- Eligible?
- —
No personal income docs; deal must DSCR.
Hard money
10% down · 12.0% · 12mo
- Down + closing
- —
- Monthly P&I
- —
- Monthly cashflow
- —
- DSCR
- —
- Eligible?
- —
Short-term bridge; refi at stabilization.
Rent comps 19 comps
| Address | Beds | Baths | Sqft | Rent | $/sqft | DOM | Units | Dist |
|---|---|---|---|---|---|---|---|---|
| 314 Martha Lee Dr Hampton, VA | 3.0 | 2.0 | 1210 | $2,200 | $1.82 | 25d | 1 | 0.26mi |
| 346 Sitka Ct Hampton, VA | 3.0 | 1.5 | 1210 | $1,675 | $1.38 | 25d | 1 | 0.41mi |
| 5014 Hazelwood Rd Newport News, VA | 3.0 | 1.0 | 955 | $1,900 | $1.99 | 3d | 1 | 0.50mi |
| 604 Big Bethel Rd Hampton, VA | 3.0 | 1.5 | 1139 | $2,300 | $2.02 | 45d | 1 | 0.52mi |
| 321 Big Bethel Rd Hampton, VA | 3.0 | 1.0 | 1400 | $2,300 | $1.64 | 14d | 1 | 0.77mi |
| 1600 Pennwood Dr Hampton, VA | 2.0 | 1.0 | 881 | $1,350 | $1.53 | 45d | 6 | 0.81mi |
| 1112 74th St Newport News, VA | 3.0 | 1.0 | 928 | $1,500 | $1.62 | 23d | 1 | 0.84mi |
| 37 Pennwood Dr Hampton, VA | 3.0 | 2.0 | 1156 | $1,795 | $1.55 | 25d | 1 | 0.89mi |
| 3318 Custer Ct Hampton, VA | 4.0 | 2.5 | 1625 | $2,500 | $1.54 | 14d | 1 | 0.91mi |
| 606 Randolph Rd Newport News, VA | 3.0 | 1.0 | 989 | $1,475 | $1.49 | 45d | 1 | 1.04mi |
| 6010 Jefferson Ave Newport News, VA | 2.0 | 1.0 | 900 | $1,245 | $1.38 | 45d | 2 | 1.06mi |
| 620 73rd St Newport News, VA | 3.0 | 2.0 | 1203 | $1,900 | $1.58 | 4d | 1 | 1.19mi |
| 602 74th St Newport News, VA | 2.0 | 1.0 | 950 | $1,080 | $1.14 | 25d | 1 | 1.24mi |
| 116 Tyler Ave Unit 1A Newport News, VA | 2.0 | 1.0 | 950 | $1,075 | $1.13 | 45d | 1 | 1.25mi |
| 119 Yorkshire Ter Hampton, VA | 4.0 | 1.5 | 1499 | $2,500 | $1.67 | 25d | 1 | 1.28mi |
| 6206 Hilmar Pl Newport News, VA | 2.0 | 1.0 | 975 | $995 | $1.02 | 45d | 1 | 1.31mi |
| 1115 Briarfield Rd Newport News, VA | 1.0–2.0 | 1.0–2.0 | 1007 | $1,351 | $1.34 | 25d | 1 | 1.37mi |
| 531 Bulkeley Pl Newport News, VA | 2.0–3.0 | 1.0–1.5 | 780 | $1,891 | $2.42 | 3d | 20 | 1.41mi |
| 7 W Lewis Rd Hampton, VA | 3.0 | 2.0 | 1208 | $2,425 | $2.01 | 23d | 1 | 1.41mi |
Listing history 4 events
-
2026-05-08status Under Contract 154-char remark
-
2026-05-01$205,000 Active 154-char remark
-
1998-09-01soldstatus $86,000
-
1992-07-01soldstatus $79,000
ⓘ Source: listings_history table (triggers on properties + properties_extension) + one-shot
backfill from property_details.listing_events for pre-trigger history.
Tax reassessment forecast VA · Resets to sale price
- Current annual tax
- $2,814 · $234/mo
- Projected year-2 tax
- $2,814 · $234/mo
- Expected delta
- $0/yr ($0/mo · 0.0%)
ⓘ Screening estimate from a state-policy table — verify with the county assessor before closing.
Climate risk First Street
- Flood 1/10 Low FEMA zone X (unshaded) · 0% chance over 30 yrs
- Wildfire 1/10 Low
- Heat 9/10 Extreme 7 d/yr ≥105°F today · 16 d/yr by 30 yrs out
- Wind 8/10 Severe 80% chance of damaging wind over 30 yrs
- Air quality 2/10 Low 1 unhealthy d/yr today · 1 by 30 yrs out
Nearby sold comps map
Loading sold comps map…
Walkable amenities ~0.75 mi
Loading nearby amenities…
Taxation est. · year 1
- Rental income
- $22,841
- − Mortgage interest
- −$11,483
- − Property taxes
- −$2,814
- − Insurance
- −$1,025
- − Repairs & maintenance
- −$1,827
- − Management
- −$1,827
- − Depreciation
- −$5,964
- Taxable loss
- −$2,099
- Est. tax savings @ 24.0%
- +$504
- After-tax cash flow
- $1,809/yr
For passive investors: Depreciation is non-cash, so a rental often shows a tax loss while cash-flowing — sheltering income. Rental losses are passive: they offset passive income freely, and up to $25,000/yr can offset ordinary (W-2) income if you actively participate and your MAGI is under $100k (phasing out to $0 by $150k); unused losses carry forward. On sale, claimed depreciation is recaptured at up to 25%, and gains may owe capital-gains tax (a 1031 exchange can defer both). Figures are a year-1 estimate at your 24.0% rate — not tax advice; consult a CPA.
Schools (NCES district)
- District
- Hampton City Public School District
- NCES district ID
- 5101800
- Math proficiency
- 60% ▼ -21.00%
- Reading proficiency
- 70% ▼ -4.00%
- Median HH income
- $50,089
- Composite
- 55.19/100
- National rank
- #1272
- State rank
- #40 of 131 in VA
Livability — Hampton
- Score
- 75/100
- State rank
- #133
- US rank
- #4302
Category grades
Schools grade is shown separately in the Schools card above.
Census & demographics
- Census place
- Hampton, VA
- County
- Hampton City · 132,421 people
- City population
- 132,421
- Metro
- Virginia Beach-Norfolk-Newport News, VA-NC
- Population (ZIP)
- 54,233
- Household income
- $72,568
- Rent vs Own
- Severe rent burden
- 2951.0
Population outlook (Hampton County) Hauer SSP2
- Today (2025)
- 134,055 people
- By 2030
- 131,753 · -1.7%
- By 2040
- 125,017 · -6.7%
- By 2050
- 116,825 · -12.9%
- By 2075
- 97,033 · -27.6%
- By 2100
- 76,188 · -43.2%
Race, ethnicity, and origin ACS 2023
- Neighborhood character
- Diverse neighborhood (Simpson 0.65)
- Race & ethnicity
- Black 51% White 29% Two or more races 10% Hispanic / Latino 9% Asian 4%
- Hispanic origin (detail)
- Mexican 3% Puerto Rican 3%
- Common ancestry
- Italian 1% Lithuanian 1% Romanian 1%
- Foreign-born
- 7% · Canada, Vietnam
- Languages at home
- 90% English-only · Spanish 5% Vietnamese 1% Arabic 1%
Political lean MEDSL · Hampton
- 2024 margin
- Solid D (+39.9) · D 69.2% · R 29.4% · Other 1.4%
- 2008→2024 swing
- +1.0pp no change · 2008: 38.9pp · 2024: 39.9pp
- All cycles
- 2024: D+39.9 2020: D+42.2 2016: D+37.8 2012: D+45.4 2008: D+38.9
Not yet ingested
- Civics
- —
Market trends
- HPI YoY
- ▼ -49.01%
- Current HPI
- 262.821
- Rent YoY
- ▲ 4.05%
- Metro
- Virginia Beach-Norfolk-Newport News, VA-NC
- State GDP YoY
- ▲ 2.40%
- F500 in state
- 50
Industry mix (Fortune 500 HQ in VA)
| Industry | F500 HQs | Revenue |
|---|---|---|
| Aerospace / Defense | 4 | $236B |
|
||
| Technology / Defense | 3 | $32B |
|
||
| Financial Services | 2 | $176B |
|
||
| Utilities | 2 | $27B |
|
||
| Insurance | 2 | $25B |
|
||
| Technology | 2 | $15B |
|
||
Price history
+159.5% since first listed4 events — show timeline
- 2026-05-08 Pending — REINMLS
- 2026-05-01 Listed $205,000 REINMLS
- 1998-09-01 Sold (Public Records) $86,000 Public Records
- 1992-07-01 Sold (Public Records) $79,000 Public Records
Property tax history
+9.1%/yrLatest (2025): $2,814 · +7.9% YoY. Source: county tax records.
Cash-flow waterfall
monthlySold comps — $/sqft
last 12 mo · ≤1 miLoading sold comps…