9376 Brunswick Ave · Kimberly, AL
Flood risk 9/10 · Severe
- FEMA flood zone
- X (unshaded)
- Chance of flooding over 30 yrs
- 0.99%
- Est. flood insurance / yr
- $507 – $1,088
Fire risk 5/10 · Moderate
- Est. fire insurance / yr
- $916 – $1,700
Heat risk 5/10 · Moderate
- Hot days now (above 107°F)
- 7 days/yr
- Hot days in 30 yrs
- 18 days/yr
Wind risk 6/10 · Moderate
- Chance of severe wind over 30 yrs
- 27.0%
Air-quality risk 4/10 · Minor
- Unhealthy air days now
- 4 days/yr
- Unhealthy air days in 30 yrs
- 6 days/yr
Risk factors via First Street. Map © Google.
Why this score? — see what drove the D- grade
The composite is a weighted blend of 9 inputs, each scored 0–100. Each bar is that input's sub-score; the figure is the points it added to the 100-point composite (weight × sub-score).
- Appreciation +10.0/10.0
- Cash flow +7.7/30.0
- ARV discount +7.7/15.0
- Livability +3.3/5.0
- Rent growth +2.5/5.0
- Condition / age +2.5/5.0
- 1% rule +2.3/10.0
- DSCR +1.8/10.0
- Schools +1.8/10.0
$302,380
🖨 Deal sheet (PDF) 📄 Offer letter ✓ Due diligence
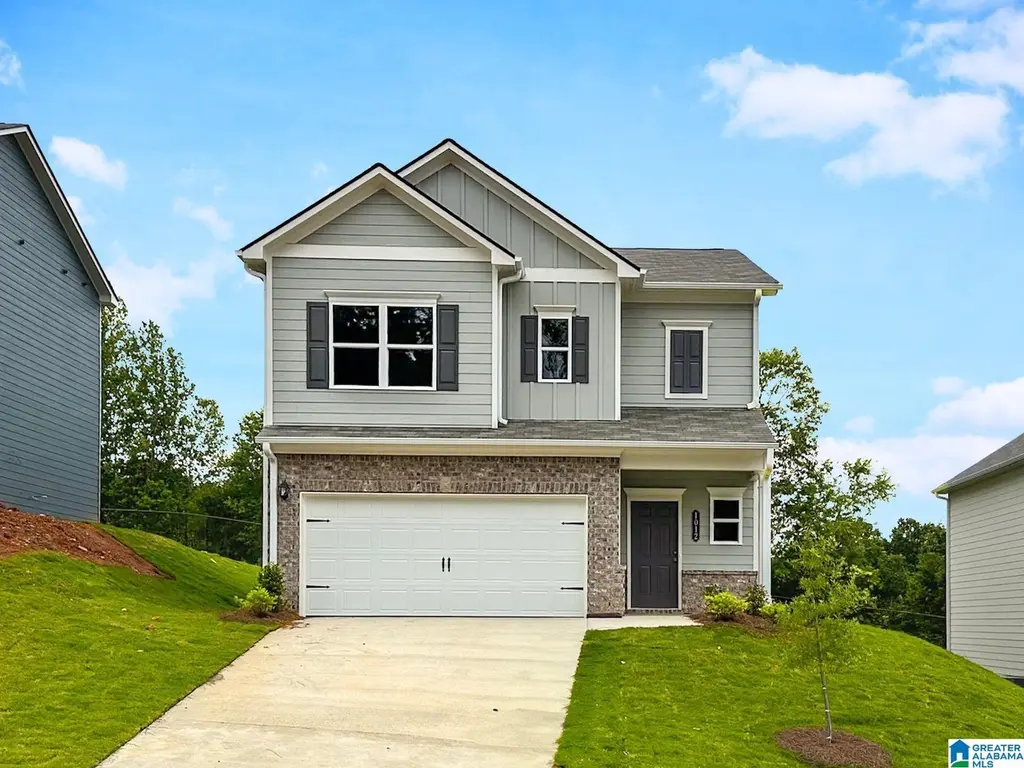
Listing remarks
The Braselton II offers an inviting open-concept design, featuring an open kitchen with a large eat-in island that seamlessly overlooks the light-filled family room, perfect for easy entertaining. With 9ft high ceilings, the home feels spacious and airy. Enjoy the rear corner covered patio, directly accessible from the family room, enhancing your living area. On the second floor, personalize your finishes by opting to convert the spacious loft into a fourth bedroom, providing a buffer between the private owner's suite and two secondary bedrooms. The owner's suite boasts a massive walk-in closet and private bath, with convenient access to the second-floor laundry room. Don't miss the chance
Key facts
- 2 garage spots
- Built 2026
Neighborhood map
What this means for you Summary
Snapshot
- This is a 3-bed/2.5-bath single-family listed at $302k.
Deal economics
- At list price, monthly cash flow is $-418 ($-5k/yr) — negative.
- To cash-flow at today's rent, offer at most $242k (20.0% below list).
- To meet the 1% rule (rent ≥ 1% of price), the offer needs to be $220k (27.2% below list).
- Recommended offer: $220k (27.2% below list) — sets the bar for 1% rule.
Location & tenants
- Location reads 66/100 on livability (#99 in AL) — a middle-class / working-renter tenant base. Strengths: crime A+, employment A+, housing A+; Watch: amenities F, commute F, health & safety F.
- Jefferson County (suburban): math 9% / reading 32% proficiency, ranked #104 of 129 in AL (top 81%) — low school quality limits family demand, transient renter base, plan for 1-2y turnover.
- Zoned schools: Bryant Park Elementary (math 13% / reading 38%, grade F, #411 of 627 statewide, top 66%, 708 students, 62% FRL); North Jefferson Middle School (math 13% / reading 45%, grade F, #134 of 257 statewide, top 53%, 666 students, 52% FRL); Mortimer Jordan High School (math 23% / reading 27%, grade F, #114 of 305 statewide, top 38%, 861 students, 45% FRL) — zoned schools at 53% FRL track the district average.
- Market conditions: 129 active listings in the ZIP; 1 comparable units currently listed for rent nearby; 2,114 units permitted in Jefferson County in 2024 (556 in 5+ unit buildings).
Forward outlook
- In year one you build about $32k of equity ($2k loan paydown + $30k appreciation (10.0% local appreciation)).
- Jefferson County population projected to shrink 4% by 2050 — rents likely to lag national; underwrite the cash flow, not the appreciation.
- By year 2, paydown + projected appreciation supports a ~$52k cash-out refi (75% LTV) — recoverable capital for the next deal without selling this one.
Negotiation context
- Only 0 days on market — expect competitive offers; lowballing is unlikely to land.
Risks & watch-outs
- Watch-outs: flood insurance adds $66/mo.
- Climate carrying-cost: severe flood risk; major wind risk, 27% chance of damaging wind over 30y; moderate wildfire risk; extreme-heat days projected 7→18/yr by 2055 (HVAC capex compounding) — expect insurance premiums to compound above CPI over the hold.
Questions for the listing agent
- What do current leases actually rent for vs. the listed asking? Can we see a recent rent roll and the last 12 months of T-12 income?
- What's the actual annual flood-insurance premium (NFIP or private), and is the property in a SFHA with mandatory coverage?
- Is there a deadline driving the sale (1031 exchange, divorce, estate, relocation)? That informs how much negotiation room exists.
- The area grade is low — what's the realistic commute time and amenity access for the typical tenant pool here? Any planned neighborhood developments (good or bad) we should know about?
- What's the average days-on-market for RENTAL listings here right now (not sales)? A rising rental-DOM trend means longer vacancies and softer asking-rent achievability than the comps imply.
- What's the recent tenant-quality profile in this submarket — average credit score on applications, eviction rate, late-payment / NSF rate, and stable-employment percentage? A property-management company in the area should have these aggregated.
- How much new for-sale + rental construction is in the pipeline within 1–3 miles? Heavy new supply typically softens prices + rents 12–24 months out; constrained supply supports both.
Investment metrics
- 1% rule
- 0.73% ✗
- Cap rate
- 4.90%
- Cash-on-cash
- -4.98%
- DSCR
- 0.78
- GRM
- 11.5
CMA / ARV
- ARV (on-the-fly)
- $303,481
- Comps found
- 7
Show comp detail 7 sales within ~0.75 mi
| Address | Dist | Beds/Ba | Sqft | Sold | Price | $/sf | Match |
|---|---|---|---|---|---|---|---|
| 9340 Brunswick Ave | 0.00mi | 3/2.5 | 1,933 (0%) | 1mo | $288,625 | $149 | 99 |
| 9312 Brunswick Ave | 0.02mi | 3/2.5 | 1,933 (0%) | 3mo | $275,995 | $143 | 96 |
| 9332 Brunswick Ave | 0.07mi | 3/2.0 | 1,740 (-10%) | 4mo | $279,195 | $160 | 75 |
| 9324 Brunswick Ave | 0.04mi | 4/2.0 (+1) | 1,754 (-9%) | 4mo | $289,850 | $165 | 72 |
| 9510 Pharris Ln | 0.34mi | 3/2.0 | 1,753 (-9%) | 4mo | $267,000 | $152 | 64 |
| 1708 Bone Dry Rd | 0.53mi | 3/2.0 | 1,748 (-10%) | 4mo | $287,000 | $164 | 54 |
| 9621 Meadow Ridge Pkwy | 0.36mi | 3/2.5 | 2,064 (+7%) | 23mo | $325,000 | $157 | 52 |
Match score weights: distance 35% · size 25% · config 20% · recency 20%. Top-matched comps best support the ARV.
Projected returns pro-forma
10.0% appreciation · 3.0% rent growth · sell at horizon
- IRR
- 20.1%
- Equity multiple
- 2.63×
- Total profit
- $138,127
- Equity at exit
- $272,408
- IRR
- 18.4%
- Equity multiple
- 6.05×
- Total profit
- $427,850
- Equity at exit
- $587,458
Cash invested: $84,666 (down + closing). Projections, not guarantees.
Landlord ↔ Tenant lean methodology
- Overall (STATE)
- 90 Strongly Landlord-Friendly
- State Alabama
- 90 Strongly Landlord-Friendly · R+15
- County
- — inherits STATE
- City
- — inherits STATE
ZIP-level market 35091
- Home prices YoY
- 8.8%
- Active inventory
- 129
- Price-to-rent
- 11.5×
Monthly cashflow live
- Estimated rent
- $2,200 medium interval (Pro) →
- Mortgage (P&I)
- −$1,586
- Tax est. 1.5%
- −$378 /mo · $4,536/yr
- Insurance
- −$126
- Flood insurance flood zone
- −$66 /mo · $798/yr
- HOA
- −$0
- Vacancy / Maint / Mgmt
- −$462
- Net cashflow
- $-418
Break-even live
Sensitivity live
| Price | -10% $-209 | -5% $-314 | +0% $-418 | +5% $-523 | +10% $-627 |
|---|---|---|---|---|---|
| Rent | -10% $-592 | -5% $-505 | +0% $-418 | +5% $-331 | +10% $-244 |
| Rate | -1.0pp $-266 | -0.5pp $-341 | base $-418 | +0.5pp $-496 | +1.0pp $-576 |
UW: 25.0% down · 7.5% · 30yr · 1.5% tax · 5.0% vac · 8.0% maint · 8.0% mgmt
Financing live
Cash to close
- Down payment
- $75,595
- Closing costs
- $9,071
- Reserves months
- —
- Total cash needed
- —
Loan-product check · same deal, 3 products live
Conventional
25% down · 7.5% · 30yr
- Down + closing
- —
- Monthly P&I
- —
- Monthly cashflow
- —
- DSCR
- —
- Eligible?
- —
Personal DTI + credit; lowest rate.
DSCR
20% down · 8.5% · 30yr
- Down + closing
- —
- Monthly P&I
- —
- Monthly cashflow
- —
- DSCR
- —
- Eligible?
- —
No personal income docs; deal must DSCR.
Hard money
10% down · 12.0% · 12mo
- Down + closing
- —
- Monthly P&I
- —
- Monthly cashflow
- —
- DSCR
- —
- Eligible?
- —
Short-term bridge; refi at stabilization.
Rent comps 1 comps
| Address | Beds | Baths | Sqft | Rent | $/sqft | DOM | Units | Dist |
|---|---|---|---|---|---|---|---|---|
| 516 Way Station Pl Kimberly, AL | 4.0 | 3.0 | 2256 | $2,200 | $0.98 | 3d | 1 | 1.40mi |
Listing history 1 events
-
2026-04-26$302,380
ⓘ Source: listings_history table (triggers on properties + properties_extension) + one-shot
backfill from property_details.listing_events for pre-trigger history.
Climate risk First Street
- Flood 9/10 Extreme FEMA zone X (unshaded) · 99% chance over 30 yrs
- Wildfire 5/10 Major
- Heat 5/10 Major 7 d/yr ≥107°F today · 18 d/yr by 30 yrs out
- Wind 6/10 Major 27% chance of damaging wind over 30 yrs
- Air quality 4/10 Moderate 4 unhealthy d/yr today · 6 by 30 yrs out
Nearby sold comps map
Loading sold comps map…
Walkable amenities ~0.75 mi
Loading nearby amenities…
Taxation est. · year 1
- Rental income
- $26,400
- − Mortgage interest
- −$16,938
- − Property taxes
- −$4,536
- − Insurance
- −$2,309
- − Repairs & maintenance
- −$2,112
- − Management
- −$2,112
- − Depreciation
- −$8,797
- Taxable loss
- −$10,404
- Est. tax savings @ 24.0%
- +$2,497
- After-tax cash flow
- $-2,521/yr
For passive investors: Depreciation is non-cash, so a rental often shows a tax loss while cash-flowing — sheltering income. Rental losses are passive: they offset passive income freely, and up to $25,000/yr can offset ordinary (W-2) income if you actively participate and your MAGI is under $100k (phasing out to $0 by $150k); unused losses carry forward. On sale, claimed depreciation is recaptured at up to 25%, and gains may owe capital-gains tax (a 1031 exchange can defer both). Figures are a year-1 estimate at your 24.0% rate — not tax advice; consult a CPA.
Schools (NCES district)
- District
- Jefferson County
- NCES district ID
- 0101920
- Math proficiency
- 9% ▼ -24.00%
- Reading proficiency
- 32% ▼ -5.00%
- Median HH income
- $51,712
- Composite
- 18.4/100
- National rank
- #8937
- State rank
- #104 of 129 in AL
Livability — Kimberly
- Score
- 66/100
- State rank
- #99
- US rank
- #11415
Category grades
Schools grade is shown separately in the Schools card above.
Census & demographics
- Census place
- Kimberly, AL
- Population (ZIP)
- 3,632
Population outlook (Jefferson County) Hauer SSP2
- Today (2025)
- 669,185 people
- By 2030
- 669,694 · +0.1%
- By 2040
- 661,388 · -1.2%
- By 2050
- 643,086 · -3.9%
- By 2075
- 577,267 · -13.7%
- By 2100
- 474,758 · -29.1%
Race, ethnicity, and origin ACS 2023
- Neighborhood character
- Predominantly White (92%)
- Race & ethnicity
- White 92% Black 5% Two or more races 2%
- Common ancestry
- Italian 7% Slovak 4% Lithuanian 3%
- Foreign-born
- 1% · Canada, South Korea
- Languages at home
- 99% English-only · Korean 1% Other Indo-European 1%
Political lean MEDSL · Jefferson
- 2024 margin
- D (+10.4) · D 54.6% · R 44.2% · Other 1.2%
- 2008→2024 swing
- +5.4pp toward D · 2008: 5.1pp · 2024: 10.4pp
- All cycles
- 2024: D+10.4 2020: D+13.2 2016: D+7.2 2012: D+6.0 2008: D+5.1
Not yet ingested
- Civics
- —
Market trends
- HPI YoY
- ▲ 21.37%
- Current HPI
- 265.4636
- Rent YoY
- —
- Metro
- —
- State GDP YoY
- ▲ 2.94%
- F500 in state
- 4
Industry mix (Fortune 500 HQ in AL)
| Industry | F500 HQs | Revenue |
|---|---|---|
| Financial Services | 1 | $8B |
|
||
| Healthcare | 1 | $5B |
|
||
Price history
1 event — show timeline
- 2026-04-26 Listed $302,380 Greater Alabama MLS
Cash-flow waterfall
monthlySold comps — $/sqft
last 12 mo · ≤1 miLoading sold comps…