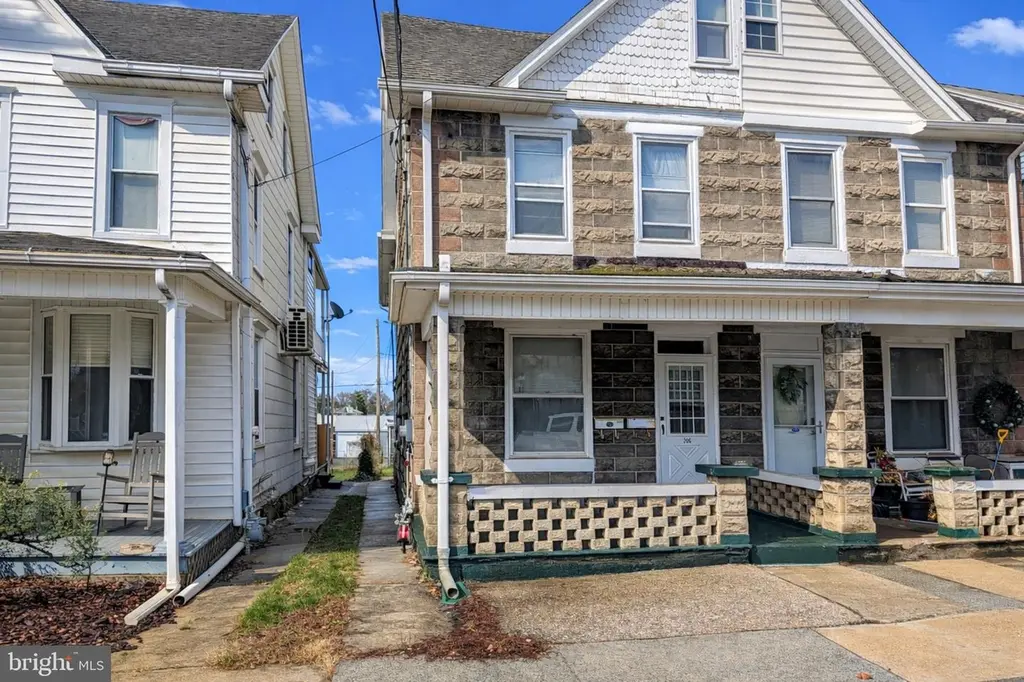
206 Herman Ave · Lemoyne, PA
Flood risk 1/10 · Minimal
- FEMA flood zone
- X (unshaded)
- Chance of flooding over 30 yrs
- 0.0%
- Est. flood insurance / yr
- $507 – $1,088
Fire risk 1/10 · Minimal
- Est. fire insurance / yr
- $511 – $949
Heat risk 5/10 · Moderate
- Hot days now (above 100°F)
- 7 days/yr
- Hot days in 30 yrs
- 15 days/yr
Wind risk 2/10 · Minimal
- Chance of severe wind over 30 yrs
- 4.0%
Air-quality risk 3/10 · Minor
- Unhealthy air days now
- 2 days/yr
- Unhealthy air days in 30 yrs
- 4 days/yr
Risk factors via First Street. Map © Google.
Why this score? — see what drove the F grade
The composite is a weighted blend of 9 inputs, each scored 0–100. Each bar is that input's sub-score; the figure is the points it added to the 100-point composite (weight × sub-score).
- Cash flow +11.7/30.0
- Livability +4.3/5.0
- Schools +4.1/10.0
- DSCR +3.4/10.0
- 1% rule +3.0/10.0
- ARV discount +2.9/15.0
- Rent growth +2.5/5.0
- Condition / age +2.5/5.0
- Appreciation +0.0/10.0
$224,900
🖨 Deal sheet 📄 Offer letter ✓ Due diligence
Listing remarks MLS
This well-maintained 2-unit property presents an exceptional opportunity for both seasoned investors, first-time buyers, or those looking to house hack by living in one unit while generating income from the other. The property features two spacious units, including a first-floor 1-bedroom unit with comfortable living space, currently leased on a month-to-month basis, and a well-sized 2-bedroom unit, also on a month-to-month lease—offering flexibility for future positioning. The property has been carefully maintained and includes two newer furnaces, helping to reduce immediate capital expenditures for the next owner. Ideally located just minutes from Harrisburg and major highways, Lemoyne continues to see strong and consistent rental demand. Whether you're looking to expand your portfolio or secure a smart owner-occupant investment, this is a cash-flow-ready opportunity in a proven and desirable rental market.
Key facts
- Strong rental demand
- Two unit property
- Newer furnaces
Tags
Neighborhood map
What this means for you Summary
Snapshot
- This is a 3-bed/2.0-bath single-family listed at $225k.
Deal economics
- At list price, monthly cash flow is $-68 ($-814/yr) — negative.
- To cash-flow at today's rent, offer at most $213k (5.3% below list).
- To meet the 1% rule (rent ≥ 1% of price), the offer needs to be $180k (19.9% below list).
- Recommended offer: $180k (19.9% below list) — sets the bar for 1% rule.
Location & tenants
- Location reads 86/100 on livability (#60 in PA, #413 nationally) — a professional / high-income tenant draw. Strengths: crime A+, commute A+, cost of living A+; Watch: amenities D+.
- West Shore SD (suburban): math 37% / reading 56% proficiency, ranked #222 of 539 in PA (top 41%) — families likely to look elsewhere, expect single-tenant / working-renter base with shorter leases.
- Market conditions: 25 active listings in the ZIP; 21 comparable units currently listed for rent nearby; rentals at typical pace (median 21d on market — plan ~3-4 weeks tenant-placement turnaround); 1,052 units permitted in Cumberland County in 2024 (310 in 5+ unit buildings).
- This rent runs 35% of the median local income ($61k/yr) — at the standard rent-burdened threshold; future hikes will face affordability resistance.
Forward outlook
- Local home prices are declining (-3.0%/yr); year-one equity from $2k of loan paydown is wiped out by about $7k of value loss. Plan a longer hold.
- Cumberland County population projected at +17% by 2050 — long-run rental-demand tailwind backs the buy-and-hold thesis.
Negotiation context
- It's been on market 74 days — a 6% lower offer ($211k) is reasonable based on typical stale-listing flexibility.
- Current owner paid $148k; list at $225k implies a 52% gain — meaningful room to come down on a strong offer.
Risks & watch-outs
- Climate carrying-cost: extreme-heat days projected 7→15/yr by 2055 (HVAC capex compounding) — expect insurance premiums to compound above CPI over the hold.
Questions for the listing agent
- What do current leases actually rent for vs. the listed asking? Can we see a recent rent roll and the last 12 months of T-12 income?
- It's been on market 74 days. Have you received any prior offers? Is the seller open to a 20% concession, seller financing, or rate buy-down credit?
- Why hasn't it sold? Are there any deal-killer items the seller is aware of (foundation, flood, title, zoning, code violations)?
- Is there a deadline driving the sale (1031 exchange, divorce, estate, relocation)? That informs how much negotiation room exists.
- Schools are B-rated — typically a magnet for longer-tenancy family renters. What's the average tenant stay here, and is there a school-zone premium baked into asking?
- The area grade is low — what's the realistic commute time and amenity access for the typical tenant pool here? Any planned neighborhood developments (good or bad) we should know about?
- What's the average days-on-market for RENTAL listings here right now (not sales)? A rising rental-DOM trend means longer vacancies and softer asking-rent achievability than the comps imply.
- What's the recent tenant-quality profile in this submarket — average credit score on applications, eviction rate, late-payment / NSF rate, and stable-employment percentage? A property-management company in the area should have these aggregated.
- How much new for-sale + rental construction is in the pipeline within 1–3 miles? Heavy new supply typically softens prices + rents 12–24 months out; constrained supply supports both.
Investment metrics
- 1% rule
- 0.80% ✗
- Cap rate
- 5.93%
- Cash-on-cash
- -1.29%
- DSCR
- 0.94
- GRM
- 10.4
CMA / ARV
- ARV (median comp)
- $204,037
- List price
- $224,900
- Delta
- 10.22%
- Verdict
- OVERPRICED
- Comps
- 7 within 1.0 mi
Show comp detail 12 sales within ~0.75 mi
| Address | Dist | Beds/Ba | Sqft | Sold | Price | $/sf | Match |
|---|---|---|---|---|---|---|---|
| 273 Clark St | 0.34mi | 3/1.5 | 1,360 (-4%) | 16mo | $195,000 | $143 | 63 |
| 550 Walton St | 0.48mi | 2/1.0 (-1) | 1,364 (-3%) | 2mo | $276,000 | $202 | 61 |
| 257 Walton St | 0.25mi | 3/1.0 | 1,596 (+13%) | 5mo | $259,900 | $163 | 58 |
| 623 Carol St | 0.51mi | 3/2.5 | 1,350 (-4%) | 16mo | $350,000 | $259 | 54 |
| 730 Harding St | 0.64mi | 3/1.5 | 1,538 (+9%) | 0mo | $330,000 | $215 | 53 |
| 45 Elm St | 0.62mi | 2/1.0 (-1) | 1,356 (-4%) | 8mo | $140,000 | $103 | 49 |
| 706 Haldeman Blvd | 0.67mi | 3/1.5 | 1,298 (-8%) | 5mo | $316,000 | $243 | 49 |
| 60 N 8th St | 0.68mi | 2/1.5 (-1) | 1,420 (+1%) | 16mo | $253,000 | $178 | 47 |
| 922 Hummel Ave | 0.62mi | 3/1.0 | 1,264 (-10%) | 11mo | $163,000 | $129 | 41 |
| 1181 Shoreham Rd | 0.74mi | 3/1.5 | 1,262 (-10%) | 10mo | $260,000 | $206 | 38 |
| 226 Bailey St | 0.73mi | 3/1.0 | 1,542 (+9%) | 15mo | $300,000 | $195 | 34 |
| 719 Coolidge St | 0.72mi | 4/1.0 (+1) | 1,582 (+12%) | 10mo | $315,000 | $199 | 29 |
Match score weights: distance 35% · size 25% · config 20% · recency 20%. Top-matched comps best support the ARV.
Projected returns pro-forma
-3.0% appreciation · 3.0% rent growth · sell at horizon
- IRR
- -18.4%
- Equity multiple
- 0.35×
- Total profit
- $-40,777
- Equity at exit
- $33,533
- IRR
- -10.8%
- Equity multiple
- 0.35×
- Total profit
- $-41,121
- Equity at exit
- $19,445
Cash invested: $62,972 (down + closing). Projections, not guarantees.
Landlord ↔ Tenant lean methodology
- Overall (STATE)
- 62 Landlord-Friendly
- State Pennsylvania
- 62 Landlord-Friendly · EVEN
- County
- — inherits STATE
- City
- — inherits STATE
ZIP-level market 17043
- Home prices YoY
- -27.0%
- Active inventory
- 25
- Price-to-rent
- 10.4×
Monthly cashflow live
- Estimated rent
- $1,801 high interval (Pro) →
- Mortgage (P&I)
- −$1,179
- Tax from tax record
- −$218 /mo · $2,615/yr
- Insurance
- −$94
- HOA
- −$0
- Vacancy / Maint / Mgmt
- −$378
- Net cashflow
- $-68
Break-even live
UW: 25.0% down · 7.5% · 30yr · 1.5% tax · 5.0% vac · 8.0% maint · 8.0% mgmt
Financing live
Cash to close
- Down payment
- $56,225
- Closing costs
- $6,747
- Reserves months
- —
- Total cash needed
- —
Loan-product check · same deal, 3 products live
Conventional
25% down · 7.5% · 30yr
- Down + closing
- —
- Monthly P&I
- —
- Monthly cashflow
- —
- DSCR
- —
- Eligible?
- —
Personal DTI + credit; lowest rate.
DSCR
20% down · 8.5% · 30yr
- Down + closing
- —
- Monthly P&I
- —
- Monthly cashflow
- —
- DSCR
- —
- Eligible?
- —
No personal income docs; deal must DSCR.
Hard money
10% down · 12.0% · 12mo
- Down + closing
- —
- Monthly P&I
- —
- Monthly cashflow
- —
- DSCR
- —
- Eligible?
- —
Short-term bridge; refi at stabilization.
Rent comps 21 comps
| Address | Beds | Baths | Sqft | Rent | $/sqft | DOM | Units | Dist |
|---|---|---|---|---|---|---|---|---|
| 407 Herman Ave Lemoyne, PA | 3.0 | 2.0 | 1400 | $2,100 | $1.50 | 21d | 1 | 0.15mi |
| 905 Hummel Ave Lemoyne, PA | 2.0 | 1.0 | 1000 | $950 | $0.95 | 43d | 1 | 0.57mi |
| 1149 Columbus Ave Lemoyne, PA | 1.0–2.0 | 1.0–2.0 | 840 | $2,075 | $2.47 | 13d | 9 | 1.10mi |
| 101 S 2nd St Harrisburg, PA | 2.0 | 1.0 | 736 | $1,749 | $2.37 | 13d | 32 | 1.17mi |
| 200 S Court St Harrisburg, PA | 1.0–3.0 | 1.0–2.5 | 950 | $1,800 | $1.89 | 13d | 14 | 1.19mi |
| 7 Hummel Ave Camp Hill, PA | 3.0 | 1.0 | 1100 | $1,275 | $1.16 | 13d | 1 | 1.20mi |
| 321 N Front St Unit 102 Harrisburg, PA | 2.0 | 2.5 | 1562 | $2,395 | $1.53 | 43d | 1 | 1.22mi |
| 116 Pine St Harrisburg, PA | 1.0–2.0 | 1.0–2.0 | 900 | $1,638 | $1.82 | 13d | 14 | 1.24mi |
| 210 Walnut St Unit 206 Harrisburg, PA | 2.0 | 1.0 | 1007 | $1,695 | $1.68 | 13d | 1 | 1.25mi |
| 301 Chestnut St Harrisburg, PA | 4.0 | 1.0–2.5 | 1437 | $2,525 | $1.76 | 13d | 10 | 1.25mi |
| 301 Chestnut St Harrisburg, PA | 1.0–4.0 | 1.0–2.5 | 1437 | $2,097 | $1.46 | 43d | 1 | 1.25mi |
| 319 Market St Harrisburg, PA | 2.0 | 1.5 | 990 | $1,135 | $1.15 | 43d | 1 | 1.30mi |
| 122 State St Apt 2 Harrisburg, PA | 2.0 | 1.0 | 1250 | $1,725 | $1.38 | 13d | 1 | 1.32mi |
| 612 N 2nd St Apt 3 Harrisburg, PA | 2.0 | 1.0 | 1100 | $1,545 | $1.40 | 43d | 1 | 1.37mi |
| 612 N 2nd St Apt 2 Harrisburg, PA | 2.0 | 1.0 | 1050 | $1,445 | $1.38 | 43d | 1 | 1.37mi |
| 618 N 2nd St Harrisburg, PA | 2.0 | 1.0 | 1000 | $1,050 | $1.05 | 23d | 1 | 1.37mi |
| 425 7th St New Cumberland, PA | 2.0 | 1.5 | 1050 | $975 | $0.93 | 21d | 1 | 1.40mi |
| 420 7th St New Cumberland, PA | 3.0 | 1.5 | 1800 | $1,495 | $0.83 | 23d | 1 | 1.42mi |
| 711 N 2nd St Apt 2 Harrisburg, PA | 2.0 | 1.0 | 1400 | $1,595 | $1.14 | 43d | 1 | 1.42mi |
| 719 N 2nd St Apt 6 Harrisburg, PA | 2.0 | 1.0 | 1000 | $1,150 | $1.15 | 13d | 1 | 1.43mi |
| 508 N 2nd St Wormleysburg, PA | 2.0 | 1.0 | 887 | $1,395 | $1.57 | 43d | 1 | 1.44mi |
Listing history 14 events
-
2026-06-14statusdays on market $224,900 Pending 74 DOM
-
2026-06-10days on market $224,900 Active 72 DOM
-
2026-06-09days on market $224,900 Active 71 DOM
-
2026-06-08days on market $224,900 Active 70 DOM
-
2026-06-07days on market $224,900 Active 69 DOM
-
2026-06-05days on market $224,900 Active 66 DOM
-
2026-06-03days on market $224,900 Active 65 DOM
-
2026-06-02days on market $224,900 Active 64 DOM
-
2026-06-01days on market $224,900 Active 63 DOM
-
2026-05-31days on market $224,900 Active 62 DOM
-
2026-05-31days on market $224,900 Active 61 DOM
-
2026-04-17price $229,900 928-char remark
Show marketing remark (928 chars)
This well-maintained 2-unit property presents an exceptional opportunity for both seasoned investors, first-time buyers, or those looking to house hack by living in one unit while generating income from the other. The property features two spacious units, including a first-floor 1-bedroom unit with comfortable living space, currently leased on a month-to-month basis, and a well-sized 2-bedroom unit, also on a month-to-month lease—offering flexibility for future positioning. The property has been carefully maintained and includes two newer furnaces, helping to reduce immediate capital expenditures for the next owner. Ideally located just minutes from Harrisburg and major highways, Lemoyne continues to see strong and consistent rental demand. Whether you're looking to expand your portfolio or secure a smart owner-occupant investment, this is a cash-flow-ready opportunity in a proven and desirable rental market.
-
2026-03-30$239,900 Active 928-char remark
Show marketing remark (928 chars)
This well-maintained 2-unit property presents an exceptional opportunity for both seasoned investors, first-time buyers, or those looking to house hack by living in one unit while generating income from the other. The property features two spacious units, including a first-floor 1-bedroom unit with comfortable living space, currently leased on a month-to-month basis, and a well-sized 2-bedroom unit, also on a month-to-month lease—offering flexibility for future positioning. The property has been carefully maintained and includes two newer furnaces, helping to reduce immediate capital expenditures for the next owner. Ideally located just minutes from Harrisburg and major highways, Lemoyne continues to see strong and consistent rental demand. Whether you're looking to expand your portfolio or secure a smart owner-occupant investment, this is a cash-flow-ready opportunity in a proven and desirable rental market.
-
2022-12-28soldstatus $148,000
ⓘ Source: listings_history table (triggers on properties + properties_extension) + one-shot
backfill from property_details.listing_events for pre-trigger history.
Tax reassessment forecast PA · Partial reset (capped growth)
- Current annual tax
- $2,615 · $218/mo
- Projected year-2 tax
- $3,084 · $257/mo
- Expected delta
- +$469/yr (+$39/mo · 17.9%)
ⓘ Screening estimate from a state-policy table — verify with the county assessor before closing.
Climate risk First Street
- Flood 1/10 Low FEMA zone X (unshaded) · 0% chance over 30 yrs
- Wildfire 1/10 Low
- Heat 5/10 Major 7 d/yr ≥100°F today · 15 d/yr by 30 yrs out
- Wind 2/10 Low 4% chance of damaging wind over 30 yrs
- Air quality 3/10 Moderate 2 unhealthy d/yr today · 4 by 30 yrs out
Nearby sold comps map
Loading sold comps map…
Walkable amenities ~0.75 mi
Loading nearby amenities…
Taxation est. · year 1
- Rental income
- $21,618
- − Mortgage interest
- −$12,598
- − Property taxes
- −$2,615
- − Insurance
- −$1,124
- − Repairs & maintenance
- −$1,729
- − Management
- −$1,729
- − Depreciation
- −$6,543
- Taxable loss
- −$4,721
- Est. tax savings @ 24.0%
- +$1,133
- After-tax cash flow
- $319/yr
For passive investors: Depreciation is non-cash, so a rental often shows a tax loss while cash-flowing — sheltering income. Rental losses are passive: they offset passive income freely, and up to $25,000/yr can offset ordinary (W-2) income if you actively participate and your MAGI is under $100k (phasing out to $0 by $150k); unused losses carry forward. On sale, claimed depreciation is recaptured at up to 25%, and gains may owe capital-gains tax (a 1031 exchange can defer both). Figures are a year-1 estimate at your 24.0% rate — not tax advice; consult a CPA.
Schools (NCES district)
- District
- West Shore SD
- NCES district ID
- 4225830
- Math proficiency
- 37% ▼ -12.00%
- Reading proficiency
- 56% ▼ -10.00%
- Median HH income
- $61,398
- Composite
- 40.9/100
- National rank
- #3617
- State rank
- #222 of 539 in PA
Livability — Lemoyne
- Score
- 86/100
- State rank
- #60
- US rank
- #413
Category grades
Schools grade is shown separately in the Schools card above.
Census & demographics
- Census place
- Lemoyne, PA
- County
- Cumberland County · 257,673 people
- City population
- 5,852
- Metro
- Harrisburg-Carlisle, PA
- Population (ZIP)
- 5,852
- Household income
- $61,173
- Rent vs Own
- Severe rent burden
- 444.0
Population outlook (Cumberland County) Hauer SSP2
- Today (2025)
- 267,950 people
- By 2030
- 278,105 · +3.8%
- By 2040
- 296,552 · +10.7%
- By 2050
- 312,937 · +16.8%
- By 2075
- 349,233 · +30.3%
- By 2100
- 361,875 · +35.1%
Race, ethnicity, and origin ACS 2023
- Neighborhood character
- Predominantly White (88%)
- Race & ethnicity
- White 88% Two or more races 5% Black 4% Asian 2%
- Common ancestry
- Polish 3% Slovak 3% Romanian 2%
- Foreign-born
- 5% · Canada, China
- Languages at home
- 93% English-only · Russian/Polish/Slavic 3% Other Indo-European 1% German/W. Germanic 1%
Political lean MEDSL · Cumberland
- 2024 margin
- Lean R (+9.4) · D 44.6% · R 54.1% · Other 1.3%
- 2008→2024 swing
- +4.2pp toward D · 2008: -13.6pp · 2024: -9.4pp
- All cycles
- 2024: R+9.4 2020: R+10.6 2016: R+18.6 2012: R+18.5 2008: R+13.6
Not yet ingested
- Civics
- —
Market trends
- HPI YoY
- ▼ -84.77%
- Current HPI
- 229.3436
- Rent YoY
- —
- Metro
- Harrisburg-Carlisle, PA
- State GDP YoY
- ▲ 1.68%
- F500 in state
- 34
Industry mix (Fortune 500 HQ in PA)
| Industry | F500 HQs | Revenue |
|---|---|---|
| Healthcare | 2 | $309B |
|
||
| Insurance | 2 | $27B |
|
||
| Telecommunications / Media | 1 | $124B |
|
||
| Industrial Distribution | 1 | $22B |
|
||
| Financial Services | 1 | $20B |
|
||
| Chemicals / Materials | 1 | $18B |
|
||
Price history
+55.3% since first listed3 events — show timeline
- 2026-04-17 Price Changed $229,900 BRIGHT MLS
- 2026-03-30 Listed $239,900 BRIGHT MLS
- 2022-12-28 Sold (Public Records) $148,000 Public Records
Property tax history
+3.7%/yrLatest (2026): $2,615 · +2.2% YoY. Source: county tax records.
Cash-flow waterfall
monthlySold comps — $/sqft
last 12 mo · ≤1 miLoading sold comps…