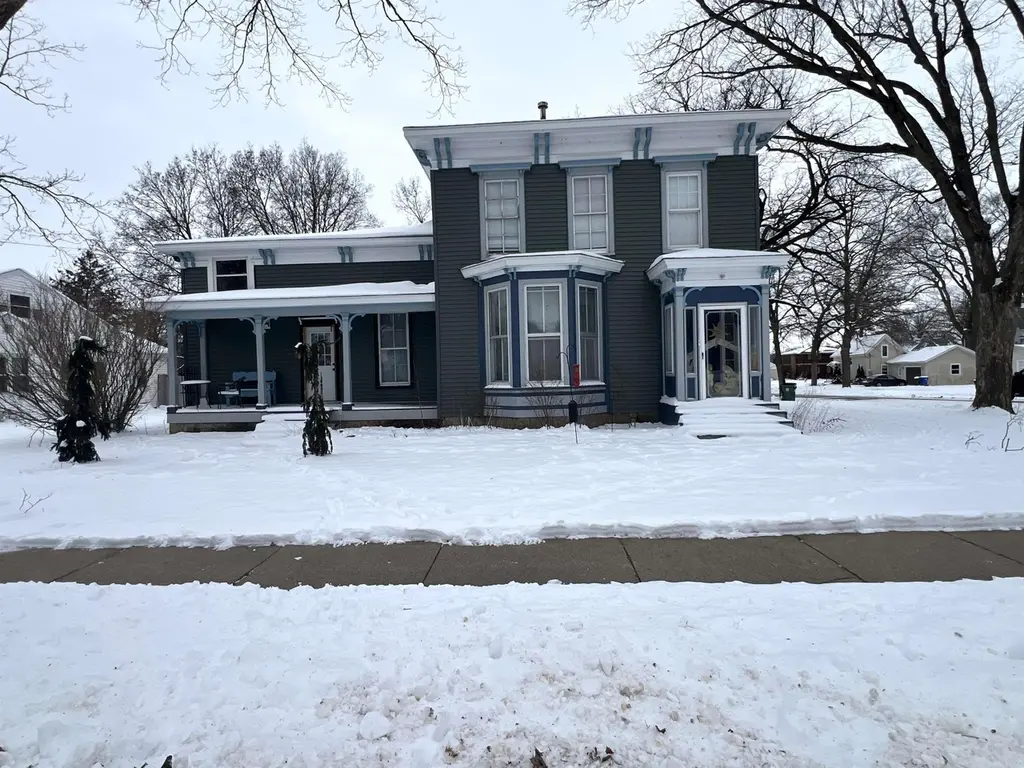
300 Kelly St · Charles City, IA
Flood risk 1/10 · Minimal
- FEMA flood zone
- X (unshaded)
- Chance of flooding over 30 yrs
- 0.0%
- Est. flood insurance / yr
- $473 – $860
Fire risk 3/10 · Minor
- Est. fire insurance / yr
- $902 – $1,676
Heat risk 2/10 · Minimal
- Hot days now (above 101°F)
- 7 days/yr
- Hot days in 30 yrs
- 16 days/yr
Wind risk 2/10 · Minimal
- Chance of severe wind over 30 yrs
- —
Air-quality risk 1/10 · Minimal
- Unhealthy air days now
- 0 days/yr
- Unhealthy air days in 30 yrs
- 0 days/yr
Risk factors via First Street. Map © Google.
Why this score? — see what drove the B+ grade
The composite is a weighted blend of 9 inputs, each scored 0–100. Each bar is that input's sub-score; the figure is the points it added to the 100-point composite (weight × sub-score).
- Cash flow +30.0/30.0
- ARV discount +15.0/15.0
- 1% rule +10.0/10.0
- DSCR +10.0/10.0
- Schools +4.7/10.0
- Livability +3.9/5.0
- Rent growth +2.5/5.0
- Condition / age +2.5/5.0
- Appreciation +0.0/10.0
$80,000
🖨 Deal sheet 📄 Offer letter ✓ Due diligence
Listing remarks MLS
A diamond in the rough awaiting your finishing touches. Located only 2 blocks from the Cedar River, walking bridge, and Sunset Park, this home has a ton of potential. Some great features include 3 bedrooms, 2.25 baths, refinished hardwood floors, built ins, wood burning fireplace, large corner lot, gazebo, and brand new siding and roof installed in July 2025. Don't miss your chance for your dream home! Call today to see all this home has to offer!
Key facts
- 0.27 acre lot
- Built 1920
- Listed 180 days
Neighborhood map
What this means for you Summary
Snapshot
- This is a 3-bed/2.5-bath single-family listed at $80k.
Deal economics
- At list price, monthly cash flow is $451 ($5k/yr) — positive.
- The deal already cash-flows at list — no discount required.
- Meets the 1% rule at list price ($1k rent vs $80k).
- Recommended offer: $70k (12.0% below list) — sets the bar for market timing.
- Cap rate 13.1% vs local median 6.5% in Charles City — top-decile yield for the area; either an underpriced asset or a hidden risk that comps aren't pricing in. Stress-test before assuming the spread holds.
Location & tenants
- Location reads 77/100 on livability (#161 in IA, #2,944 nationally) — a middle-class / working-renter tenant base. Strengths: cost of living A+, health & safety A+, housing A; Watch: amenities F, commute F, employment F.
- Charles City Community School District (town): math 52% / reading 61% proficiency, ranked #262 of 289 in IA (top 91%) — acceptable for families but not a draw, mixed tenant base, ~2y average lease.
- Market conditions: 70 active listings in the ZIP; 38 units permitted in Floyd County in 2024 (0 in 5+ unit buildings).
Forward outlook
- Local home prices are declining (-3.0%/yr); year-one equity from $553 of loan paydown is wiped out by about $2k of value loss. Plan a longer hold.
- Floyd County population projected to shrink 6% by 2050 — rents likely to lag national; underwrite the cash flow, not the appreciation.
- At projected returns (-3.0% appreciation + 3.0% rent growth), your $22k cash investment doubles in ~6 years — after that, you're playing with house money.
Negotiation context
- It's been on market 180 days — a 12% lower offer ($70k) is reasonable based on typical stale-listing flexibility.
- 6 sale attempts since 6y ago; this cycle's ask has dropped $20k (20%) from the opening price — seller is motivated, your offer sets the floor, not the list.
Risks & watch-outs
- Watch-outs: built in 1920 — expect roof / HVAC / electrical / plumbing capex.
Questions for the listing agent
- It's been on market 180 days. Have you received any prior offers? Is the seller open to a 12% concession, seller financing, or rate buy-down credit?
- Built in 1920 — when were the roof, HVAC, electrical panel, plumbing, and water heater last replaced?
- Why hasn't it sold? Are there any deal-killer items the seller is aware of (foundation, flood, title, zoning, code violations)?
- Is there a deadline driving the sale (1031 exchange, divorce, estate, relocation)? That informs how much negotiation room exists.
- What's the average days-on-market for RENTAL listings here right now (not sales)? A rising rental-DOM trend means longer vacancies and softer asking-rent achievability than the comps imply.
- What's the recent tenant-quality profile in this submarket — average credit score on applications, eviction rate, late-payment / NSF rate, and stable-employment percentage? A property-management company in the area should have these aggregated.
- How much new for-sale + rental construction is in the pipeline within 1–3 miles? Heavy new supply typically softens prices + rents 12–24 months out; constrained supply supports both.
Investment metrics
- 1% rule
- 1.57% ✓
- Cap rate
- 13.05%
- Cash-on-cash
- 24.15%
- DSCR
- 2.07
- GRM
- 5.3
CMA / ARV
- ARV (median comp)
- $136,348
- List price
- $80,000
- Delta
- -41.33%
- Verdict
- UNDERPRICED
- Comps
- 20 within 1.0 mi
Show comp detail 12 sales within ~0.75 mi
| Address | Dist | Beds/Ba | Sqft | Sold | Price | $/sf | Match |
|---|---|---|---|---|---|---|---|
| 124 Cedar Cir | 0.38mi | 3/2.5 | 2,028 (+1%) | 3mo | $354,000 | $175 | 79 |
| 306 S Johnson St | 0.42mi | 3/2.0 | 2,080 (+3%) | 3mo | $123,000 | $59 | 71 |
| 407 Spriggs St | 0.31mi | 4/1.5 (+1) | 2,100 (+4%) | 12mo | $165,000 | $79 | 60 |
| 212 Cedar Cir | 0.32mi | 3/2.0 | 1,803 (-11%) | 9mo | $305,000 | $169 | 58 |
| 104 Hilltop Dr | 0.42mi | 4/1.5 (+1) | 1,852 (-8%) | 2mo | $245,000 | $132 | 56 |
| 500 Kelly St | 0.13mi | 4/2.0 (+1) | 1,826 (-9%) | 20mo | $213,000 | $117 | 54 |
| 317 4th Ave | 0.74mi | 3/2.0 | 1,864 (-8%) | 1mo | $161,000 | $86 | 50 |
| 200 Glenwood Rd | 0.40mi | 4/2.5 (+1) | 2,184 (+8%) | 20mo | $211,500 | $97 | 46 |
| 600 S Iowa St | 0.61mi | 4/2.0 (+1) | 1,825 (-10%) | 4mo | $187,000 | $102 | 45 |
| 709 S Johnson St St | 0.69mi | 3/2.0 | 1,834 (-9%) | 7mo | $140,000 | $76 | 45 |
| 203 Hart St | 0.47mi | 2/2.0 (-1) | 1,758 (-13%) | 9mo | $129,500 | $74 | 42 |
| 108 3rd Ave Ave | 0.62mi | 4/2.5 (+1) | 2,200 (+9%) | 11mo | $149,000 | $68 | 42 |
Match score weights: distance 35% · size 25% · config 20% · recency 20%. Top-matched comps best support the ARV.
Projected returns pro-forma
-3.0% appreciation · 3.0% rent growth · sell at horizon
- IRR
- 17.4%
- Equity multiple
- 1.70×
- Total profit
- $15,754
- Equity at exit
- $11,928
- IRR
- 25.9%
- Equity multiple
- 3.26×
- Total profit
- $50,729
- Equity at exit
- $6,917
Cash invested: $22,400 (down + closing). Projections, not guarantees.
Landlord ↔ Tenant lean methodology
- Overall (STATE)
- 83 Strongly Landlord-Friendly
- State Iowa
- 83 Strongly Landlord-Friendly · R+6
- County
- — inherits STATE
- City
- — inherits STATE
ZIP-level market 50616
- Home prices YoY
- -19.7%
- Active inventory
- 70
- Price-to-rent
- 5.3×
Monthly cashflow live
- Estimated rent
- $1,255 medium interval (Pro) →
- Mortgage (P&I)
- −$420
- Tax from tax record
- −$88 /mo · $1,054/yr
- Insurance
- −$33
- HOA
- −$0
- Vacancy / Maint / Mgmt
- −$264
- Net cashflow
- $451
Break-even live
UW: 25.0% down · 7.5% · 30yr · 1.5% tax · 5.0% vac · 8.0% maint · 8.0% mgmt
Financing live
Cash to close
- Down payment
- $20,000
- Closing costs
- $2,400
- Reserves months
- —
- Total cash needed
- —
Loan-product check · same deal, 3 products live
Conventional
25% down · 7.5% · 30yr
- Down + closing
- —
- Monthly P&I
- —
- Monthly cashflow
- —
- DSCR
- —
- Eligible?
- —
Personal DTI + credit; lowest rate.
DSCR
20% down · 8.5% · 30yr
- Down + closing
- —
- Monthly P&I
- —
- Monthly cashflow
- —
- DSCR
- —
- Eligible?
- —
No personal income docs; deal must DSCR.
Hard money
10% down · 12.0% · 12mo
- Down + closing
- —
- Monthly P&I
- —
- Monthly cashflow
- —
- DSCR
- —
- Eligible?
- —
Short-term bridge; refi at stabilization.
Listing history 23 events
-
2026-06-04days on market $80,000 Active 180 DOM
-
2026-06-02days on market $80,000 Active 179 DOM
-
2026-06-01days on market $80,000 Active 178 DOM
-
2026-05-31days on market $80,000 Active 177 DOM
-
2026-05-31days on market $80,000 Active 176 DOM
-
2026-05-04price $80,000 453-char remark
Show marketing remark (449 chars)
A diamond in the rough awaiting your finishing touches. Located only 2 blocks from the Cedar River, walking bridge, and Sunset Park, this home has a ton of potential. Some great features include 3 bedrooms, 2.25 baths, refinished hardwood floors, built ins, woodburning fireplace, large corner lot, gazebo, and brand new siding and roof installed in July 2025. Don't miss your chance for you dream home! Call today to see all this home has to offer!
-
2026-05-04price $80,000 449-char remark
Show marketing remark (449 chars)
A diamond in the rough awaiting your finishing touches. Located only 2 blocks from the Cedar River, walking bridge, and Sunset Park, this home has a ton of potential. Some great features include 3 bedrooms, 2.25 baths, refinished hardwood floors, built ins, woodburning fireplace, large corner lot, gazebo, and brand new siding and roof installed in July 2025. Don't miss your chance for you dream home! Call today to see all this home has to offer!
-
2026-03-12price $90,000 453-char remark
Show marketing remark (449 chars)
A diamond in the rough awaiting your finishing touches. Located only 2 blocks from the Cedar River, walking bridge, and Sunset Park, this home has a ton of potential. Some great features include 3 bedrooms, 2.25 baths, refinished hardwood floors, built ins, woodburning fireplace, large corner lot, gazebo, and brand new siding and roof installed in July 2025. Don't miss your chance for you dream home! Call today to see all this home has to offer!
-
2026-03-12price $90,000 449-char remark
Show marketing remark (449 chars)
A diamond in the rough awaiting your finishing touches. Located only 2 blocks from the Cedar River, walking bridge, and Sunset Park, this home has a ton of potential. Some great features include 3 bedrooms, 2.25 baths, refinished hardwood floors, built ins, woodburning fireplace, large corner lot, gazebo, and brand new siding and roof installed in July 2025. Don't miss your chance for you dream home! Call today to see all this home has to offer!
-
2025-12-05$99,900 Active 449-char remark
Show marketing remark (453 chars)
A diamond in the rough awaiting your finishing touches. Located only 2 blocks from the Cedar River, walking bridge, and Sunset Park, this home has a ton of potential. Some great features include 3 bedrooms, 2.25 baths, refinished hardwood floors, built ins, wood burning fireplace, large corner lot, gazebo, and brand new siding and roof installed in July 2025. Don't miss your chance for your dream home! Call today to see all this home has to offer!
-
2025-12-05$99,900 Active 453-char remark
Show marketing remark (453 chars)
A diamond in the rough awaiting your finishing touches. Located only 2 blocks from the Cedar River, walking bridge, and Sunset Park, this home has a ton of potential. Some great features include 3 bedrooms, 2.25 baths, refinished hardwood floors, built ins, wood burning fireplace, large corner lot, gazebo, and brand new siding and roof installed in July 2025. Don't miss your chance for your dream home! Call today to see all this home has to offer!
-
2022-05-17soldstatus $82,500
-
2022-05-16soldstatus $82,500
-
2022-05-16soldstatus $82,500
-
2022-03-08$82,500
-
2022-03-08$82,500
-
2021-04-12soldstatus $65,000
-
2021-04-09soldstatus $65,000
-
2021-04-09soldstatus $65,000
-
2020-12-30$65,000
-
2020-12-30$65,000
-
2008-03-21soldstatus $72,500
-
2007-03-29soldstatus $63,500
ⓘ Source: listings_history table (triggers on properties + properties_extension) + one-shot
backfill from property_details.listing_events for pre-trigger history.
Tax reassessment forecast IA · Partial reset (capped growth)
- Current annual tax
- $1,054 · $88/mo
- Projected year-2 tax
- $1,155 · $96/mo
- Expected delta
- +$101/yr (+$8/mo · 9.6%)
ⓘ Screening estimate from a state-policy table — verify with the county assessor before closing.
Climate risk First Street
- Flood 1/10 Low FEMA zone X (unshaded) · 0% chance over 30 yrs
- Wildfire 3/10 Moderate
- Heat 2/10 Low 7 d/yr ≥101°F today · 16 d/yr by 30 yrs out
- Wind 2/10 Low
- Air quality 1/10 Low 0 unhealthy d/yr today · 0 by 30 yrs out
Nearby sold comps map
Loading sold comps map…
Walkable amenities ~0.75 mi
Loading nearby amenities…
Taxation est. · year 1
- Rental income
- $15,059
- − Mortgage interest
- −$4,481
- − Property taxes
- −$1,054
- − Insurance
- −$400
- − Repairs & maintenance
- −$1,205
- − Management
- −$1,205
- − Depreciation
- −$2,327
- Taxable income
- $4,387
- Est. tax owed @ 24.0%
- −$1,053
- After-tax cash flow
- $4,356/yr
For passive investors: Depreciation is non-cash, so a rental often shows a tax loss while cash-flowing — sheltering income. Rental losses are passive: they offset passive income freely, and up to $25,000/yr can offset ordinary (W-2) income if you actively participate and your MAGI is under $100k (phasing out to $0 by $150k); unused losses carry forward. On sale, claimed depreciation is recaptured at up to 25%, and gains may owe capital-gains tax (a 1031 exchange can defer both). Figures are a year-1 estimate at your 24.0% rate — not tax advice; consult a CPA.
Schools (NCES district)
- District
- Charles City Community School District
- NCES district ID
- 1907080
- Math proficiency
- 52% ▼ -3.00%
- Reading proficiency
- 61% ▲ 9.00%
- Median HH income
- $41,414
- Composite
- 47.32/100
- National rank
- #2299
- State rank
- #262 of 289 in IA
Livability — Charles City
- Score
- 77/100
- State rank
- #161
- US rank
- #2944
Category grades
Schools grade is shown separately in the Schools card above.
Census & demographics
- Census place
- Charles City, IA
- City population
- 9,419
- Population (ZIP)
- 9,419
Population outlook (Floyd County) Hauer SSP2
- Today (2025)
- 15,524 people
- By 2030
- 15,254 · -1.7%
- By 2040
- 14,830 · -4.5%
- By 2050
- 14,660 · -5.6%
- By 2075
- 15,548 · +0.2%
- By 2100
- 17,406 · +12.1%
Race, ethnicity, and origin ACS 2023
- Neighborhood character
- Predominantly White (87%)
- Race & ethnicity
- White 87% Two or more races 6% Hispanic / Latino 5% Asian 2% Black 2%
- Hispanic origin (detail)
- Mexican 4%
- Common ancestry
- Portuguese 6% Scandinavian 2% Lithuanian 2%
- Foreign-born
- 5% · Canada
- Languages at home
- 94% English-only · Spanish 2% Other Asian/Pacific 1% Tagalog/Filipino 1%
Political lean MEDSL · Floyd
- 2024 margin
- Strong R (+25.7) · D 36.5% · R 62.2% · Other 1.3%
- 2008→2024 swing
- -47.6pp toward R · 2008: 21.9pp · 2024: -25.7pp
- All cycles
- 2024: R+25.7 2020: R+19.4 2016: R+14.9 2012: D+14.7 2008: D+21.9
Not yet ingested
- Civics
- —
Market trends
- HPI YoY
- ▼ -46.03%
- Current HPI
- 187.4742
- Rent YoY
- —
- Metro
- —
- State GDP YoY
- ▲ 2.48%
- F500 in state
- 4
Industry mix (Fortune 500 HQ in IA)
| Industry | F500 HQs | Revenue |
|---|---|---|
| Financial Services | 1 | $16B |
|
||
| Retail / Convenience | 1 | $15B |
|
||
Price history
+26.0% since first listed18 events — show timeline
- 2026-05-04 Price Changed $80,000 Greater Mason BOR
- 2026-05-04 Price Changed $80,000 NEIRBR as distributed by MLS GRID
- 2026-03-12 Price Changed $90,000 Greater Mason BOR
- 2026-03-12 Price Changed $90,000 NEIRBR as distributed by MLS GRID
- 2025-12-05 Listed $99,900 NEIRBR as distributed by MLS GRID
- 2025-12-05 Listed $99,900 Greater Mason BOR
- 2022-05-17 Sold (Public Records) $82,500 Public Records
- 2022-05-16 Sold (MLS) $82,500 Greater Mason BOR
- 2022-05-16 Sold (MLS) $82,500 IAR
- 2022-03-08 Listed $82,500 Greater Mason BOR
- 2022-03-08 Listed $82,500 IAR
- 2021-04-12 Sold (Public Records) $65,000 Public Records
- 2021-04-09 Sold (MLS) $65,000 Greater Mason BOR
- 2021-04-09 Sold (MLS) $65,000 IAR
- 2020-12-30 Listed $65,000 Greater Mason BOR
- 2020-12-30 Listed $65,000 IAR
- 2008-03-21 Sold (Public Records) $72,500 Public Records
- 2007-03-29 Sold (Public Records) $63,500 Public Records
Property tax history
-1.7%/yrLatest (2025): $1,054 · +0.8% YoY. Source: county tax records.
Cash-flow waterfall
monthlySold comps — $/sqft
last 12 mo · ≤1 miLoading sold comps…