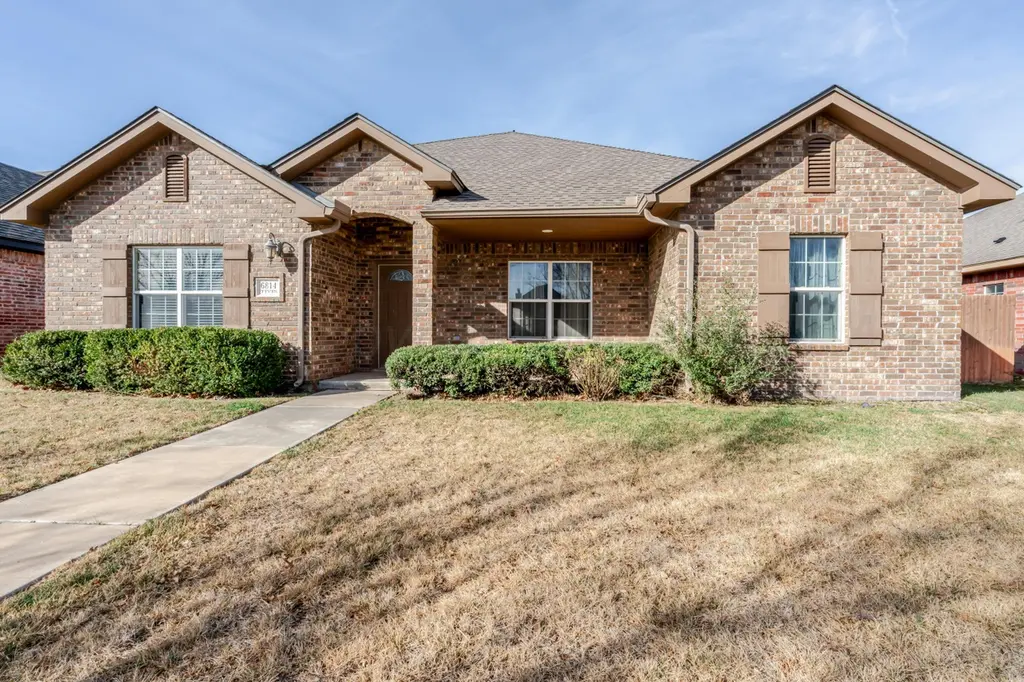
6814 Tivis St · Amarillo, TX
Flood risk 1/10 · Minimal
- FEMA flood zone
- X (unshaded)
- Chance of flooding over 30 yrs
- 0.0%
- Est. flood insurance / yr
- $507 – $1,088
Fire risk 7/10 · Major
- Est. fire insurance / yr
- $1,222 – $2,270
Heat risk 4/10 · Minor
- Hot days now (above 97°F)
- 6 days/yr
- Hot days in 30 yrs
- 15 days/yr
Wind risk 2/10 · Minimal
- Chance of severe wind over 30 yrs
- —
Air-quality risk 2/10 · Minimal
- Unhealthy air days now
- 2 days/yr
- Unhealthy air days in 30 yrs
- 2 days/yr
Risk factors via First Street. Map © Google.
Why this score? — see what drove the D grade
The composite is a weighted blend of 9 inputs, each scored 0–100. Each bar is that input's sub-score; the figure is the points it added to the 100-point composite (weight × sub-score).
- Cash flow +11.6/30.0
- ARV discount +7.5/15.0
- Schools +5.0/10.0
- Rent growth +4.1/5.0
- 1% rule +3.8/10.0
- DSCR +3.4/10.0
- Livability +3.3/5.0
- Condition / age +2.5/5.0
- Appreciation +0.0/10.0
$260,000
🖨 Deal sheet (PDF) 📄 Offer letter ✓ Due diligence
Listing remarks MLS
Wonderful Home with Open Floor plan in Hillside Terrace. Home has 3 bedrooms including a large isolated master, 2 baths, 2 Garages. Granite in kitchen, large breakfast bar, great storage. Washer, Dryer and Refrigerator are negotiable.
Key facts
- 2 garage spots
- Built 2011
- Listed 51 days
Property features AI
Finance
- Other: Residential zoning within city limits (0200 - SW Amarillo)
Exterior
- Parking: Attached garage with rear-facing entry; 2 garage spaces; Garage door opener
- Utilities: Public water; Public sewer
- Home design: Single-family residence; One story
- Construction: Brick and frame construction with brick veneer; Slab foundation; Built with composition roofing
- Exterior features: Wood fencing; Composition roof
Interior
- Kitchen: Dishwasher; Microwave; Range; Disposal
- Bathrooms: 2 full bathrooms
- Heating & cooling: Central electric heating; Central air conditioning; Ceiling fans
- Interior features: Disposal; Dishwasher; Microwave; Range; Electric water heater
Neighborhood map
What this means for you Summary
Snapshot
- This is a 3-bed/2.0-bath single-family listed at $260k.
Deal economics
- At list price, monthly cash flow is $-82 ($-984/yr) — negative.
- To cash-flow at today's rent, offer at most $246k (5.6% below list).
- To meet the 1% rule (rent ≥ 1% of price), the offer needs to be $228k (12.1% below list).
- Recommended offer: $228k (12.1% below list) — sets the bar for 1% rule.
Location & tenants
- Location reads 66/100 on livability (#624 in TX) — a middle-class / working-renter tenant base. Strengths: cost of living A+, housing A+; Watch: amenities C-, crime F, commute F.
- Canyon ISD (town): math 60% / reading 54% proficiency, ranked #78 of 826 in TX (top 9%) — acceptable for families but not a draw, mixed tenant base, ~2y average lease.
- Zoned schools: Hillside El (math 65% / reading 60%, grade B, #311 of 4,322 statewide, top 7%, 348 students, 33% FRL); West Plains J H (math 59% / reading 58%, grade B, #185 of 1,662 statewide, top 12%, 615 students, 33% FRL); West Plains H S (910 students, 31% FRL) — zoned schools at 32% FRL track the district average.
- Market conditions: Rents rising fast (+6.2%/yr); 477 active listings in the ZIP; 13 comparable units currently listed for rent nearby; rentals at typical pace (median 23d on market — plan ~3-4 weeks tenant-placement turnaround); high-income renter base; 45 units permitted in Randall County in 2024 (0 in 5+ unit buildings).
Forward outlook
- Local home prices are declining (-3.0%/yr); year-one equity from $2k of loan paydown is wiped out by about $8k of value loss. Plan a longer hold.
- Randall County population projected at +36% by 2050 — long-run rental-demand tailwind backs the buy-and-hold thesis.
Negotiation context
- It's been on market 51 days — a 3% lower offer ($252k) is reasonable based on typical stale-listing flexibility.
- 4 sale attempts since 11y ago with the ask held roughly flat each time — persistent listings suggest the price (not the market) is what's stuck; bring a comps-based counter.
Risks & watch-outs
- Climate carrying-cost: major wildfire risk — expect insurance premiums to compound above CPI over the hold.
Questions for the listing agent
- What do current leases actually rent for vs. the listed asking? Can we see a recent rent roll and the last 12 months of T-12 income?
- It's been on market 51 days. Have you received any prior offers? Is the seller open to a 12% concession, seller financing, or rate buy-down credit?
- Is there a deadline driving the sale (1031 exchange, divorce, estate, relocation)? That informs how much negotiation room exists.
- Schools are D-rated, which usually means shorter tenancies and higher turnover. Who's the typical renter profile here, and what's been the actual vacancy rate?
- Crime grade is F in this area — have there been break-ins, vandalism, or insurance claims at this property in the last 3 years? What carrier currently insures it and at what premium?
- The area grade is low — what's the realistic commute time and amenity access for the typical tenant pool here? Any planned neighborhood developments (good or bad) we should know about?
- What's the average days-on-market for RENTAL listings here right now (not sales)? A rising rental-DOM trend means longer vacancies and softer asking-rent achievability than the comps imply.
- What's the recent tenant-quality profile in this submarket — average credit score on applications, eviction rate, late-payment / NSF rate, and stable-employment percentage? A property-management company in the area should have these aggregated.
- How much new for-sale + rental construction is in the pipeline within 1–3 miles? Heavy new supply typically softens prices + rents 12–24 months out; constrained supply supports both.
Investment metrics
- 1% rule
- 0.88% ✗
- Cap rate
- 5.91%
- Cash-on-cash
- -1.35%
- DSCR
- 0.94
- GRM
- 9.5
CMA / ARV
No comps found within radius.
Projected returns pro-forma
-3.0% appreciation · 6.21% rent growth · sell at horizon
- IRR
- -14.8%
- Equity multiple
- 0.46×
- Total profit
- $-39,646
- Equity at exit
- $38,767
- IRR
- -1.3%
- Equity multiple
- 0.90×
- Total profit
- $-7,492
- Equity at exit
- $22,480
Cash invested: $72,800 (down + closing). Projections, not guarantees.
Landlord ↔ Tenant lean methodology
- Overall (STATE)
- 87 Strongly Landlord-Friendly
- State Texas
- 87 Strongly Landlord-Friendly · R+5
- County
- — inherits STATE
- City
- — inherits STATE
ZIP-level market 79119
- Home prices YoY
- -19.1%
- Rents YoY
- 6.2%
- Active inventory
- 477
- Price-to-rent
- 9.5×
Monthly cashflow live
- Estimated rent
- $2,285 high interval (Pro) →
- Mortgage (P&I)
- −$1,363
- Tax from tax record
- −$415 /mo · $4,984/yr
- Insurance
- −$108
- HOA
- −$0
- Vacancy / Maint / Mgmt
- −$480
- Net cashflow
- $-82
Break-even live
Sensitivity live
| Price | -10% $65 | -5% $-8 | +0% $-82 | +5% $-156 | +10% $-229 |
|---|---|---|---|---|---|
| Rent | -10% $-263 | -5% $-172 | +0% $-82 | +5% $8 | +10% $99 |
| Rate | -1.0pp $49 | -0.5pp $-16 | base $-82 | +0.5pp $-149 | +1.0pp $-218 |
UW: 25.0% down · 7.5% · 30yr · 1.5% tax · 5.0% vac · 8.0% maint · 8.0% mgmt
Financing live
Cash to close
- Down payment
- $65,000
- Closing costs
- $7,800
- Reserves months
- —
- Total cash needed
- —
Loan-product check · same deal, 3 products live
Conventional
25% down · 7.5% · 30yr
- Down + closing
- —
- Monthly P&I
- —
- Monthly cashflow
- —
- DSCR
- —
- Eligible?
- —
Personal DTI + credit; lowest rate.
DSCR
20% down · 8.5% · 30yr
- Down + closing
- —
- Monthly P&I
- —
- Monthly cashflow
- —
- DSCR
- —
- Eligible?
- —
No personal income docs; deal must DSCR.
Hard money
10% down · 12.0% · 12mo
- Down + closing
- —
- Monthly P&I
- —
- Monthly cashflow
- —
- DSCR
- —
- Eligible?
- —
Short-term bridge; refi at stabilization.
Rent comps 13 comps
| Address | Beds | Baths | Sqft | Rent | $/sqft | DOM | Units | Dist |
|---|---|---|---|---|---|---|---|---|
| 7506 John Thomas St Amarillo, TX | 4.0 | 2.0 | 1732 | $3,200 | $1.85 | 15d | 1 | 0.48mi |
| 7206 Nick St Amarillo, TX | 3.0 | 2.0 | 1939 | $2,200 | $1.13 | 15d | 1 | 0.48mi |
| Mosley St Amarillo, TX | 3.0 | 2.0 | 1636 | $2,000 | $1.22 | 45d | 1 | 0.48mi |
| 7602 Beck Dr Amarillo, TX | 3.0 | 2.0 | 1600 | $2,350 | $1.47 | 23d | 1 | 0.49mi |
| 6801 Mosley St Amarillo, TX | 2.0 | 2.0 | 1497 | $1,725 | $1.15 | 46d | 1 | 0.50mi |
| 7517 John Thomas St Amarillo, TX | 3.0 | 2.0 | 1642 | $2,400 | $1.46 | 46d | 1 | 0.52mi |
| 7514 Beck Dr Amarillo, TX | 3.0 | 2.0 | 1600 | $2,350 | $1.47 | 23d | 1 | 0.58mi |
| 7516 Beck Dr Amarillo, TX | 3.0 | 2.0 | 1600 | $2,350 | $1.47 | 23d | 1 | 0.58mi |
| 7600 Beck Dr Amarillo, TX | 3.0 | 2.0 | 1600 | $2,350 | $1.47 | 23d | 1 | 0.58mi |
| 7615 Arlo Dr Amarillo, TX | 3.0 | 2.0 | 1702 | $2,500 | $1.47 | 23d | 1 | 0.59mi |
| 7628 S Soncy Rd Amarillo, TX | 1.0–3.0 | 1.0–2.0 | 1105 | $1,750 | $1.58 | 15d | 3 | 0.66mi |
| Time Sq Amarillo, TX | 3.0 | 2.0 | 1898 | $2,450 | $1.29 | 23d | 1 | 0.73mi |
| 9181 Town Square Blvd #1241 Amarillo, TX | 1.0–3.0 | 1.0–2.0 | 998 | $1,678 | $1.68 | 45d | 25 | 0.83mi |
Listing history 12 events
-
2026-05-24status Pending
-
2026-04-10historical Active Under Contract
-
2026-04-01$260,000 Active
-
2021-08-11soldstatus
-
2021-08-11soldstatus
-
2021-08-10soldstatus 234-char remark
Show marketing remark (234 chars)
Wonderful Home with Open Floor plan in Hillside Terrace. Home has 3 bedrooms including a large isolated master, 2 baths, 2 Garages. Granite in kitchen, large breakfast bar, great storage. Washer, Dryer and Refrigerator are negotiable.
-
2021-07-02$225,000 234-char remark
Show marketing remark (234 chars)
Wonderful Home with Open Floor plan in Hillside Terrace. Home has 3 bedrooms including a large isolated master, 2 baths, 2 Garages. Granite in kitchen, large breakfast bar, great storage. Washer, Dryer and Refrigerator are negotiable.
-
2017-06-22soldstatus 238-char remark
Show marketing remark (238 chars)
Beautiful home with a great front porch and back paito. Open floor plan, granite counter tops in the kitchen with an island and bar. Isolated master bedroom with large closet, separate shower and tub. Raised ceilings through out the home.
-
2017-05-18$173,000 238-char remark
Show marketing remark (238 chars)
Beautiful home with a great front porch and back paito. Open floor plan, granite counter tops in the kitchen with an island and bar. Isolated master bedroom with large closet, separate shower and tub. Raised ceilings through out the home.
-
2015-04-28soldstatus
-
2015-04-27soldstatus
-
2015-02-26$165,000
ⓘ Source: listings_history table (triggers on properties + properties_extension) + one-shot
backfill from property_details.listing_events for pre-trigger history.
Tax reassessment forecast TX · Resets to sale price
- Current annual tax
- $4,984 · $415/mo
- Projected year-2 tax
- $4,984 · $415/mo
- Expected delta
- $0/yr ($0/mo · 0.0%)
ⓘ Screening estimate from a state-policy table — verify with the county assessor before closing.
Climate risk First Street
- Flood 1/10 Low FEMA zone X (unshaded) · 0% chance over 30 yrs
- Wildfire 7/10 Severe
- Heat 4/10 Moderate 6 d/yr ≥97°F today · 15 d/yr by 30 yrs out
- Wind 2/10 Low
- Air quality 2/10 Low 2 unhealthy d/yr today · 2 by 30 yrs out
Nearby sold comps map
Loading sold comps map…
Walkable amenities ~0.75 mi
Loading nearby amenities…
Taxation est. · year 1
- Rental income
- $27,420
- − Mortgage interest
- −$14,564
- − Property taxes
- −$4,984
- − Insurance
- −$1,300
- − Repairs & maintenance
- −$2,194
- − Management
- −$2,194
- − Depreciation
- −$7,564
- Taxable loss
- −$5,379
- Est. tax savings @ 24.0%
- +$1,291
- After-tax cash flow
- $307/yr
For passive investors: Depreciation is non-cash, so a rental often shows a tax loss while cash-flowing — sheltering income. Rental losses are passive: they offset passive income freely, and up to $25,000/yr can offset ordinary (W-2) income if you actively participate and your MAGI is under $100k (phasing out to $0 by $150k); unused losses carry forward. On sale, claimed depreciation is recaptured at up to 25%, and gains may owe capital-gains tax (a 1031 exchange can defer both). Figures are a year-1 estimate at your 24.0% rate — not tax advice; consult a CPA.
Schools (NCES district)
- District
- Canyon ISD
- NCES district ID
- 4812810
- Math proficiency
- 60% ▼ -1.00%
- Reading proficiency
- 54% ▼ -1.00%
- Median HH income
- $65,177
- Composite
- 50.07/100
- National rank
- #1912
- State rank
- #78 of 826 in TX
Livability — Amarillo
- Score
- 66/100
- State rank
- #624
- US rank
- #11876
Category grades
Schools grade is shown separately in the Schools card above.
Census & demographics
- Census place
- Amarillo, TX
- County
- Randall County · 137,351 people
- City population
- 185,802
- Metro
- Amarillo, TX
- Population (ZIP)
- 24,907
- Household income
- $114,432
- Rent vs Own
- Severe rent burden
- 272.0
Population outlook (Randall County) Hauer SSP2
- Today (2025)
- 152,140 people
- By 2030
- 163,107 · +7.2%
- By 2040
- 184,999 · +21.6%
- By 2050
- 206,948 · +36.0%
- By 2075
- 260,204 · +71.0%
- By 2100
- 294,980 · +93.9%
Race, ethnicity, and origin ACS 2023
- Neighborhood character
- Predominantly White (74%)
- Race & ethnicity
- White 74% Hispanic / Latino 17% Two or more races 8% Asian 4% Black 2%
- Hispanic origin (detail)
- Mexican 13%
- Common ancestry
- Italian 4% Slovak 2% Iranian 1%
- Foreign-born
- 6% · Canada, China, Vietnam
- Languages at home
- 90% English-only · Spanish 5% Chinese 1% Other Indo-European 1%
Political lean MEDSL · Randall
- 2024 margin
- Solid R (+60.4) · D 19.4% · R 79.8%
- 2008→2024 swing
- +2.3pp toward D · 2008: -62.7pp · 2024: -60.4pp
- All cycles
- 2024: R+60.4 2020: R+58.8 2016: R+65.1 2012: R+68.2 2008: R+62.7
Not yet ingested
- Civics
- —
Market trends
- HPI YoY
- ▼ -39.08%
- Current HPI
- 165.3226
- Rent YoY
- ▲ 6.21%
- Metro
- Amarillo, TX
- State GDP YoY
- ▲ 3.95%
- F500 in state
- 110
Industry mix (Fortune 500 HQ in TX)
| Industry | F500 HQs | Revenue |
|---|---|---|
| Energy | 16 | $1,198B |
|
||
| Technology | 5 | $198B |
|
||
| Engineering / Construction | 4 | $72B |
|
||
| Energy Services | 3 | $60B |
|
||
| Utilities | 3 | $41B |
|
||
| Healthcare | 2 | $330B |
|
||
Price history
+57.6% since first listed12 events — show timeline
- 2026-05-24 Pending — AARMLS
- 2026-04-10 Contingent — AARMLS
- 2026-04-01 Listed $260,000 AARMLS
- 2021-08-11 Sold (Public Records) — Public Records
- 2021-08-11 Sold (Public Records) — Public Records
- 2021-08-10 Sold (MLS) — AARMLS
- 2021-07-02 Listed $225,000 AARMLS
- 2017-06-22 Sold (MLS) — AARMLS
- 2017-05-18 Listed $173,000 AARMLS
- 2015-04-28 Sold (MLS) — AARMLS
- 2015-04-27 Sold (Public Records) — Public Records
- 2015-02-26 Listed $165,000 AARMLS
Property tax history
+3.6%/yrLatest (2025): $4,984 · +3.8% YoY. Source: county tax records.
Cash-flow waterfall
monthlySold comps — $/sqft
last 12 mo · ≤1 miLoading sold comps…