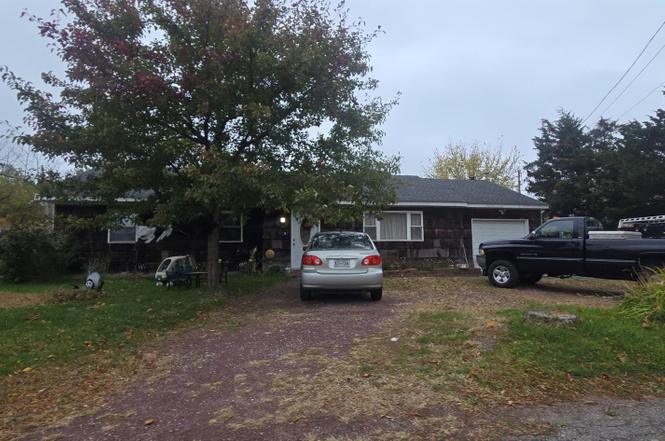
21 Astoria Rd · Mastic Beach, NY
Flood risk 7/10 · Major
- FEMA flood zone
- AE
- Chance of flooding over 30 yrs
- 0.96%
- Est. flood insurance / yr
- $2,026 – $9,024
Fire risk 1/10 · Minimal
- Est. fire insurance / yr
- $691 – $1,283
Heat risk 4/10 · Minor
- Hot days now (above 92°F)
- 7 days/yr
- Hot days in 30 yrs
- 20 days/yr
Wind risk 8/10 · Major
- Chance of severe wind over 30 yrs
- 80.0%
Air-quality risk 4/10 · Minor
- Unhealthy air days now
- 3 days/yr
- Unhealthy air days in 30 yrs
- 5 days/yr
Risk factors via First Street. Map © Google.
Why this score? — see what drove the A grade
The composite is a weighted blend of 9 inputs, each scored 0–100. Each bar is that input's sub-score; the figure is the points it added to the 100-point composite (weight × sub-score).
- Cash flow +30.0/30.0
- ARV discount +15.0/15.0
- 1% rule +10.0/10.0
- DSCR +10.0/10.0
- Appreciation +10.0/10.0
- Schools +4.7/10.0
- Livability +3.1/5.0
- Rent growth +2.5/5.0
- Condition / age +2.5/5.0
$259,999
🖨 Deal sheet (PDF) 📄 Offer letter ✓ Due diligence
Listing remarks
Occupied Foreclosure 3 Bed 1.5 Bath Ranch on 100X100 corner lot. 2 Car Detached garage behind house. Cash or hard money only. DO NOT DISTURB occupants. House will be delivered occupied at time of closing. Contract Vendee. Information In This Listing Is Provided As A Courtesy. Agent And Buyer Should Verify All Information And Not Rely On Contents Herein.
Key facts
- 0.23 acre lot
- Garage
- Built 1975
Neighborhood map
What this means for you Summary
Snapshot
- This is a 3-bed/1.5-bath single-family listed at $260k.
Deal economics
- At list price, monthly cash flow is $707 ($8k/yr) — positive.
- The deal already cash-flows at list — no discount required.
- Meets the 1% rule at list price ($4k rent vs $260k).
- Cap rate 11.7% vs local median 4.7% in Mastic Beach — top-decile yield for the area; either an underpriced asset or a hidden risk that comps aren't pricing in. Stress-test before assuming the spread holds.
Location & tenants
- Location reads 61/100 on livability (#936 in NY) — a middle-class / working-renter tenant base. Strengths: employment A+, housing A+; Watch: crime D, amenities F, commute F.
- William Floyd Union Free School District (suburban): math 48% / reading 57% proficiency, ranked #309 of 590 in NY (top 52%) — acceptable for families but not a draw, mixed tenant base, ~2y average lease.
- Zoned schools: Tangier Smith Elementary School (math 43% / reading 54%, grade D, #1,181 of 2,108 statewide, top 56%, 755 students, 61% FRL); William Paca Middle School (math 31% / reading 37%, grade F, #497 of 729 statewide, top 69%, 1,009 students, 59% FRL); William Floyd High School (math 65% / reading 87%, grade A-, #616 of 1,100 statewide, top 57%, 3,013 students, 54% FRL) — zoned schools average 58% FRL vs 43% district-wide (15 pts higher); higher-poverty schools than district average — tighter screening recommended.
- Market conditions: 133 active listings in the ZIP; 5 comparable units currently listed for rent nearby; rentals leasing fast (median 2d on market — plan ~1-2 weeks tenant-placement turnaround); 1,366 units permitted in Suffolk County in 2024 (216 in 5+ unit buildings).
Forward outlook
- In year one you build about $28k of equity ($2k loan paydown + $26k appreciation (10.0% local appreciation)).
- Suffolk County population projected to shrink 5% by 2050 — rents likely to lag national; underwrite the cash flow, not the appreciation.
- At projected returns (10.0% appreciation + 3.0% rent growth), your $73k cash investment doubles in ~2 years — after that, you're playing with house money.
- By year 2, paydown + projected appreciation supports a ~$45k cash-out refi (75% LTV) — recoverable capital for the next deal without selling this one.
Negotiation context
- Only 5 days on market — expect competitive offers; lowballing is unlikely to land.
- 4 sale attempts with the ask held roughly flat each time — persistent listings suggest the price (not the market) is what's stuck; bring a comps-based counter.
- Current owner paid $186k; 40% above their basis — modest negotiation headroom, anchor on the comps not their cost.
Risks & watch-outs
- Watch-outs: property tax is 2.8% of price; flood insurance adds $460/mo.
- Climate carrying-cost: in FEMA flood zone AE (mandatory federal flood insurance); severe wind risk, 80% chance of damaging wind over 30y — expect insurance premiums to compound above CPI over the hold.
Questions for the listing agent
- Built in 1975 — when were the roof, HVAC, electrical panel, plumbing, and water heater last replaced?
- Property tax is high relative to price — has the assessment been appealed recently, and will the sale trigger a re-assessment?
- What's the actual annual flood-insurance premium (NFIP or private), and is the property in a SFHA with mandatory coverage?
- Is there a deadline driving the sale (1031 exchange, divorce, estate, relocation)? That informs how much negotiation room exists.
- Schools are D-rated, which usually means shorter tenancies and higher turnover. Who's the typical renter profile here, and what's been the actual vacancy rate?
- Crime grade is D in this area — have there been break-ins, vandalism, or insurance claims at this property in the last 3 years? What carrier currently insures it and at what premium?
- What's the average days-on-market for RENTAL listings here right now (not sales)? A rising rental-DOM trend means longer vacancies and softer asking-rent achievability than the comps imply.
- What's the recent tenant-quality profile in this submarket — average credit score on applications, eviction rate, late-payment / NSF rate, and stable-employment percentage? A property-management company in the area should have these aggregated.
- How much new for-sale + rental construction is in the pipeline within 1–3 miles? Heavy new supply typically softens prices + rents 12–24 months out; constrained supply supports both.
Investment metrics
- 1% rule
- 1.58% ✓
- Cap rate
- 11.68%
- Cash-on-cash
- 19.24%
- DSCR
- 1.86
- GRM
- 5.3
CMA / ARV
- ARV (on-the-fly)
- $484,035
- Comps found
- 12
Show comp detail 12 sales within ~0.75 mi
| Address | Dist | Beds/Ba | Sqft | Sold | Price | $/sf | Match |
|---|---|---|---|---|---|---|---|
| 76 Gooseberry Rd | 0.10mi | 3/1.5 | 1,286 (-8%) | 6mo | $400,000 | $311 | 76 |
| 120 Lynbrook Dr | 0.33mi | 3/1.5 | 1,386 (-1%) | 9mo | $450,000 | $325 | 75 |
| 193 Laurelton Dr | 0.36mi | 3/2.0 | 1,349 (-4%) | 5mo | $465,000 | $345 | 71 |
| 99 Lynbrook Dr | 0.22mi | 4/2.5 (+1) | 1,357 (-3%) | 8mo | $375,000 | $276 | 69 |
| 118 Cranberry Dr | 0.38mi | 3/2.0 | 1,350 (-4%) | 8mo | $451,000 | $334 | 68 |
| 2 Lafayette Dr | 0.58mi | 3/1.5 | 1,334 (-5%) | 2mo | $400,000 | $300 | 63 |
| 17 Bellport Rd | 0.24mi | 3/1.0 | 1,224 (-13%) | 4mo | $465,000 | $380 | 62 |
| 184 Bayview Dr | 0.48mi | 3/2.0 | 1,302 (-7%) | 5mo | $280,000 | $215 | 60 |
| 6 Quail Rd | 0.42mi | 3/2.0 | 1,300 (-7%) | 10mo | $452,500 | $348 | 57 |
| 6 Lafayette Dr | 0.56mi | 3/2.0 | 1,500 (+7%) | 5mo | $572,000 | $381 | 56 |
| 27 Pinewood Dr | 0.74mi | 3/1.5 | 1,250 (-11%) | 1mo | $598,000 | $478 | 46 |
| 277 Commack Rd | 0.69mi | 4/1.0 (+1) | 1,200 (-14%) | 5mo | $450,000 | $375 | 32 |
Match score weights: distance 35% · size 25% · config 20% · recency 20%. Top-matched comps best support the ARV.
Projected returns pro-forma
10.0% appreciation · 3.0% rent growth · sell at horizon
- IRR
- 32.9%
- Equity multiple
- 3.57×
- Total profit
- $187,135
- Equity at exit
- $234,228
- IRR
- 28.4%
- Equity multiple
- 8.10×
- Total profit
- $516,701
- Equity at exit
- $505,121
Cash invested: $72,800 (down + closing). Projections, not guarantees.
Landlord ↔ Tenant lean methodology
- Overall (STATE)
- 15 Strongly Tenant-Friendly
- State New York
- 15 Strongly Tenant-Friendly · D+10
- County
- — inherits STATE
- City
- — inherits STATE
ZIP-level market 11951
- Home prices YoY
- 4.3%
- Active inventory
- 133
- Price-to-rent
- 5.3×
Monthly cashflow live
- Estimated rent
- $4,101 high interval (Pro) →
- Mortgage (P&I)
- −$1,363
- Tax from tax record
- −$601 /mo · $7,207/yr
- Insurance
- −$108
- Flood insurance flood zone
- −$460 /mo · $5,525/yr
- HOA
- −$0
- Vacancy / Maint / Mgmt
- −$861
- Net cashflow
- $707
Break-even live
Sensitivity live
| Price | -10% $854 | -5% $780 | +0% $707 | +5% $633 | +10% $560 |
|---|---|---|---|---|---|
| Rent | -10% $383 | -5% $545 | +0% $707 | +5% $869 | +10% $1,031 |
| Rate | -1.0pp $838 | -0.5pp $773 | base $707 | +0.5pp $639 | +1.0pp $571 |
UW: 25.0% down · 7.5% · 30yr · 1.5% tax · 5.0% vac · 8.0% maint · 8.0% mgmt
Financing live
Cash to close
- Down payment
- $65,000
- Closing costs
- $7,800
- Reserves months
- —
- Total cash needed
- —
Loan-product check · same deal, 3 products live
Conventional
25% down · 7.5% · 30yr
- Down + closing
- —
- Monthly P&I
- —
- Monthly cashflow
- —
- DSCR
- —
- Eligible?
- —
Personal DTI + credit; lowest rate.
DSCR
20% down · 8.5% · 30yr
- Down + closing
- —
- Monthly P&I
- —
- Monthly cashflow
- —
- DSCR
- —
- Eligible?
- —
No personal income docs; deal must DSCR.
Hard money
10% down · 12.0% · 12mo
- Down + closing
- —
- Monthly P&I
- —
- Monthly cashflow
- —
- DSCR
- —
- Eligible?
- —
Short-term bridge; refi at stabilization.
Rent comps 5 comps
| Address | Beds | Baths | Sqft | Rent | $/sqft | DOM | Units | Dist |
|---|---|---|---|---|---|---|---|---|
| 165 Lynbrook Dr Mastic Beach, NY | 3.0 | 2.0 | 1520 | $4,000 | $2.63 | 1d | 1 | 0.56mi |
| 6 Fairview Dr Shirley, NY | 4.0 | 2.0 | 1302 | $4,299 | $3.30 | 3d | 1 | 0.62mi |
| 126 Flower Rd Shirley, NY | 4.0 | 1.0 | 1756 | $4,100 | $2.33 | 1d | 1 | 0.96mi |
| 44 Pine Tree Dr Shirley, NY | 4.0 | 2.0 | 1600 | $4,200 | $2.62 | 1d | 1 | 1.13mi |
| 192 Cypress Dr Mastic Beach, NY | 4.0 | 2.0 | 1404 | $3,800 | $2.71 | 44d | 1 | 1.46mi |
Listing history 10 events
-
2025-11-29status Pending
-
2025-11-24$259,999 Active
-
2025-11-24historical
-
2025-11-17$259,999 Active
-
2025-11-17historical
-
2025-11-11$269,999 Active
-
2025-11-11historical
-
2025-11-06$279,999 Active
-
2003-12-09soldstatus $185,500
-
1997-08-07soldstatus $68,000
ⓘ Source: listings_history table (triggers on properties + properties_extension) + one-shot
backfill from property_details.listing_events for pre-trigger history.
Tax reassessment forecast NY · Partial reset (capped growth)
- Current annual tax
- $7,207 · $601/mo
- Projected year-2 tax
- $7,207 · $601/mo
- Expected delta
- $0/yr ($0/mo · 0.0%)
ⓘ Screening estimate from a state-policy table — verify with the county assessor before closing.
Climate risk First Street
- Flood 7/10 Severe FEMA zone AE · 96% chance over 30 yrs
- Wildfire 1/10 Low
- Heat 4/10 Moderate 7 d/yr ≥92°F today · 20 d/yr by 30 yrs out
- Wind 8/10 Severe 80% chance of damaging wind over 30 yrs
- Air quality 4/10 Moderate 3 unhealthy d/yr today · 5 by 30 yrs out
Nearby sold comps map
Loading sold comps map…
Walkable amenities ~0.75 mi
Loading nearby amenities…
Taxation est. · year 1
- Rental income
- $49,209
- − Mortgage interest
- −$14,564
- − Property taxes
- −$7,207
- − Insurance
- −$6,825
- − Repairs & maintenance
- −$3,937
- − Management
- −$3,937
- − Depreciation
- −$7,564
- Taxable income
- $5,176
- Est. tax owed @ 24.0%
- −$1,242
- After-tax cash flow
- $7,240/yr
For passive investors: Depreciation is non-cash, so a rental often shows a tax loss while cash-flowing — sheltering income. Rental losses are passive: they offset passive income freely, and up to $25,000/yr can offset ordinary (W-2) income if you actively participate and your MAGI is under $100k (phasing out to $0 by $150k); unused losses carry forward. On sale, claimed depreciation is recaptured at up to 25%, and gains may owe capital-gains tax (a 1031 exchange can defer both). Figures are a year-1 estimate at your 24.0% rate — not tax advice; consult a CPA.
Schools (NCES district)
- District
- William Floyd Union Free School District
- NCES district ID
- 3618690
- Math proficiency
- 48% ▲ 3.00%
- Reading proficiency
- 57% ▲ 11.00%
- Median HH income
- $70,564
- Composite
- 46.79/100
- National rank
- #2383
- State rank
- #309 of 590 in NY
Livability — Mastic Beach
- Score
- 61/100
- State rank
- #936
- US rank
- #18216
Category grades
Schools grade is shown separately in the Schools card above.
Census & demographics
- Census place
- Mastic Beach, NY
- City population
- 15,830
- Population (ZIP)
- 15,830
Population outlook (Suffolk County) Hauer SSP2
- Today (2025)
- 1,505,262 people
- By 2030
- 1,498,318 · -0.5%
- By 2040
- 1,471,101 · -2.3%
- By 2050
- 1,424,848 · -5.3%
- By 2075
- 1,337,157 · -11.2%
- By 2100
- 1,217,720 · -19.1%
Race, ethnicity, and origin ACS 2023
- Neighborhood character
- Predominantly White (68%)
- Race & ethnicity
- White 68% Hispanic / Latino 17% Two or more races 9% Black 6% Asian 2%
- Hispanic origin (detail)
- Mexican 1% Puerto Rican 6% Cuban 2%
- Common ancestry
- Lithuanian 3% Romanian 2% Italian 2%
- Foreign-born
- 7% · Canada, Vietnam
- Languages at home
- 84% English-only · Spanish 10% Other Indo-European 3% Chinese 1%
Political lean MEDSL · Suffolk
- 2024 margin
- Lean R (+10.0) · D 45.0% · R 55.0%
- 2008→2024 swing
- -16.0pp toward R · 2008: 6.0pp · 2024: -10.0pp
- All cycles
- 2024: R+10.0 2020: R+0.0 2016: R+8.2 2012: D+2.9 2008: D+6.0
Not yet ingested
- Civics
- —
Market trends
- HPI YoY
- ▲ 34.46%
- Current HPI
- 829.86
- Rent YoY
- —
- Metro
- —
- State GDP YoY
- ▲ 2.60%
- F500 in state
- 92
Industry mix (Fortune 500 HQ in NY)
| Industry | F500 HQs | Revenue |
|---|---|---|
| Financial Services | 10 | $950B |
|
||
| Consumer Goods | 9 | $162B |
|
||
| Insurance | 4 | $225B |
|
||
| Telecommunications | 2 | $144B |
|
||
| Pharmaceuticals | 2 | $112B |
|
||
| Media / Entertainment | 2 | $69B |
|
||
Price history
+282.4% since first listed10 events — show timeline
- 2025-11-29 Pending — OneKey® MLS as Distributed by MLS Grid
- 2025-11-24 Listing Removed — OneKey® MLS as Distributed by MLS Grid
- 2025-11-24 Listed $259,999 OneKey® MLS as Distributed by MLS Grid
- 2025-11-17 Listing Removed — OneKey® MLS as Distributed by MLS Grid
- 2025-11-17 Listed $259,999 OneKey® MLS as Distributed by MLS Grid
- 2025-11-11 Listing Removed — OneKey® MLS as Distributed by MLS Grid
- 2025-11-11 Listed $269,999 OneKey® MLS as Distributed by MLS Grid
- 2025-11-06 Listed $279,999 OneKey® MLS as Distributed by MLS Grid
- 2003-12-09 Sold (Public Records) $185,500 Public Records
- 1997-08-07 Sold (Public Records) $68,000 Public Records
Property tax history
+3.2%/yrLatest (2025): $7,207 · +0.0% YoY. Source: county tax records.
Cash-flow waterfall
monthlySold comps — $/sqft
last 12 mo · ≤1 miLoading sold comps…