 Multi-family
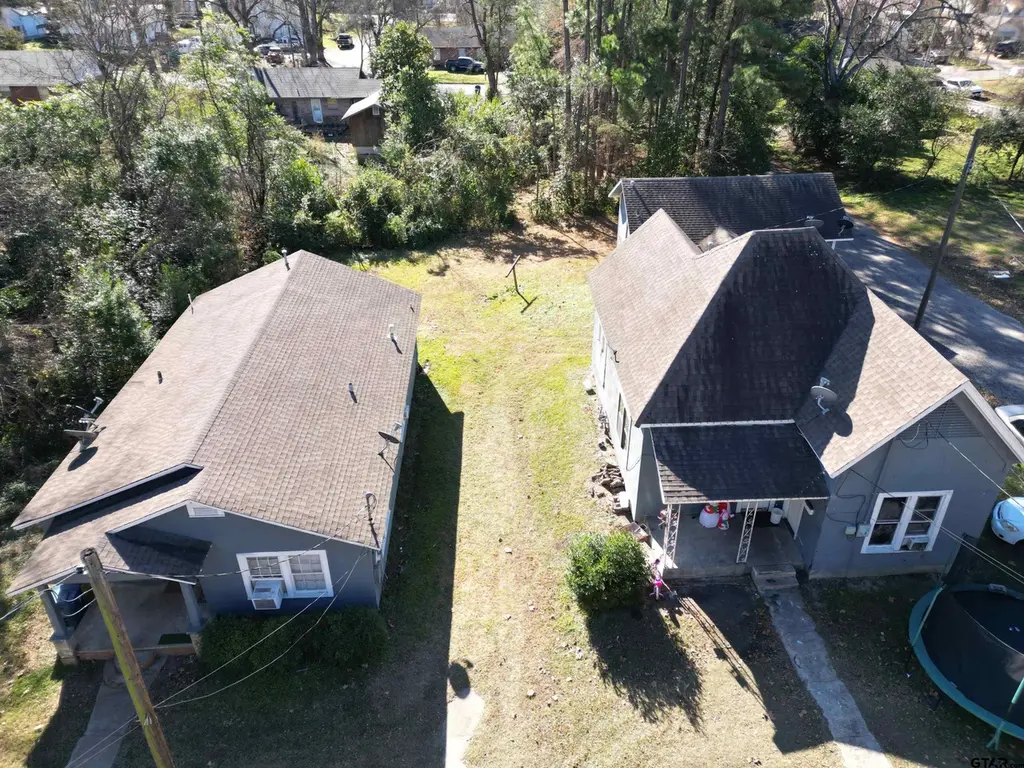
513 W 6th St · Mount Pleasant, TX
Flood risk 4/10 · Minor
- FEMA flood zone
- X (unshaded)
- Chance of flooding over 30 yrs
- 0.24%
- Est. flood insurance / yr
- $507 – $1,088
Fire risk 5/10 · Moderate
- Est. fire insurance / yr
- $1,222 – $2,270
Heat risk 7/10 · Major
- Hot days now (above 113°F)
- 7 days/yr
- Hot days in 30 yrs
- 23 days/yr
Wind risk 6/10 · Moderate
- Chance of severe wind over 30 yrs
- 27.0%
Air-quality risk 2/10 · Minimal
- Unhealthy air days now
- 1 days/yr
- Unhealthy air days in 30 yrs
- 1 days/yr
Risk factors via First Street. Map © Google.
Why this score? — see what drove the B grade
The composite is a weighted blend of 9 inputs, each scored 0–100. Each bar is that input's sub-score; the figure is the points it added to the 100-point composite (weight × sub-score).
- Cash flow +30.0/30.0
- 1% rule +10.0/10.0
- DSCR +10.0/10.0
- ARV discount +7.5/15.0
- Livability +3.9/5.0
- Schools +3.7/10.0
- Rent growth +2.5/5.0
- Condition / age +2.5/5.0
- Appreciation +0.0/10.0
$219,000
🖨 Deal sheet (PDF) 📄 Offer letter ✓ Due diligence
Multi-family units
County records classify this as Multi-Family (2-4 Unit). Listing-text estimate: 1 unit. estimate disagrees with records
Listing remarks MLS
Great investment opportunity with this 4-unit income-producing property. Layout includes two 1-bed/1-bath units within one structure, plus a separate 2-bed/1-bath unit and an additional 1-bed/1-bath unit. Tenants are month-to-month and interested in staying, allowing for immediate rental income with future upside. Property offers potential for updates to increase rents and overall value.
Key facts
- 0.36 acre lot
- Built 1956
- Listed 167 days
Neighborhood map
What this means for you Summary
Snapshot
- This is a 1-bed/1.0-bath multifamily listed at $219k.
Deal economics
- At list price, monthly cash flow is $2k ($20k/yr) — positive.
- The deal already cash-flows at list — no discount required.
- Meets the 1% rule at list price ($4k rent vs $219k).
- Recommended offer: $193k (12.0% below list) — sets the bar for market timing.
- Cap rate 15.4% vs local median 3.4% in Mount Pleasant — top-decile yield for the area; either an underpriced asset or a hidden risk that comps aren't pricing in. Stress-test before assuming the spread holds.
Location & tenants
- Location reads 77/100 on livability (#81 in TX, #2,808 nationally) — a middle-class / working-renter tenant base. Strengths: cost of living A+, housing A+, health & safety A+; Watch: employment C-, amenities D-, commute F.
- Mount Pleasant ISD (town): math 45% / reading 44% proficiency, ranked #291 of 826 in TX (top 35%) — families likely to look elsewhere, expect single-tenant / working-renter base with shorter leases; 74% free/reduced lunch — lower-income household profile, screen leases tightly.
- Zoned schools: Child Development Center (452 students, 91% FRL); Mount Pleasant J H (math 40% / reading 45%, grade D-, #553 of 1,662 statewide, top 34%, 760 students, 81% FRL); Mount Pleasant H S (math 68% / reading 54%, grade C+, #258 of 1,632 statewide, top 16%, 1,521 students, 79% FRL).
- Market conditions: 382 active listings in the ZIP; 47 units permitted in Titus County in 2024 (10 in 5+ unit buildings).
- At $4,259/mo this rent would consume 91% of the median local household income ($56k/yr) (locally 758% of renters already pay >50% of income on rent) — very limited rent-growth headroom before tenants either downsize or default.
Forward outlook
- Local home prices are declining (-3.0%/yr); year-one equity from $2k of loan paydown is wiped out by about $7k of value loss. Plan a longer hold.
- At projected returns (-3.0% appreciation + 3.0% rent growth), your $61k cash investment doubles in ~4 years — after that, you're playing with house money.
Negotiation context
- It's been on market 168 days — a 12% lower offer ($193k) is reasonable based on typical stale-listing flexibility.
- 2 sale attempts since 3y ago; this cycle's ask has dropped $16k (7%) from the opening price — seller is motivated, your offer sets the floor, not the list.
Risks & watch-outs
- Watch-outs: property tax is 2.6% of price; built in 1956 — expect roof / HVAC / electrical / plumbing capex.
- Climate carrying-cost: major wind risk, 27% chance of damaging wind over 30y; moderate wildfire risk; extreme-heat days projected 7→23/yr by 2055 (HVAC capex compounding) — expect insurance premiums to compound above CPI over the hold.
Questions for the listing agent
- It's been on market 168 days. Have you received any prior offers? Is the seller open to a 12% concession, seller financing, or rate buy-down credit?
- Built in 1956 — when were the roof, HVAC, electrical panel, plumbing, and water heater last replaced?
- Property tax is high relative to price — has the assessment been appealed recently, and will the sale trigger a re-assessment?
- Why hasn't it sold? Are there any deal-killer items the seller is aware of (foundation, flood, title, zoning, code violations)?
- Is there a deadline driving the sale (1031 exchange, divorce, estate, relocation)? That informs how much negotiation room exists.
- Schools are D-rated, which usually means shorter tenancies and higher turnover. Who's the typical renter profile here, and what's been the actual vacancy rate?
- What's the average days-on-market for RENTAL listings here right now (not sales)? A rising rental-DOM trend means longer vacancies and softer asking-rent achievability than the comps imply.
- What's the recent tenant-quality profile in this submarket — average credit score on applications, eviction rate, late-payment / NSF rate, and stable-employment percentage? A property-management company in the area should have these aggregated.
- How much new apartment / multifamily construction is in the pipeline within 1–3 miles? Heavy new supply (>2% of stock underway) typically softens rents 12–24 months out; light construction supports rent growth.
Investment metrics
- 1% rule
- 1.94% ✓
- Cap rate
- 15.38%
- Cash-on-cash
- 32.46%
- DSCR
- 2.44
- GRM
- 4.3
CMA / ARV
No comps found within radius.
Projected returns pro-forma
-3.0% appreciation · 3.0% rent growth · sell at horizon
- IRR
- 27.6%
- Equity multiple
- 2.15×
- Total profit
- $70,351
- Equity at exit
- $32,654
- IRR
- 35.1%
- Equity multiple
- 4.23×
- Total profit
- $198,051
- Equity at exit
- $18,935
Cash invested: $61,320 (down + closing). Projections, not guarantees.
Landlord ↔ Tenant lean methodology
- Overall (STATE)
- 87 Strongly Landlord-Friendly
- State Texas
- 87 Strongly Landlord-Friendly · R+5
- County
- — inherits STATE
- City
- — inherits STATE
ZIP-level market 75455
- Home prices YoY
- -27.0%
- Active inventory
- 382
- Price-to-rent
- 18.1×
Monthly cashflow live
- Estimated rent
- $4,259 medium interval (Pro) →
- Mortgage (P&I)
- −$1,148
- Tax from tax record
- −$466 /mo · $5,592/yr
- Insurance
- −$91
- HOA
- −$0
- Vacancy / Maint / Mgmt
- −$894
- Net cashflow
- $1,659
Break-even live
Sensitivity live
| Price | -10% $1,783 | -5% $1,721 | +0% $1,659 | +5% $1,597 | +10% $1,535 |
|---|---|---|---|---|---|
| Rent | -10% $1,322 | -5% $1,491 | +0% $1,659 | +5% $1,827 | +10% $1,995 |
| Rate | -1.0pp $1,769 | -0.5pp $1,715 | base $1,659 | +0.5pp $1,602 | +1.0pp $1,544 |
4-unit breakdown (identical units grouped — click to expand)
| Units | Beds | Baths | Est. rent |
|---|---|---|---|
| 3× units | 1 | 1 | $3,027 |
| #1 | 1 | 1 | $1,009 |
| #2 | 1 | 1 | $1,009 |
| #3 | 1 | 1 | $1,009 |
| 1× unit | 2 | 1 | $1,232 |
| Total (4 units) | $4,259 | ||
UW: 25.0% down · 7.5% · 30yr · 1.5% tax · 5.0% vac · 8.0% maint · 8.0% mgmt
Financing live
Cash to close
- Down payment
- $54,750
- Closing costs
- $6,570
- Reserves months
- —
- Total cash needed
- —
Loan-product check · same deal, 3 products live
Conventional
25% down · 7.5% · 30yr
- Down + closing
- —
- Monthly P&I
- —
- Monthly cashflow
- —
- DSCR
- —
- Eligible?
- —
Personal DTI + credit; lowest rate.
DSCR
20% down · 8.5% · 30yr
- Down + closing
- —
- Monthly P&I
- —
- Monthly cashflow
- —
- DSCR
- —
- Eligible?
- —
No personal income docs; deal must DSCR.
Hard money
10% down · 12.0% · 12mo
- Down + closing
- —
- Monthly P&I
- —
- Monthly cashflow
- —
- DSCR
- —
- Eligible?
- —
Short-term bridge; refi at stabilization.
Listing history 23 events
-
2026-06-19days on market $219,000 Active 168 DOM
-
2026-06-18days on market $219,000 Active 167 DOM
-
2026-06-17days on market $219,000 Active 166 DOM
-
2026-06-16days on market $219,000 Active 165 DOM
-
2026-06-15days on market $219,000 Active 164 DOM
-
2026-06-14days on market $219,000 Active 162 DOM
-
2026-06-12days on market $219,000 Active 161 DOM
-
2026-06-09days on market $219,000 Active 158 DOM
-
2026-06-08days on market $219,000 Active 157 DOM
-
2026-06-07days on market $219,000 Active 156 DOM
-
2026-06-07days on market $219,000 Active 155 DOM
-
2026-06-03days on market $219,000 Active 152 DOM
-
2026-06-02days on market $219,000 Active 151 DOM
-
2026-06-01days on market $219,000 Active 150 DOM
-
2026-05-31days on market $219,000 Active 149 DOM
-
2026-05-30days on market $219,000 Active 148 DOM
-
2026-03-18price $219,000 390-char remark
Show marketing remark (390 chars)
Great investment opportunity with this 4-unit income-producing property. Layout includes two 1-bed/1-bath units within one structure, plus a separate 2-bed/1-bath unit and an additional 1-bed/1-bath unit. Tenants are month-to-month and interested in staying, allowing for immediate rental income with future upside. Property offers potential for updates to increase rents and overall value.
-
2026-01-02$235,000 Active 390-char remark
Show marketing remark (390 chars)
Great investment opportunity with this 4-unit income-producing property. Layout includes two 1-bed/1-bath units within one structure, plus a separate 2-bed/1-bath unit and an additional 1-bed/1-bath unit. Tenants are month-to-month and interested in staying, allowing for immediate rental income with future upside. Property offers potential for updates to increase rents and overall value.
-
2023-09-18soldstatus
-
2023-09-15soldstatus Closed 726-char remark
Show marketing remark (726 chars)
* * 4 income producing rentals in the heart of Mt. Pleasant, TX. * * 1 unit is a duplex. Live in one and rent the others! All units have 1 bedroom, 1 full bathroom, a living area and a kitchen with a dine in area except for 519 which has 2 bedrooms! Each unit has a tenant! All want to stay. Would you like to have an income producing property that pays right away? If so, there is no need to look any further. Schedule a tour today. Owner will need a 24-hour notice as a courtesy to his tenants for showing requests. Apartments are located in Caldwell subdivision in Titus County. 519 - approximately 600 sqft and has 1 unit 517 - approximately 1,232 sqft and has 1 unit 513 & 515 - approximately 952 sqft, 2 units.
-
2023-08-23historical 726-char remark
Show marketing remark (726 chars)
* * 4 income producing rentals in the heart of Mt. Pleasant, TX. * * 1 unit is a duplex. Live in one and rent the others! All units have 1 bedroom, 1 full bathroom, a living area and a kitchen with a dine in area except for 519 which has 2 bedrooms! Each unit has a tenant! All want to stay. Would you like to have an income producing property that pays right away? If so, there is no need to look any further. Schedule a tour today. Owner will need a 24-hour notice as a courtesy to his tenants for showing requests. Apartments are located in Caldwell subdivision in Titus County. 519 - approximately 600 sqft and has 1 unit 517 - approximately 1,232 sqft and has 1 unit 513 & 515 - approximately 952 sqft, 2 units.
-
2023-07-19$210,000 Active 726-char remark
Show marketing remark (726 chars)
* * 4 income producing rentals in the heart of Mt. Pleasant, TX. * * 1 unit is a duplex. Live in one and rent the others! All units have 1 bedroom, 1 full bathroom, a living area and a kitchen with a dine in area except for 519 which has 2 bedrooms! Each unit has a tenant! All want to stay. Would you like to have an income producing property that pays right away? If so, there is no need to look any further. Schedule a tour today. Owner will need a 24-hour notice as a courtesy to his tenants for showing requests. Apartments are located in Caldwell subdivision in Titus County. 519 - approximately 600 sqft and has 1 unit 517 - approximately 1,232 sqft and has 1 unit 513 & 515 - approximately 952 sqft, 2 units.
-
2001-04-03soldstatus
ⓘ Source: listings_history table (triggers on properties + properties_extension) + one-shot
backfill from property_details.listing_events for pre-trigger history.
Tax reassessment forecast TX · Resets to sale price
- Current annual tax
- $5,592 · $466/mo
- Projected year-2 tax
- $5,592 · $466/mo
- Expected delta
- $0/yr ($0/mo · 0.0%)
ⓘ Screening estimate from a state-policy table — verify with the county assessor before closing.
Climate risk First Street
- Flood 4/10 Moderate FEMA zone X (unshaded) · 24% chance over 30 yrs
- Wildfire 5/10 Major
- Heat 7/10 Severe 7 d/yr ≥113°F today · 23 d/yr by 30 yrs out
- Wind 6/10 Major 27% chance of damaging wind over 30 yrs
- Air quality 2/10 Low 1 unhealthy d/yr today · 1 by 30 yrs out
Nearby sold comps map
Loading sold comps map…
Walkable amenities ~0.75 mi
Loading nearby amenities…
Taxation est. · year 1
- Rental income
- $51,108
- − Mortgage interest
- −$12,267
- − Property taxes
- −$5,592
- − Insurance
- −$1,095
- − Repairs & maintenance
- −$4,089
- − Management
- −$4,089
- − Depreciation
- −$6,371
- Taxable income
- $17,605
- Est. tax owed @ 24.0%
- −$4,225
- After-tax cash flow
- $15,681/yr
For passive investors: Depreciation is non-cash, so a rental often shows a tax loss while cash-flowing — sheltering income. Rental losses are passive: they offset passive income freely, and up to $25,000/yr can offset ordinary (W-2) income if you actively participate and your MAGI is under $100k (phasing out to $0 by $150k); unused losses carry forward. On sale, claimed depreciation is recaptured at up to 25%, and gains may owe capital-gains tax (a 1031 exchange can defer both). Figures are a year-1 estimate at your 24.0% rate — not tax advice; consult a CPA.
Schools (NCES district)
- District
- Mount Pleasant ISD
- NCES district ID
- 4831760
- Math proficiency
- 45% ▼ -7.00%
- Reading proficiency
- 44% ▲ 2.00%
- Median HH income
- $40,642
- Composite
- 37.35/100
- National rank
- #4437
- State rank
- #291 of 826 in TX
Livability — Mount Pleasant
- Score
- 77/100
- State rank
- #81
- US rank
- #2808
Category grades
Schools grade is shown separately in the Schools card above.
Census & demographics
- Census place
- Mount Pleasant, TX
- County
- Titus County · 26,903 people
- City population
- 26,903
- Metro
- Mount Pleasant, TX
- Population (ZIP)
- 26,903
- Household income
- $56,163
- Rent vs Own
- Severe rent burden
- 758.0
Population outlook (Titus County) Hauer SSP2
- Today (2025)
- 33,205 people
- By 2030
- 33,187 · -0.1%
- By 2040
- 32,931 · -0.8%
- By 2050
- 32,231 · -2.9%
- By 2075
- 29,507 · -11.1%
- By 2100
- 25,369 · -23.6%
Race, ethnicity, and origin ACS 2023
- Neighborhood character
- Diverse neighborhood (Simpson 0.61)
- Race & ethnicity
- Hispanic / Latino 45% White 42% Two or more races 15% Black 10% Asian 1%
- Hispanic origin (detail)
- Mexican 42%
- Common ancestry
- Lithuanian 1% Slovak 1% Italian 1%
- Foreign-born
- 18% · Canada, Vietnam
- Languages at home
- 61% English-only · Spanish 37% Vietnamese 1%
Political lean MEDSL · Titus
- 2024 margin
- Solid R (+54.7) · D 22.3% · R 77.0%
- 2008→2024 swing
- -23.5pp toward R · 2008: -31.2pp · 2024: -54.7pp
- All cycles
- 2024: R+54.7 2020: R+44.7 2016: R+42.1 2012: R+39.0 2008: R+31.2
Not yet ingested
- Civics
- —
Market trends
- HPI YoY
- ▼ -79.66%
- Current HPI
- 215.4205
- Rent YoY
- —
- Metro
- Mount Pleasant, TX
- State GDP YoY
- ▲ 3.95%
- F500 in state
- 110
Industry mix (Fortune 500 HQ in TX)
| Industry | F500 HQs | Revenue |
|---|---|---|
| Energy | 16 | $1,198B |
|
||
| Technology | 5 | $198B |
|
||
| Engineering / Construction | 4 | $72B |
|
||
| Energy Services | 3 | $60B |
|
||
| Utilities | 3 | $41B |
|
||
| Healthcare | 2 | $330B |
|
||
Price history
+4.3% since first listed7 events — show timeline
- 2026-03-18 Price Changed $219,000 GTAR
- 2026-01-02 Listed $235,000 GTAR
- 2023-09-18 Sold (Public Records) — Public Records
- 2023-09-15 Sold (MLS) — GTAR
- 2023-08-23 Delisted — GTAR
- 2023-07-19 Listed $210,000 GTAR
- 2001-04-03 Sold (Public Records) — Public Records
Property tax history
+10.3%/yrLatest (2025): $5,592 · +9.9% YoY. Source: county tax records.
Cash-flow waterfall
monthlySold comps — $/sqft
last 12 mo · ≤1 miLoading sold comps…