13859 Northwood Dr NW · Andover, MN
Flood risk 1/10 · Minimal
- FEMA flood zone
- X (unshaded)
- Chance of flooding over 30 yrs
- 0.0%
- Est. flood insurance / yr
- $473 – $860
Fire risk 2/10 · Minimal
- Est. fire insurance / yr
- $888 – $1,650
Heat risk 2/10 · Minimal
- Hot days now (above 99°F)
- 7 days/yr
- Hot days in 30 yrs
- 14 days/yr
Wind risk 2/10 · Minimal
- Chance of severe wind over 30 yrs
- —
Air-quality risk 2/10 · Minimal
- Unhealthy air days now
- 2 days/yr
- Unhealthy air days in 30 yrs
- 2 days/yr
Risk factors via First Street. Map © Google.
Why this score? — see what drove the D grade
The composite is a weighted blend of 9 inputs, each scored 0–100. Each bar is that input's sub-score; the figure is the points it added to the 100-point composite (weight × sub-score).
- ARV discount +15.0/15.0
- Cash flow +10.2/30.0
- Schools +4.7/10.0
- Livability +3.6/5.0
- DSCR +2.9/10.0
- 1% rule +2.5/10.0
- Rent growth +2.5/5.0
- Condition / age +2.5/5.0
- Appreciation +0.0/10.0
$314,900
🖨 Deal sheet (PDF) 📄 Offer letter ✓ Due diligence
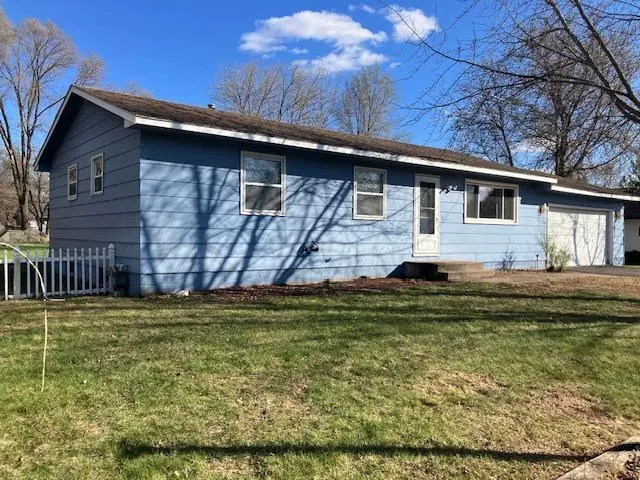
Listing remarks
This is a one level home and priced right. Lots of potential here. 3 bedrooms on main level with possiblilty of another down when you add an egress window. Newer kitchen cabinets and countertops. Ceramic Tile bath on main and a 3/4 bath in lower level. New flooring in Family Room. Awesome opportunity to build some equity.
Key facts
- 0.5 acre lot
- 2 garage spots
- Built 1972
Property features AI
Finance
- Financial info: Conventional mortgage type
Exterior
- Parking: Attached garage with 2 spaces; Garage door opener; Asphalt driveway; Garage approximately 22x20 with 8' high by 16' wide door
- Utilities: Private drilled well (4-inch submersible); City sewer (connected); 100 amp electric service; Powered by natural gas; Electric service by Connexus Energy
- Home design: Residential property; One level (with lower/finished basement); Main entry on main level
- Construction: Concrete and frame construction; Asphalt roof; Block foundation; Built with a full basement
- Exterior features: Patio; Chain link full fencing; Light tree coverage
Interior
- Kitchen: Dishwasher; Range; Microwave; Refrigerator; Water osmosis system; Kitchen with eat-in/ informal dining area
- Bedrooms: 3 bedrooms (most on main level); Den on lower level
- Flooring: Tile floors
- Bathrooms: Main floor full bathroom; Lower level 3/4 bathroom
- Heating & cooling: Forced air heating; Central air conditioning
- Interior features: Ceiling fan(s); Kitchen window; Patio; Tile floors; Washer/dryer hookup; Partially finished basement; Full basement with block foundation
- Laundry & utility: Washer/dryer hookup; Dryer; Gas water heater
Neighborhood map
What this means for you Summary
Snapshot
- This is a 3-bed/2.0-bath single-family listed at $315k.
Deal economics
- At list price, monthly cash flow is $-177 ($-2k/yr) — negative.
- To cash-flow at today's rent, offer at most $284k (9.9% below list).
- To meet the 1% rule (rent ≥ 1% of price), the offer needs to be $236k (25.2% below list).
- Recommended offer: $236k (25.2% below list) — sets the bar for 1% rule.
- Cap rate 5.6% vs local median 3.6% in Andover — top-decile yield for the area; either an underpriced asset or a hidden risk that comps aren't pricing in. Stress-test before assuming the spread holds.
Location & tenants
- Location reads 72/100 on livability (#291 in MN) — a middle-class / working-renter tenant base. Strengths: employment A+, housing A+, crime A; Watch: amenities F, commute F, cost of living D-.
- Anoka-Hennepin Public School District (suburban): math 49% / reading 55% proficiency, ranked #71 of 301 in MN (top 24%) — acceptable for families but not a draw, mixed tenant base, ~2y average lease.
- Zoned schools: Crooked Lake Elementary (math 64% / reading 52%, grade C+, #258 of 857 statewide, top 30%, 454 students, 34% FRL); Oak View Middle (math 57% / reading 60%, grade B, #29 of 258 statewide, top 12%, 1,268 students, 22% FRL); Andover High School (math 57% / reading 71%, grade B-, #32 of 471 statewide, top 7%, 1,758 students, 19% FRL) — zoned schools at 25% FRL track the district average.
- Market conditions: 395 active listings in the ZIP; 3 comparable units currently listed for rent nearby; rentals at typical pace (median 20d on market — plan ~3-4 weeks tenant-placement turnaround); 1,083 units permitted in Anoka County in 2024 (134 in 5+ unit buildings).
Forward outlook
- Local home prices are declining (-3.0%/yr); year-one equity from $2k of loan paydown is wiped out by about $9k of value loss. Plan a longer hold.
- Anoka County population projected at +11% by 2050 — modest demand growth; plan on rents tracking national, not racing it.
Negotiation context
- Only 9 days on market — expect competitive offers; lowballing is unlikely to land.
- 2 sale attempts since 34y ago with the ask held roughly flat each time — persistent listings suggest the price (not the market) is what's stuck; bring a comps-based counter.
Questions for the listing agent
- What do current leases actually rent for vs. the listed asking? Can we see a recent rent roll and the last 12 months of T-12 income?
- Built in 1972 — when were the roof, HVAC, electrical panel, plumbing, and water heater last replaced?
- Is there a deadline driving the sale (1031 exchange, divorce, estate, relocation)? That informs how much negotiation room exists.
- Schools are A-rated — typically a magnet for longer-tenancy family renters. What's the average tenant stay here, and is there a school-zone premium baked into asking?
- The area grade is low — what's the realistic commute time and amenity access for the typical tenant pool here? Any planned neighborhood developments (good or bad) we should know about?
- What's the average days-on-market for RENTAL listings here right now (not sales)? A rising rental-DOM trend means longer vacancies and softer asking-rent achievability than the comps imply.
- What's the recent tenant-quality profile in this submarket — average credit score on applications, eviction rate, late-payment / NSF rate, and stable-employment percentage? A property-management company in the area should have these aggregated.
- How much new for-sale + rental construction is in the pipeline within 1–3 miles? Heavy new supply typically softens prices + rents 12–24 months out; constrained supply supports both.
Investment metrics
- 1% rule
- 0.75% ✗
- Cap rate
- 5.62%
- Cash-on-cash
- -2.41%
- DSCR
- 0.89
- GRM
- 11.1
CMA / ARV
- ARV (median comp)
- $386,693
- List price
- $314,900
- Delta
- -18.57%
- Verdict
- UNDERPRICED
- Comps
- 4 within 2.0 mi
Projected returns pro-forma
-3.0% appreciation · 3.0% rent growth · sell at horizon
- IRR
- -20.3%
- Equity multiple
- 0.29×
- Total profit
- $-62,362
- Equity at exit
- $46,953
- IRR
- -13.5%
- Equity multiple
- 0.22×
- Total profit
- $-69,036
- Equity at exit
- $27,227
Cash invested: $88,172 (down + closing). Projections, not guarantees.
Landlord ↔ Tenant lean methodology
- Overall (STATE)
- 46 Balanced
- State Minnesota
- 46 Balanced · D+2
- County
- — inherits STATE
- City
- — inherits STATE
ZIP-level market 55304
- Active inventory
- 395
- Price-to-rent
- 11.1×
Monthly cashflow live
- Estimated rent
- $2,355 medium interval (Pro) →
- Mortgage (P&I)
- −$1,651
- Tax from tax record
- −$255 /mo · $3,065/yr
- Insurance
- −$131
- HOA
- −$0
- Vacancy / Maint / Mgmt
- −$495
- Net cashflow
- $-177
Break-even live
Sensitivity live
| Price | -10% $1 | -5% $-88 | +0% $-177 | +5% $-266 | +10% $-355 |
|---|---|---|---|---|---|
| Rent | -10% $-363 | -5% $-270 | +0% $-177 | +5% $-84 | +10% $9 |
| Rate | -1.0pp $-19 | -0.5pp $-97 | base $-177 | +0.5pp $-259 | +1.0pp $-342 |
UW: 25.0% down · 7.5% · 30yr · 1.5% tax · 5.0% vac · 8.0% maint · 8.0% mgmt
Financing live
Cash to close
- Down payment
- $78,725
- Closing costs
- $9,447
- Reserves months
- —
- Total cash needed
- —
Loan-product check · same deal, 3 products live
Conventional
25% down · 7.5% · 30yr
- Down + closing
- —
- Monthly P&I
- —
- Monthly cashflow
- —
- DSCR
- —
- Eligible?
- —
Personal DTI + credit; lowest rate.
DSCR
20% down · 8.5% · 30yr
- Down + closing
- —
- Monthly P&I
- —
- Monthly cashflow
- —
- DSCR
- —
- Eligible?
- —
No personal income docs; deal must DSCR.
Hard money
10% down · 12.0% · 12mo
- Down + closing
- —
- Monthly P&I
- —
- Monthly cashflow
- —
- DSCR
- —
- Eligible?
- —
Short-term bridge; refi at stabilization.
Rent comps 3 comps
| Address | Beds | Baths | Sqft | Rent | $/sqft | DOM | Units | Dist |
|---|---|---|---|---|---|---|---|---|
| 14220 Crosstown Blvd NW Andover, MN | 3.0 | 1.5 | 1347 | $2,224 | $1.65 | 7d | 1 | 0.60mi |
| 2118 140th Ln NW Andover, MN | 3.0 | 2.0 | 1500 | $2,400 | $1.60 | 26d | 1 | 0.68mi |
| 13752 Round Lake Blvd NW Unit 1 Andover, MN | 3.0 | 1.0 | 1146 | $2,525 | $2.20 | 20d | 1 | 1.23mi |
Listing history 6 events
-
2026-05-08status Pending 323-char remark
-
2026-05-04historical Contingent - Inspection 323-char remark
-
2026-04-30$314,900 Active 323-char remark
-
2026-04-20historical $314,900 323-char remark
-
1992-03-16soldstatus $79,900
-
1992-02-18$79,900
ⓘ Source: listings_history table (triggers on properties + properties_extension) + one-shot
backfill from property_details.listing_events for pre-trigger history.
Tax reassessment forecast MN · Partial reset (capped growth)
- Current annual tax
- $3,065 · $255/mo
- Projected year-2 tax
- $3,296 · $275/mo
- Expected delta
- +$231/yr (+$19/mo · 7.5%)
ⓘ Screening estimate from a state-policy table — verify with the county assessor before closing.
Climate risk First Street
- Flood 1/10 Low FEMA zone X (unshaded) · 0% chance over 30 yrs
- Wildfire 2/10 Low
- Heat 2/10 Low 7 d/yr ≥99°F today · 14 d/yr by 30 yrs out
- Wind 2/10 Low
- Air quality 2/10 Low 2 unhealthy d/yr today · 2 by 30 yrs out
Nearby sold comps map
Loading sold comps map…
Walkable amenities ~0.75 mi
Loading nearby amenities…
Taxation est. · year 1
- Rental income
- $28,266
- − Mortgage interest
- −$17,639
- − Property taxes
- −$3,065
- − Insurance
- −$1,574
- − Repairs & maintenance
- −$2,261
- − Management
- −$2,261
- − Depreciation
- −$9,161
- Taxable loss
- −$7,697
- Est. tax savings @ 24.0%
- +$1,847
- After-tax cash flow
- $-279/yr
For passive investors: Depreciation is non-cash, so a rental often shows a tax loss while cash-flowing — sheltering income. Rental losses are passive: they offset passive income freely, and up to $25,000/yr can offset ordinary (W-2) income if you actively participate and your MAGI is under $100k (phasing out to $0 by $150k); unused losses carry forward. On sale, claimed depreciation is recaptured at up to 25%, and gains may owe capital-gains tax (a 1031 exchange can defer both). Figures are a year-1 estimate at your 24.0% rate — not tax advice; consult a CPA.
Schools (NCES district)
- District
- Anoka-Hennepin Public School District
- NCES district ID
- 2703180
- Math proficiency
- 49% ▼ -14.00%
- Reading proficiency
- 55% ▼ -10.00%
- Median HH income
- $73,837
- Composite
- 46.7/100
- National rank
- #2400
- State rank
- #71 of 301 in MN
Livability — Andover
- Score
- 72/100
- State rank
- #291
- US rank
- #6311
Category grades
Schools grade is shown separately in the Schools card above.
Census & demographics
- Census place
- Andover, MN
- Population (ZIP)
- 49,452
Population outlook (Anoka County) Hauer SSP2
- Today (2025)
- 375,223 people
- By 2030
- 387,850 · +3.4%
- By 2040
- 407,239 · +8.5%
- By 2050
- 417,541 · +11.3%
- By 2075
- 448,447 · +19.5%
- By 2100
- 464,954 · +23.9%
Race, ethnicity, and origin ACS 2023
- Neighborhood character
- Predominantly White (88%)
- Race & ethnicity
- White 88% Two or more races 4% Asian 3% Black 3% Hispanic / Latino 2%
- Common ancestry
- Portuguese 14% Romanian 6% Lithuanian 3%
- Foreign-born
- 5% · Canada
- Languages at home
- 94% English-only · Other Asian/Pacific 2% Spanish 1% Russian/Polish/Slavic 1%
Political lean MEDSL · Anoka
- 2024 margin
- Toss-up / Even · D 46.6% · R 51.0% · Other 2.4%
- 2008→2024 swing
- -2.0pp toward R · 2008: -2.4pp · 2024: -4.4pp
- All cycles
- 2024: R+4.4 2020: R+1.9 2016: R+9.7 2012: R+2.6 2008: R+2.4
Not yet ingested
- Civics
- —
Market trends
- HPI YoY
- ▼ -267.68%
- Current HPI
- 242.7122
- Rent YoY
- —
- Metro
- —
- State GDP YoY
- ▲ 2.41%
- F500 in state
- 34
Industry mix (Fortune 500 HQ in MN)
| Industry | F500 HQs | Revenue |
|---|---|---|
| Healthcare | 2 | $407B |
|
||
| Retail | 2 | $150B |
|
||
| Consumer Goods | 2 | $32B |
|
||
| Industrial Machinery | 2 | $6B |
|
||
| Agriculture | 1 | $40B |
|
||
| Healthcare / Medical Devices | 1 | $32B |
|
||
Price history
+300.5% since first listed7 events — show timeline
- 2026-06-05 Sold (MLS) $320,000 NORTHSTARMLS as Distributed by MLS Grid
- 2026-05-08 Pending — NORTHSTARMLS as Distributed by MLS Grid
- 2026-05-04 Contingent — NORTHSTARMLS as Distributed by MLS Grid
- 2026-04-30 Listed $314,900 NORTHSTARMLS as Distributed by MLS Grid
- 2026-04-20 Coming Soon $314,900 NORTHSTARMLS as Distributed by MLS Grid
- 1992-03-16 Sold (MLS) $79,900 NORTHSTARMLS as Distributed by MLS Grid
- 1992-02-18 Listed $79,900 NORTHSTARMLS as Distributed by MLS Grid
Property tax history
+3.4%/yrLatest (2026): $3,065 · +7.4% YoY. Source: county tax records.
Cash-flow waterfall
monthlySold comps — $/sqft
last 12 mo · ≤1 miLoading sold comps…