9735 Chillicothe Rd #10 · Kirtland, OH
Flood risk 8/10 · Major
- FEMA flood zone
- X (unshaded)
- Chance of flooding over 30 yrs
- 0.99%
- Est. flood insurance / yr
- $507 – $1,088
Fire risk 1/10 · Minimal
- Est. fire insurance / yr
- $713 – $1,323
Heat risk 2/10 · Minimal
- Hot days now (above 94°F)
- 7 days/yr
- Hot days in 30 yrs
- 16 days/yr
Wind risk 1/10 · Minimal
- Chance of severe wind over 30 yrs
- —
Air-quality risk 3/10 · Minor
- Unhealthy air days now
- 3 days/yr
- Unhealthy air days in 30 yrs
- 4 days/yr
Risk factors via First Street. Map © Google.
Why this score? — see what drove the B+ grade
The composite is a weighted blend of 9 inputs, each scored 0–100. Each bar is that input's sub-score; the figure is the points it added to the 100-point composite (weight × sub-score).
- Cash flow +30.0/30.0
- DSCR +10.0/10.0
- 1% rule +8.9/10.0
- ARV discount +7.5/15.0
- Schools +6.8/10.0
- Condition / age +5.0/5.0
- Livability +4.0/5.0
- Rent growth +3.5/5.0
- Appreciation +0.0/10.0
$89,500
🖨 Deal sheet 📄 Offer letter ✓ Due diligence
Listing remarks
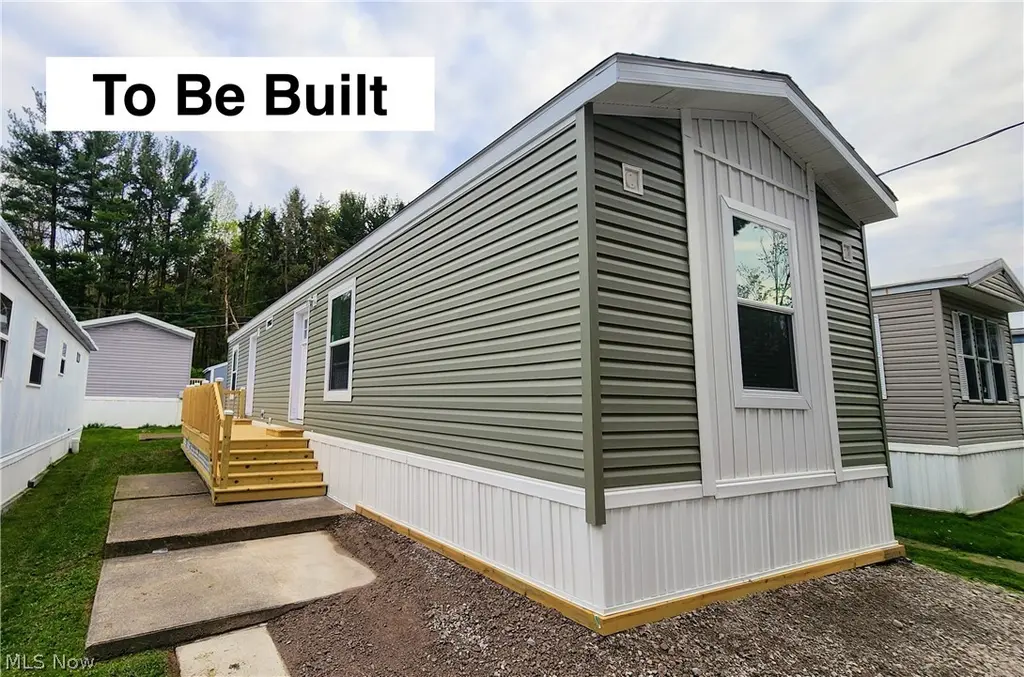
Coming Soon! Be the first to own this brand-new, modern 2-bedroom, 1-bath home—currently to be built and on order. Thoughtfully designed for comfort and convenience, this home features a smart layout with bedrooms positioned on opposite ends for added privacy. The kitchen offers ample cabinet space on both sides, providing plenty of storage for all your needs, and comes fully equipped with appliances (with the option to bring your own washer and dryer). The bathroom includes a practical shower/tub combination, perfect for everyday living. Step outside and enjoy a newly installed deck—ideal for relaxing and making the most of the warmer months. Located in the beautiful city of Ki
Key facts
- Built 2026
- Listed 44 days
Property features AI
Finance
- Other: Above-grade finished area reported by builder
- Financial info: Land lease payment $525
- HOA & community: Located in a senior community; Subject to a land lease ($525)
Exterior
- Parking: On-street parking
- Utilities: Public water; Private sewer
- Home design: Single-story unit; Built by builder
- Construction: Vinyl siding; Asphalt/fiberglass roof; Home warranty included
- Exterior features: Deck
Interior
- Kitchen: Kitchen on the first floor; Dishwasher; Microwave; Range; Refrigerator
- Bedrooms: 2 main-level bedrooms (both on the first floor)
- Flooring: Carpet in bedrooms
- Bathrooms: 1 full bathroom (on the first floor)
- Heating & cooling: Forced air heating; Heating present
- Interior features: 6 total rooms; First-floor living room; First-floor laundry room; Deck
- Laundry & utility: In-unit laundry
Neighborhood map
What this means for you Summary
Snapshot
- This is a 2-bed/1.0-bath single-family listed at $90k. Condition is rated excellent.
Deal economics
- At list price, monthly cash flow is $296 ($4k/yr) — positive.
- The deal already cash-flows at list — no discount required.
- Meets the 1% rule at list price ($1k rent vs $90k).
- Recommended offer: $87k (3.0% below list) — sets the bar for market timing.
- Cap rate 11.2% vs local median 3.5% in Kirtland — top-decile yield for the area; either an underpriced asset or a hidden risk that comps aren't pricing in. Stress-test before assuming the spread holds.
Location & tenants
- Location reads 80/100 on livability (#109 in OH, #1,647 nationally) — a professional / high-income tenant draw. Strengths: schools A+, crime A+, employment A+; Watch: health & safety D, amenities F, commute F.
- Kirtland Local (suburban): math 73% / reading 80% proficiency, ranked #57 of 656 in OH (top 9%) — strong family-tenant draw, lease renewals of 3-5y typical; only 9% free/reduced lunch — higher-income household profile.
- Market conditions: Rents rising fast (+4.0%/yr); 187 active listings in the ZIP; solid renter incomes; 448 units permitted in Lake County in 2024 (0 in 5+ unit buildings).
Forward outlook
- Local home prices are declining (-3.0%/yr); year-one equity from $619 of loan paydown is wiped out by about $3k of value loss. Plan a longer hold.
- Lake County population projected to shrink 8% by 2050 — rents likely to lag national; underwrite the cash flow, not the appreciation.
- At projected returns (-3.0% appreciation + 4.0% rent growth), your $25k cash investment doubles in ~8 years — after that, you're playing with house money.
Negotiation context
- It's been on market 44 days — a 3% lower offer ($87k) is reasonable based on typical stale-listing flexibility.
Risks & watch-outs
- Watch-outs: flood insurance adds $66/mo.
- Climate carrying-cost: severe flood risk — expect insurance premiums to compound above CPI over the hold.
Questions for the listing agent
- It's been on market 44 days. Have you received any prior offers? Is the seller open to a 3% concession, seller financing, or rate buy-down credit?
- What's the actual annual flood-insurance premium (NFIP or private), and is the property in a SFHA with mandatory coverage?
- Is there a deadline driving the sale (1031 exchange, divorce, estate, relocation)? That informs how much negotiation room exists.
- Schools are A-rated — typically a magnet for longer-tenancy family renters. What's the average tenant stay here, and is there a school-zone premium baked into asking?
- What's the average days-on-market for RENTAL listings here right now (not sales)? A rising rental-DOM trend means longer vacancies and softer asking-rent achievability than the comps imply.
- What's the recent tenant-quality profile in this submarket — average credit score on applications, eviction rate, late-payment / NSF rate, and stable-employment percentage? A property-management company in the area should have these aggregated.
- How much new for-sale + rental construction is in the pipeline within 1–3 miles? Heavy new supply typically softens prices + rents 12–24 months out; constrained supply supports both.
Investment metrics
- 1% rule
- 1.39% ✓
- Cap rate
- 11.16%
- Cash-on-cash
- 17.37%
- DSCR
- 1.77
- GRM
- 6.0
CMA / ARV
- ARV (median comp)
- $30,512
- List price
- $89,500
- Delta
- 193.33%
- Verdict
- OVERPRICED
- Comps
- 18 within 1.0 mi
Show comp detail 4 sales within ~0.75 mi
| Address | Dist | Beds/Ba | Sqft | Sold | Price | $/sf | Match |
|---|---|---|---|---|---|---|---|
| 9735 Chillicothe Rd #01 | 0.05mi | 2/1.0 | 714 (-2%) | 10mo | $5,100 | $7 | 86 |
| 9735 Chillicothe Rd #13 | 0.05mi | 2/1.0 | 672 (-8%) | 7mo | $13,800 | $21 | 79 |
| 9735 Chillicothe Rd #20 | 0.05mi | 2/1.0 | 780 (+7%) | 18mo | $28,300 | $36 | 70 |
| 8323 Eagle Rd #38 | 0.35mi | 2/2.0 | 765 (+5%) | 11mo | $86,000 | $112 | 62 |
Match score weights: distance 35% · size 25% · config 20% · recency 20%. Top-matched comps best support the ARV.
Projected returns pro-forma
-3.0% appreciation · 4.01% rent growth · sell at horizon
- IRR
- 5.8%
- Equity multiple
- 1.23×
- Total profit
- $5,701
- Equity at exit
- $13,345
- IRR
- 16.2%
- Equity multiple
- 2.39×
- Total profit
- $34,843
- Equity at exit
- $7,738
Cash invested: $25,060 (down + closing). Projections, not guarantees.
Landlord ↔ Tenant lean methodology
- Overall (STATE)
- 73 Landlord-Friendly
- State Ohio
- 73 Landlord-Friendly · R+6
- County
- — inherits STATE
- City
- — inherits STATE
ZIP-level market 44094
- Rents YoY
- 4.0%
- Active inventory
- 187
- Price-to-rent
- 6.0×
Monthly cashflow live
- Estimated rent
- $1,242 medium interval (Pro) →
- Mortgage (P&I)
- −$469
- Tax est. 1.5%
- −$112 /mo · $1,342/yr
- Insurance
- −$37
- Flood insurance flood zone
- −$66 /mo · $798/yr
- HOA
- −$0
- Vacancy / Maint / Mgmt
- −$261
- Net cashflow
- $296
Break-even live
UW: 25.0% down · 7.5% · 30yr · 1.5% tax · 5.0% vac · 8.0% maint · 8.0% mgmt
Financing live
Cash to close
- Down payment
- $22,375
- Closing costs
- $2,685
- Reserves months
- —
- Total cash needed
- —
Loan-product check · same deal, 3 products live
Conventional
25% down · 7.5% · 30yr
- Down + closing
- —
- Monthly P&I
- —
- Monthly cashflow
- —
- DSCR
- —
- Eligible?
- —
Personal DTI + credit; lowest rate.
DSCR
20% down · 8.5% · 30yr
- Down + closing
- —
- Monthly P&I
- —
- Monthly cashflow
- —
- DSCR
- —
- Eligible?
- —
No personal income docs; deal must DSCR.
Hard money
10% down · 12.0% · 12mo
- Down + closing
- —
- Monthly P&I
- —
- Monthly cashflow
- —
- DSCR
- —
- Eligible?
- —
Short-term bridge; refi at stabilization.
Listing history 15 events
-
2026-06-18days on market $89,500 Active 44 DOM
-
2026-06-17days on market $89,500 Active 43 DOM
-
2026-06-16days on market $89,500 Active 42 DOM
-
2026-06-15days on market $89,500 Active 41 DOM
-
2026-06-13days on market $89,500 Active 39 DOM
-
2026-06-13days on market $89,500 Active 38 DOM
-
2026-06-09days on market $89,500 Active 35 DOM
-
2026-06-08days on market $89,500 Active 34 DOM
-
2026-06-07days on market $89,500 Active 33 DOM
-
2026-06-05days on market $89,500 Active 30 DOM
-
2026-06-03days on market $89,500 Active 29 DOM
-
2026-06-02days on market $89,500 Active 28 DOM
-
2026-06-01days on market $89,500 Active 27 DOM
-
2026-05-31days on market $89,500 Active 26 DOM
-
2026-05-05$89,500 Active 1100-char remark
ⓘ Source: listings_history table (triggers on properties + properties_extension) + one-shot
backfill from property_details.listing_events for pre-trigger history.
Climate risk First Street
- Flood 8/10 Severe FEMA zone X (unshaded) · 99% chance over 30 yrs
- Wildfire 1/10 Low
- Heat 2/10 Low 7 d/yr ≥94°F today · 16 d/yr by 30 yrs out
- Wind 1/10 Low
- Air quality 3/10 Moderate 3 unhealthy d/yr today · 4 by 30 yrs out
Nearby sold comps map
Loading sold comps map…
Walkable amenities ~0.75 mi
Loading nearby amenities…
Taxation est. · year 1
- Rental income
- $14,905
- − Mortgage interest
- −$5,013
- − Property taxes
- −$1,342
- − Insurance
- −$1,245
- − Repairs & maintenance
- −$1,192
- − Management
- −$1,192
- − Depreciation
- −$2,604
- Taxable income
- $2,316
- Est. tax owed @ 24.0%
- −$556
- After-tax cash flow
- $2,999/yr
For passive investors: Depreciation is non-cash, so a rental often shows a tax loss while cash-flowing — sheltering income. Rental losses are passive: they offset passive income freely, and up to $25,000/yr can offset ordinary (W-2) income if you actively participate and your MAGI is under $100k (phasing out to $0 by $150k); unused losses carry forward. On sale, claimed depreciation is recaptured at up to 25%, and gains may owe capital-gains tax (a 1031 exchange can defer both). Figures are a year-1 estimate at your 24.0% rate — not tax advice; consult a CPA.
Condition & rehab AI · 20 photos
This brand-new, modern home is move-in ready with no repairs or maintenance needed. It offers a smart layout, ample storage, and a newly installed deck, making it ideal for both resale and rental.
Value-add opportunities
- Both Paint exterior — Enhances curb appeal and value
- Both Install outdoor lighting — Improves safety and enhances curb appeal
- Both Add landscaping — Enhances curb appeal and value
- Both Install smart home features — Enhances comfort and value
Renovation cost estimate screening
Value-add ROI direction
- Both Paint exterior — Enhances curb appeal and value ↑
- Both Install outdoor lighting — Improves safety and enhances curb appeal ↑
- Both Add landscaping — Enhances curb appeal and value ↑
- Both Install smart home features — Enhances comfort and value ↑
ⓘ Cost ranges are severity-bucket heuristics (US national rule-of-thumb). Get contractor quotes + a written scope before underwriting a rehab budget.
Schools (NCES district)
- District
- Kirtland Local
- NCES district ID
- 3904787
- Math proficiency
- 73% ▼ -10.00%
- Reading proficiency
- 80% ▼ -2.00%
- Median HH income
- $83,416
- Composite
- 67.93/100
- National rank
- #360
- State rank
- #57 of 656 in OH
Livability — Kirtland
- Score
- 80/100
- State rank
- #109
- US rank
- #1647
Category grades
Schools grade is shown separately in the Schools card above.
Census & demographics
- Census place
- Kirtland, OH
- County
- Lake County · 204,927 people
- Metro
- Cleveland-Elyria, OH
- Population (ZIP)
- 36,873
- Household income
- $78,772
- Rent vs Own
- Severe rent burden
- 1381.0
Population outlook (Lake County) Hauer SSP2
- Today (2025)
- 230,022 people
- By 2030
- 228,151 · -0.8%
- By 2040
- 221,018 · -3.9%
- By 2050
- 212,754 · -7.5%
- By 2075
- 200,309 · -12.9%
- By 2100
- 183,315 · -20.3%
Race, ethnicity, and origin ACS 2023
- Neighborhood character
- Predominantly White (86%)
- Race & ethnicity
- White 86% Black 7% Two or more races 4% Hispanic / Latino 2% Asian 2%
- Common ancestry
- Romanian 7% Lithuanian 2% Slovak 2%
- Foreign-born
- 7% · Canada, China
- Languages at home
- 92% English-only · Russian/Polish/Slavic 3% Other Indo-European 1% German/W. Germanic 1%
Political lean MEDSL · Lake
- 2024 margin
- R (+14.3) · D 42.4% · R 56.7%
- 2008→2024 swing
- -15.2pp toward R · 2008: 0.8pp · 2024: -14.3pp
- All cycles
- 2024: R+14.3 2020: R+13.6 2016: R+15.6 2012: R+1.7 2008: D+0.8
Not yet ingested
- Civics
- —
Market trends
- HPI YoY
- ▼ -229.28%
- Current HPI
- 179.81
- Rent YoY
- ▲ 4.01%
- Metro
- Cleveland-Elyria, OH
- State GDP YoY
- ▲ 1.98%
- F500 in state
- 48
Industry mix (Fortune 500 HQ in OH)
| Industry | F500 HQs | Revenue |
|---|---|---|
| Insurance | 3 | $145B |
|
||
| Industrial Machinery | 3 | $49B |
|
||
| Financial Services | 3 | $24B |
|
||
| Consumer Goods | 2 | $93B |
|
||
| Aerospace / Defense | 2 | $47B |
|
||
| Utilities | 2 | $33B |
|
||
Price history
1 event — show timeline
- 2026-05-05 Listed $89,500 MLSNOW
Cash-flow waterfall
monthlySold comps — $/sqft
last 12 mo · ≤1 miLoading sold comps…