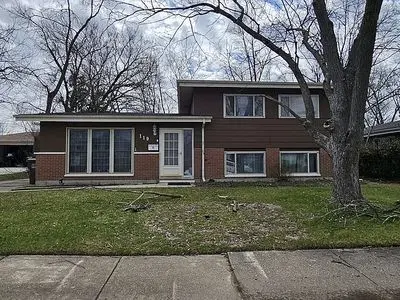
119 Hay St · Park Forest, IL
Flood risk 1/10 · Minimal
- FEMA flood zone
- X (unshaded)
- Chance of flooding over 30 yrs
- 0.0%
- Est. flood insurance / yr
- $473 – $860
Fire risk 2/10 · Minimal
- Est. fire insurance / yr
- $804 – $1,492
Heat risk 3/10 · Minor
- Hot days now (above 101°F)
- 7 days/yr
- Hot days in 30 yrs
- 16 days/yr
Wind risk 2/10 · Minimal
- Chance of severe wind over 30 yrs
- —
Air-quality risk 2/10 · Minimal
- Unhealthy air days now
- 1 days/yr
- Unhealthy air days in 30 yrs
- 1 days/yr
Risk factors via First Street. Map © Google.
Why this score? — see what drove the C- grade
The composite is a weighted blend of 9 inputs, each scored 0–100. Each bar is that input's sub-score; the figure is the points it added to the 100-point composite (weight × sub-score).
- Cash flow +25.3/30.0
- DSCR +8.3/10.0
- 1% rule +5.6/10.0
- ARV discount +3.9/15.0
- Livability +3.9/5.0
- Rent growth +2.5/5.0
- Condition / age +2.5/5.0
- Schools +0.9/10.0
- Appreciation +0.0/10.0
$178,000
🖨 Deal sheet 📄 Offer letter ✓ Due diligence
Listing remarks
Estate sale. Home in fair condition needs cosmetic updates and some repairs. Seeking highest and best offers. Will schedule open house for interested parties tbd. New a/c
Key facts
- Built 1958
- Listed 14 days
Neighborhood map
What this means for you Summary
Snapshot
- This is a 3-bed/1.5-bath single-family listed at $178k.
Deal economics
- At list price, monthly cash flow is $403 ($5k/yr) — positive.
- The deal already cash-flows at list — no discount required.
- Meets the 1% rule at list price ($2k rent vs $178k).
Location & tenants
- Location reads 78/100 on livability (#148 in IL, #2,726 nationally) — a middle-class / working-renter tenant base. Strengths: commute A+, cost of living A+, housing A+; Watch: schools D+, amenities F.
- Rich Twp Hsd 227 (suburban): math 5% / reading 12% proficiency, ranked #577 of 620 in IL (top 93%) — low school quality limits family demand, transient renter base, plan for 1-2y turnover.
- Market conditions: 102 active listings in the ZIP; 11 comparable units currently listed for rent nearby; rentals leasing fast (median 4d on market — plan ~1-2 weeks tenant-placement turnaround); 6,272 units permitted in Cook County in 2024 (4,658 in 5+ unit buildings).
- This rent runs 37% of the median local income ($62k/yr) — at the standard rent-burdened threshold; future hikes will face affordability resistance.
Forward outlook
- Local home prices are declining (-3.0%/yr); year-one equity from $1k of loan paydown is wiped out by about $5k of value loss. Plan a longer hold.
Negotiation context
- Only 14 days on market — expect competitive offers; lowballing is unlikely to land.
- Current owner paid $61k; list at $178k implies a 192% gain — meaningful room to come down on a strong offer.
Risks & watch-outs
- Watch-outs: built in 1958 — expect roof / HVAC / electrical / plumbing capex.
Questions for the listing agent
- Built in 1958 — when were the roof, HVAC, electrical panel, plumbing, and water heater last replaced?
- Is there a deadline driving the sale (1031 exchange, divorce, estate, relocation)? That informs how much negotiation room exists.
- Schools are D-rated, which usually means shorter tenancies and higher turnover. Who's the typical renter profile here, and what's been the actual vacancy rate?
- What's the average days-on-market for RENTAL listings here right now (not sales)? A rising rental-DOM trend means longer vacancies and softer asking-rent achievability than the comps imply.
- What's the recent tenant-quality profile in this submarket — average credit score on applications, eviction rate, late-payment / NSF rate, and stable-employment percentage? A property-management company in the area should have these aggregated.
- How much new for-sale + rental construction is in the pipeline within 1–3 miles? Heavy new supply typically softens prices + rents 12–24 months out; constrained supply supports both.
Investment metrics
- 1% rule
- 1.06% ✓
- Cap rate
- 9.01%
- Cash-on-cash
- 9.70%
- DSCR
- 1.43
- GRM
- 7.8
CMA / ARV
- ARV (on-the-fly)
- $164,787
- Comps found
- 12
Show comp detail 12 sales within ~0.75 mi
| Address | Dist | Beds/Ba | Sqft | Sold | Price | $/sf | Match |
|---|---|---|---|---|---|---|---|
| 212 Berry St | 0.25mi | 4/2.0 (+1) | 1,121 (0%) | 0mo | $190,694 | $170 | 81 |
| 410 Todd St | 0.28mi | 4/1.5 (+1) | 1,121 (0%) | 3mo | $194,900 | $174 | 80 |
| 128 Algonquin St | 0.45mi | 3/1.0 | 1,150 (+3%) | 2mo | $169,000 | $147 | 71 |
| 1621 Ingrid Ln | 0.42mi | 3/1.0 | 1,194 (+6%) | 1mo | $173,000 | $145 | 66 |
| 118 Well St | 0.57mi | 3/1.0 | 1,092 (-3%) | 2mo | $177,000 | $162 | 66 |
| 150 Algonquin St | 0.54mi | 2/1.5 (-1) | 1,092 (-3%) | 2mo | $170,000 | $156 | 64 |
| 231 Farragut St | 0.44mi | 3/1.5 | 1,224 (+9%) | 2mo | $102,000 | $83 | 62 |
| 315 Illinois St | 0.47mi | 3/1.5 | 1,212 (+8%) | 3mo | $174,000 | $144 | 62 |
| 566 Minette Ln | 0.51mi | 3/1.0 | 1,066 (-5%) | 6mo | $95,000 | $89 | 61 |
| 300 Indiana St | 0.47mi | 3/1.5 | 1,209 (+8%) | 6mo | $170,000 | $141 | 60 |
| 312 Illinois St | 0.48mi | 3/1.5 | 1,250 (+12%) | 5mo | $216,047 | $173 | 55 |
| 1946 Wooster Ct | 0.43mi | 3/1.0 | 985 (-12%) | 5mo | $48,500 | $49 | 54 |
Match score weights: distance 35% · size 25% · config 20% · recency 20%. Top-matched comps best support the ARV.
Projected returns pro-forma
-3.0% appreciation · 3.0% rent growth · sell at horizon
- IRR
- -1.7%
- Equity multiple
- 0.93×
- Total profit
- $-3,247
- Equity at exit
- $26,540
- IRR
- 7.9%
- Equity multiple
- 1.60×
- Total profit
- $29,976
- Equity at exit
- $15,390
Cash invested: $49,840 (down + closing). Projections, not guarantees.
Landlord ↔ Tenant lean methodology
- Overall (STATE)
- 43 Moderately Tenant-Leaning
- State Illinois
- 43 Moderately Tenant-Leaning · D+7
- County
- — inherits STATE
- City
- — inherits STATE
ZIP-level market 60466
- Home prices YoY
- -21.1%
- Active inventory
- 102
- Price-to-rent
- 7.8×
Monthly cashflow live
- Estimated rent
- $1,892 high interval (Pro) →
- Mortgage (P&I)
- −$933
- Tax from tax record
- −$84 /mo · $1,009/yr
- Insurance
- −$74
- HOA
- −$0
- Vacancy / Maint / Mgmt
- −$397
- Net cashflow
- $403
Break-even live
UW: 25.0% down · 7.5% · 30yr · 1.5% tax · 5.0% vac · 8.0% maint · 8.0% mgmt
Financing live
Cash to close
- Down payment
- $44,500
- Closing costs
- $5,340
- Reserves months
- —
- Total cash needed
- —
Loan-product check · same deal, 3 products live
Conventional
25% down · 7.5% · 30yr
- Down + closing
- —
- Monthly P&I
- —
- Monthly cashflow
- —
- DSCR
- —
- Eligible?
- —
Personal DTI + credit; lowest rate.
DSCR
20% down · 8.5% · 30yr
- Down + closing
- —
- Monthly P&I
- —
- Monthly cashflow
- —
- DSCR
- —
- Eligible?
- —
No personal income docs; deal must DSCR.
Hard money
10% down · 12.0% · 12mo
- Down + closing
- —
- Monthly P&I
- —
- Monthly cashflow
- —
- DSCR
- —
- Eligible?
- —
Short-term bridge; refi at stabilization.
Rent comps 11 comps
| Address | Beds | Baths | Sqft | Rent | $/sqft | DOM | Units | Dist |
|---|---|---|---|---|---|---|---|---|
| 631 Andover St Chicago Heights, IL | 3.0 | 1.0 | 900 | $1,450 | $1.61 | 4d | 1 | 0.26mi |
| 444 Hickory St Unit 2A Chicago Heights, IL | 3.0 | 1.0 | 900 | $1,695 | $1.88 | 1d | 1 | 0.74mi |
| 436 W Hickory St Unit Na Chicago Heights, IL | 3.0 | 1.0 | 1091 | $1,800 | $1.65 | 1d | 1 | 0.75mi |
| 432 Hickory St Unit 2 Chicago Heights, IL | 3.0 | 1.0 | 1200 | $1,800 | $1.50 | 21d | 1 | 0.76mi |
| 1267 Division St Unit 1267 Chicago Heights, IL | 3.0 | 1.5 | 1200 | $1,500 | $1.25 | 1d | 1 | 0.81mi |
| 417 W Hickory St Unit 2 Chicago Heights, IL | 3.0 | 1.0 | 900 | $1,800 | $2.00 | 21d | 1 | 0.81mi |
| 370 E 17th St Chicago Heights, IL | 3.0 | 1.0 | 1058 | $2,600 | $2.46 | 17d | 1 | 0.96mi |
| 398 W Lincoln Hwy Unit 4 Chicago Heights, IL | 3.0 | 2.0 | 1200 | $1,850 | $1.54 | 1d | 1 | 1.01mi |
| 3324 Western Ave Park Forest, IL | 1.0–3.0 | 1.0 | 1026 | $1,995 | $1.94 | 1d | 11 | 1.23mi |
| 3538 212th Pl Matteson, IL | 3.0 | 1.0 | 1209 | $2,000 | $1.65 | 25d | 1 | 1.39mi |
| 400 Watseka St Park Forest, IL | 4.0 | 2.0 | 1161 | $2,161 | $1.86 | 16d | 1 | 1.44mi |
Listing history 2 events
-
2026-05-12$178,000 Active
-
1979-07-11soldstatus $61,000
ⓘ Source: listings_history table (triggers on properties + properties_extension) + one-shot
backfill from property_details.listing_events for pre-trigger history.
Tax reassessment forecast IL · Partial reset (capped growth)
- Current annual tax
- $1,009 · $84/mo
- Projected year-2 tax
- $2,525 · $210/mo
- Expected delta
- +$1,516/yr (+$126/mo · 150.3%)
ⓘ Screening estimate from a state-policy table — verify with the county assessor before closing.
Climate risk First Street
- Flood 1/10 Low FEMA zone X (unshaded) · 0% chance over 30 yrs
- Wildfire 2/10 Low
- Heat 3/10 Moderate 7 d/yr ≥101°F today · 16 d/yr by 30 yrs out
- Wind 2/10 Low
- Air quality 2/10 Low 1 unhealthy d/yr today · 1 by 30 yrs out
Nearby sold comps map
Loading sold comps map…
Walkable amenities ~0.75 mi
Loading nearby amenities…
Taxation est. · year 1
- Rental income
- $22,701
- − Mortgage interest
- −$9,971
- − Property taxes
- −$1,009
- − Insurance
- −$890
- − Repairs & maintenance
- −$1,816
- − Management
- −$1,816
- − Depreciation
- −$5,178
- Taxable income
- $2,021
- Est. tax owed @ 24.0%
- −$485
- After-tax cash flow
- $4,348/yr
For passive investors: Depreciation is non-cash, so a rental often shows a tax loss while cash-flowing — sheltering income. Rental losses are passive: they offset passive income freely, and up to $25,000/yr can offset ordinary (W-2) income if you actively participate and your MAGI is under $100k (phasing out to $0 by $150k); unused losses carry forward. On sale, claimed depreciation is recaptured at up to 25%, and gains may owe capital-gains tax (a 1031 exchange can defer both). Figures are a year-1 estimate at your 24.0% rate — not tax advice; consult a CPA.
Schools (NCES district)
- District
- Rich Twp Hsd 227
- NCES district ID
- 1733420
- Math proficiency
- 5% ▼ -3.00%
- Reading proficiency
- 12% ▬ 0.00%
- Median HH income
- $56,056
- Composite
- 8.93/100
- National rank
- #9885
- State rank
- #577 of 620 in IL
Livability — Park Forest
- Score
- 78/100
- State rank
- #148
- US rank
- #2726
Category grades
Schools grade is shown separately in the Schools card above.
Census & demographics
- Census place
- Park Forest, IL
- County
- Cook County · 4,486,803 people
- City population
- 21,461
- Metro
- Chicago-Naperville-Elgin, IL-IN-WI
- Population (ZIP)
- 21,461
- Household income
- $61,654
- Rent vs Own
- Severe rent burden
- 900.0
Population outlook (Cook County) Hauer SSP2
- Today (2025)
- 5,347,519 people
- By 2030
- 5,357,703 · +0.2%
- By 2040
- 5,324,924 · -0.4%
- By 2050
- 5,230,762 · -2.2%
- By 2075
- 4,785,735 · -10.5%
- By 2100
- 4,188,836 · -21.7%
Race, ethnicity, and origin ACS 2023
- Neighborhood character
- Predominantly Black (69%)
- Race & ethnicity
- Black 69% White 19% Hispanic / Latino 9% Two or more races 3% Native American 1%
- Hispanic origin (detail)
- Mexican 8%
- Common ancestry
- Romanian 2% Iranian 1% Italian 1%
- Foreign-born
- 6% · Canada
- Languages at home
- 90% English-only · Spanish 7% French/Haitian/Cajun 1% Russian/Polish/Slavic 1%
Political lean MEDSL · Cook
- 2024 margin
- Solid D (+42.0) · D 70.4% · R 28.4% · Other 1.2%
- 2008→2024 swing
- -11.4pp toward R · 2008: 53.4pp · 2024: 42.0pp
- All cycles
- 2024: D+42.0 2020: D+50.3 2016: D+53.0 2012: D+49.4 2008: D+53.4
Not yet ingested
- Civics
- —
Market trends
- HPI YoY
- ▼ -58.87%
- Current HPI
- 219.9692
- Rent YoY
- —
- Metro
- Chicago-Naperville-Elgin, IL-IN-WI
- State GDP YoY
- ▲ 1.59%
- F500 in state
- 60
Industry mix (Fortune 500 HQ in IL)
| Industry | F500 HQs | Revenue |
|---|---|---|
| Insurance | 4 | $201B |
|
||
| Consumer Goods | 4 | $87B |
|
||
| Industrial Machinery | 3 | $64B |
|
||
| Healthcare | 2 | $55B |
|
||
| Retail / Pharmacy | 1 | $148B |
|
||
| Agriculture / Food | 1 | $86B |
|
||
Price history
+191.8% since first listed2 events — show timeline
- 2026-05-12 Listed $178,000 FSBO.com
- 1979-07-11 Sold (Public Records) $61,000 Public Records
Property tax history
-4.3%/yrLatest (2023): $1,009 · -40.0% YoY. Source: county tax records.
Cash-flow waterfall
monthlySold comps — $/sqft
last 12 mo · ≤1 miLoading sold comps…