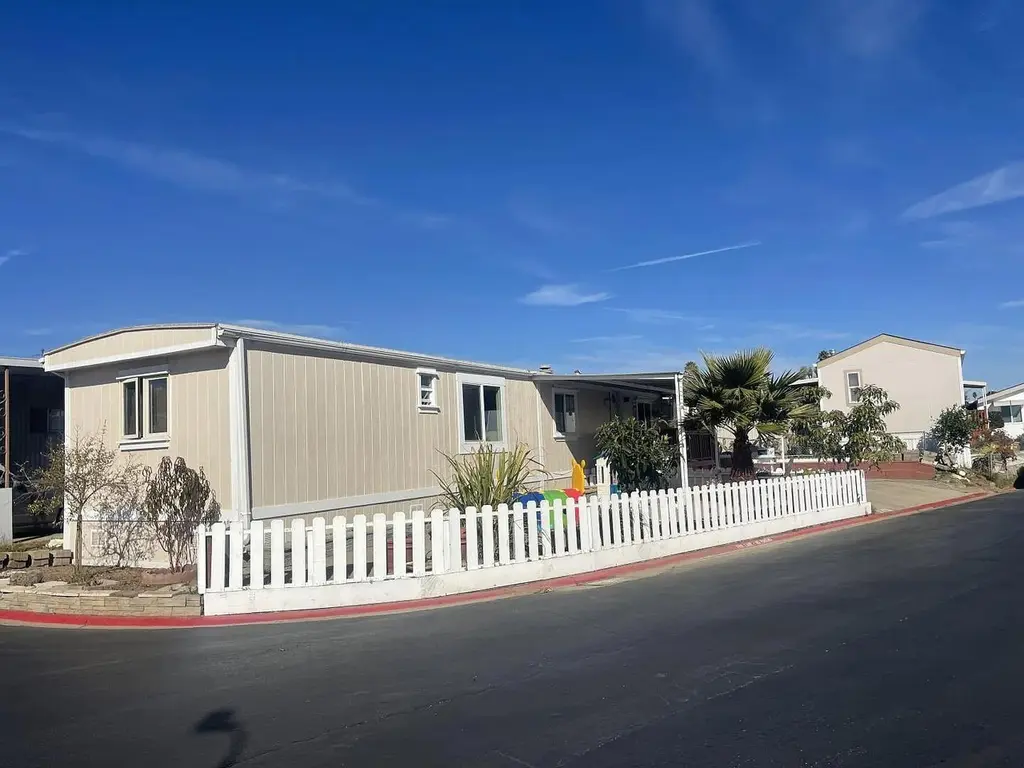
255 E Bolivar St #204 · Salinas, CA
Flood risk 1/10 · Minimal
- FEMA flood zone
- X (shaded)
- Chance of flooding over 30 yrs
- 0.0%
- Est. flood insurance / yr
- $507 – $1,088
Fire risk 2/10 · Minimal
- Est. fire insurance / yr
- $659 – $1,223
Heat risk 3/10 · Minor
- Hot days now (above 81°F)
- 5 days/yr
- Hot days in 30 yrs
- 11 days/yr
Wind risk 1/10 · Minimal
- Chance of severe wind over 30 yrs
- —
Air-quality risk 7/10 · Major
- Unhealthy air days now
- 11 days/yr
- Unhealthy air days in 30 yrs
- 11 days/yr
Risk factors via First Street. Map © Google.
Why this score? — see what drove the B- grade
The composite is a weighted blend of 9 inputs, each scored 0–100. Each bar is that input's sub-score; the figure is the points it added to the 100-point composite (weight × sub-score).
- Cash flow +29.8/30.0
- DSCR +10.0/10.0
- 1% rule +8.4/10.0
- ARV discount +7.5/15.0
- Rent growth +3.7/5.0
- Livability +3.2/5.0
- Schools +3.0/10.0
- Condition / age +2.5/5.0
- Appreciation +0.0/10.0
$190,000
🖨 Deal sheet 📄 Offer letter ✓ Due diligence
Listing remarks
Welcome to this charming 2-bedroom, 2-bath home located in the highly sought-after Lamplighter Mobile Home Park! This mobile home stands as an inviting residence, completely prepared for a fresh start. This inviting home has been thoughtfully prepared, offering a welcoming atmosphere from the moment one steps inside. Nestled in a desirable community, this home provides a great opportunity to enjoy peaceful living while still being conveniently close to shopping, dining, and everyday essentials. Whether you're a first-time buyer, downsizing, or looking for a cozy retreat, this property has endless potential. More photos coming soondon't miss your chance to be among the first to explore this
Key facts
- Parking
- Built 1982
- Listed 25 days
Neighborhood map
What this means for you Summary
Snapshot
- This is a 2-bed/2.0-bath manufactured listed at $190k.
Deal economics
- At list price, monthly cash flow is $696 ($8k/yr) — positive.
- The deal already cash-flows at list — no discount required.
- Meets the 1% rule at list price ($3k rent vs $190k).
- Recommended offer: $187k (1.5% below list) — sets the bar for market timing.
- Cap rate 10.7% vs local median 2.7% in Salinas — top-decile yield for the area; either an underpriced asset or a hidden risk that comps aren't pricing in. Stress-test before assuming the spread holds.
Location & tenants
- Location reads 63/100 on livability (#465 in CA) — a middle-class / working-renter tenant base. Strengths: commute A+, health & safety A+, employment B+; Watch: schools F, crime D-, amenities F.
- Salinas Union High (urban): math 23% / reading 39% proficiency, ranked #998 of 1,400 in CA (top 71%) — families likely to look elsewhere, expect single-tenant / working-renter base with shorter leases; 66% free/reduced lunch — lower-income household profile, screen leases tightly.
- Market conditions: Rents rising fast (+4.9%/yr); 45 active listings in the ZIP; 4 comparable units currently listed for rent nearby; rentals leasing fast (median 13d on market — plan ~1-2 weeks tenant-placement turnaround); solid renter incomes; 530 units permitted in Monterey County in 2024 (50 in 5+ unit buildings).
- This rent runs 31% of the median local income ($98k/yr) — at the standard rent-burdened threshold; future hikes will face affordability resistance.
Forward outlook
- Local home prices are declining (-3.0%/yr); year-one equity from $1k of loan paydown is wiped out by about $6k of value loss. Plan a longer hold.
- Monterey County population projected at +10% by 2050 — modest demand growth; plan on rents tracking national, not racing it.
- At projected returns (-3.0% appreciation + 4.9% rent growth), your $53k cash investment doubles in ~7 years — after that, you're playing with house money.
Negotiation context
- It's been on market 25 days — a 2% lower offer ($187k) is reasonable based on typical stale-listing flexibility.
Questions for the listing agent
- Is there a deadline driving the sale (1031 exchange, divorce, estate, relocation)? That informs how much negotiation room exists.
- Schools are F-rated, which usually means shorter tenancies and higher turnover. Who's the typical renter profile here, and what's been the actual vacancy rate?
- Crime grade is D in this area — have there been break-ins, vandalism, or insurance claims at this property in the last 3 years? What carrier currently insures it and at what premium?
- What's the average days-on-market for RENTAL listings here right now (not sales)? A rising rental-DOM trend means longer vacancies and softer asking-rent achievability than the comps imply.
- What's the recent tenant-quality profile in this submarket — average credit score on applications, eviction rate, late-payment / NSF rate, and stable-employment percentage? A property-management company in the area should have these aggregated.
- How much new for-sale + rental construction is in the pipeline within 1–3 miles? Heavy new supply typically softens prices + rents 12–24 months out; constrained supply supports both.
Investment metrics
- 1% rule
- 1.34% ✓
- Cap rate
- 10.69%
- Cash-on-cash
- 15.70%
- DSCR
- 1.70
- GRM
- 6.2
CMA / ARV
- ARV (on-the-fly)
- $126,336
- Comps found
- 4
Show comp detail 4 sales within ~0.75 mi
| Address | Dist | Beds/Ba | Sqft | Sold | Price | $/sf | Match |
|---|---|---|---|---|---|---|---|
| 255 E Bolivar St #6 | 0.02mi | 2/1.0 | 720 (+7%) | 6mo | $195,500 | $272 | 78 |
| 55 San Juan Grade #16 | 0.56mi | 2/1.0 | 720 (+7%) | 13mo | $97,000 | $135 | 47 |
| 55 san juan grade Rd #23 | 0.53mi | 2/1.0 | 720 (+7%) | 18mo | $125,000 | $174 | 44 |
| 55 San Juan Grade Rd #85 | 0.57mi | 2/2.0 | 772 (+15%) | 8mo | $145,000 | $188 | 42 |
Match score weights: distance 35% · size 25% · config 20% · recency 20%. Top-matched comps best support the ARV.
Projected returns pro-forma
-3.0% appreciation · 4.87% rent growth · sell at horizon
- IRR
- 8.6%
- Equity multiple
- 1.35×
- Total profit
- $18,460
- Equity at exit
- $28,330
- IRR
- 19.4%
- Equity multiple
- 2.77×
- Total profit
- $94,100
- Equity at exit
- $16,428
Cash invested: $53,200 (down + closing). Projections, not guarantees.
Landlord ↔ Tenant lean methodology
- Overall (STATE)
- 18 Strongly Tenant-Friendly
- State California
- 18 Strongly Tenant-Friendly · D+13
- County
- — inherits STATE
- City
- — inherits STATE
ZIP-level market 93906
- Rents YoY
- 4.9%
- Active inventory
- 45
- Price-to-rent
- 6.2×
Monthly cashflow live
- Estimated rent
- $2,543 medium interval (Pro) →
- Mortgage (P&I)
- −$996
- Tax est. 1.5%
- −$238 /mo · $2,850/yr
- Insurance
- −$79
- HOA
- −$0
- Vacancy / Maint / Mgmt
- −$534
- Net cashflow
- $696
Break-even live
UW: 25.0% down · 7.5% · 30yr · 1.5% tax · 5.0% vac · 8.0% maint · 8.0% mgmt
Financing live
Cash to close
- Down payment
- $47,500
- Closing costs
- $5,700
- Reserves months
- —
- Total cash needed
- —
Loan-product check · same deal, 3 products live
Conventional
25% down · 7.5% · 30yr
- Down + closing
- —
- Monthly P&I
- —
- Monthly cashflow
- —
- DSCR
- —
- Eligible?
- —
Personal DTI + credit; lowest rate.
DSCR
20% down · 8.5% · 30yr
- Down + closing
- —
- Monthly P&I
- —
- Monthly cashflow
- —
- DSCR
- —
- Eligible?
- —
No personal income docs; deal must DSCR.
Hard money
10% down · 12.0% · 12mo
- Down + closing
- —
- Monthly P&I
- —
- Monthly cashflow
- —
- DSCR
- —
- Eligible?
- —
Short-term bridge; refi at stabilization.
Rent comps 4 comps
| Address | Beds | Baths | Sqft | Rent | $/sqft | DOM | Units | Dist |
|---|---|---|---|---|---|---|---|---|
| 2290 N Main St Salinas, CA | 1.0–3.0 | 1.0–2.0 | 985 | $2,911 | $2.96 | 1d | 13 | 0.30mi |
| 2362 N Main St #2 Salinas, CA | 1.0 | 1.0 | 640 | $2,195 | $3.43 | 21d | 1 | 0.34mi |
| 2073 Santa Rita St Salinas, CA | 2.0 | 1.0 | 492 | $2,593 | $5.26 | 2d | 13 | 0.37mi |
| 196 E Alvin Dr Salinas, CA | 1.0–2.0 | 1.0 | 735 | $2,650 | $3.61 | 12d | 2 | 1.39mi |
Listing history 3 events
-
2025-06-07historical
-
2025-05-11price
-
2025-01-24Active
ⓘ Source: listings_history table (triggers on properties + properties_extension) + one-shot
backfill from property_details.listing_events for pre-trigger history.
Climate risk First Street
- Flood 1/10 Low FEMA zone X (shaded) · 0% chance over 30 yrs
- Wildfire 2/10 Low
- Heat 3/10 Moderate 5 d/yr ≥81°F today · 11 d/yr by 30 yrs out
- Wind 1/10 Low
- Air quality 7/10 Severe 11 unhealthy d/yr today · 11 by 30 yrs out
Nearby sold comps map
Loading sold comps map…
Walkable amenities ~0.75 mi
Loading nearby amenities…
Taxation est. · year 1
- Rental income
- $30,519
- − Mortgage interest
- −$10,643
- − Property taxes
- −$2,850
- − Insurance
- −$950
- − Repairs & maintenance
- −$2,442
- − Management
- −$2,442
- − Depreciation
- −$5,527
- Taxable income
- $5,666
- Est. tax owed @ 24.0%
- −$1,360
- After-tax cash flow
- $6,994/yr
For passive investors: Depreciation is non-cash, so a rental often shows a tax loss while cash-flowing — sheltering income. Rental losses are passive: they offset passive income freely, and up to $25,000/yr can offset ordinary (W-2) income if you actively participate and your MAGI is under $100k (phasing out to $0 by $150k); unused losses carry forward. On sale, claimed depreciation is recaptured at up to 25%, and gains may owe capital-gains tax (a 1031 exchange can defer both). Figures are a year-1 estimate at your 24.0% rate — not tax advice; consult a CPA.
Schools (NCES district)
- District
- Salinas Union High
- NCES district ID
- 0633980
- Math proficiency
- 23% ▲ 2.00%
- Reading proficiency
- 39% ▲ 1.00%
- Median HH income
- $50,670
- Composite
- 29.86/100
- National rank
- #11691
- State rank
- #998 of 1400 in CA
Livability — Salinas
- Score
- 63/100
- State rank
- #465
- US rank
- #15876
Category grades
Schools grade is shown separately in the Schools card above.
Census & demographics
- Census place
- Salinas, CA
- County
- Monterey County · 241,191 people
- City population
- 119,069
- Metro
- Salinas, CA
- Population (ZIP)
- 64,199
- Household income
- $97,555
- Rent vs Own
- Severe rent burden
- 1736.0
Population outlook (Monterey County) Hauer SSP2
- Today (2025)
- 458,436 people
- By 2030
- 469,418 · +2.4%
- By 2040
- 489,615 · +6.8%
- By 2050
- 506,696 · +10.5%
- By 2075
- 531,048 · +15.8%
- By 2100
- 519,153 · +13.2%
Race, ethnicity, and origin ACS 2023
- Neighborhood character
- Predominantly Hispanic (76%)
- Race & ethnicity
- Hispanic / Latino 76% Two or more races 13% White 13% Asian 7% Black 2%
- Hispanic origin (detail)
- Mexican 70% Salvadoran 1%
- Common ancestry
- Russian 1% Italian 1% Romanian 1%
- Foreign-born
- 33% · Canada, China
- Languages at home
- 33% English-only · Spanish 60% Tagalog/Filipino 2% Chinese 1%
Political lean MEDSL · Monterey
- 2024 margin
- Strong D (+29.9) · D 63.4% · R 33.5% · Other 3.0%
- 2008→2024 swing
- -8.4pp toward R · 2008: 38.3pp · 2024: 29.9pp
- All cycles
- 2024: D+29.9 2020: D+41.3 2016: D+39.7 2012: D+33.9 2008: D+38.3
Not yet ingested
- Civics
- —
Market trends
- HPI YoY
- ▼ -690.60%
- Current HPI
- 262.5003
- Rent YoY
- ▲ 4.87%
- Metro
- Salinas, CA
- State GDP YoY
- ▲ 3.21%
- F500 in state
- 116
Industry mix (Fortune 500 HQ in CA)
| Industry | F500 HQs | Revenue |
|---|---|---|
| Technology | 27 | $1,492B |
|
||
| Financial Services | 3 | $174B |
|
||
| Retail | 3 | $44B |
|
||
| Insurance | 3 | $26B |
|
||
| Media / Entertainment | 2 | $115B |
|
||
| Pharmaceuticals / Biotech | 2 | $62B |
|
||
Property tax history
+3.2%/yrLatest (2025): $85 · +2.0% YoY. Source: county tax records.
Cash-flow waterfall
monthlySold comps — $/sqft
last 12 mo · ≤1 miLoading sold comps…