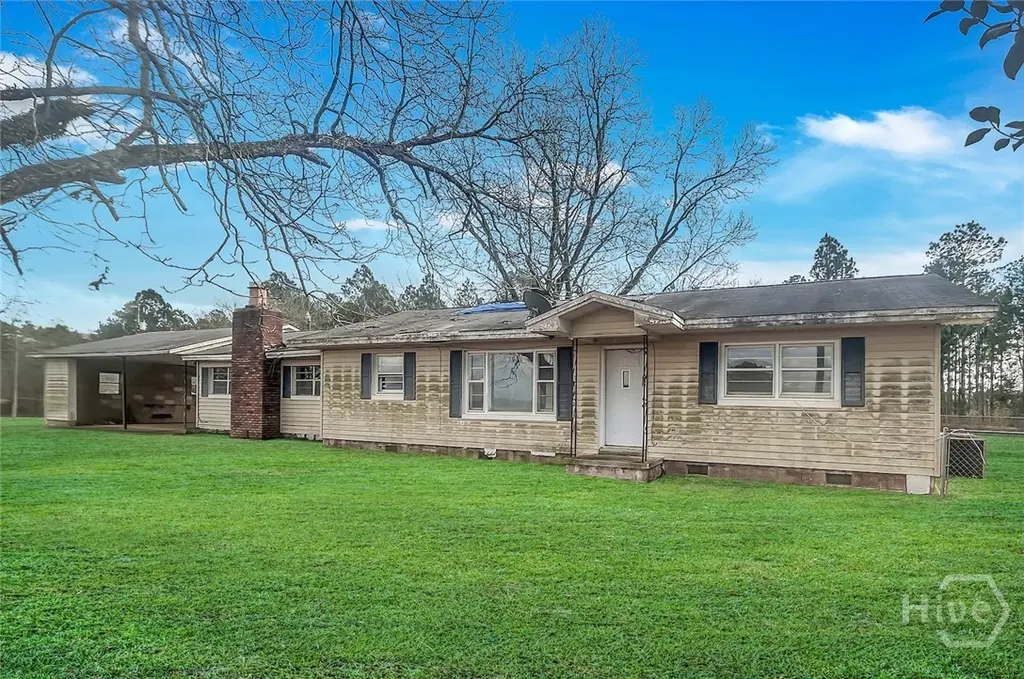
575 Mccarty Rd · Sylvester, GA
Flood risk 1/10 · Minimal
- FEMA flood zone
- X (unshaded)
- Chance of flooding over 30 yrs
- 0.0%
- Est. flood insurance / yr
- $473 – $860
Fire risk 5/10 · Moderate
- Est. fire insurance / yr
- $963 – $1,789
Heat risk 7/10 · Major
- Hot days now (above 108°F)
- 7 days/yr
- Hot days in 30 yrs
- 19 days/yr
Wind risk 8/10 · Major
- Chance of severe wind over 30 yrs
- 98.0%
Air-quality risk 4/10 · Minor
- Unhealthy air days now
- 5 days/yr
- Unhealthy air days in 30 yrs
- 6 days/yr
Risk factors via First Street. Map © Google.
Why this score? — see what drove the B- grade
The composite is a weighted blend of 9 inputs, each scored 0–100. Each bar is that input's sub-score; the figure is the points it added to the 100-point composite (weight × sub-score).
- Cash flow +30.0/30.0
- 1% rule +10.0/10.0
- DSCR +10.0/10.0
- ARV discount +7.5/15.0
- Livability +3.2/5.0
- Schools +2.6/10.0
- Rent growth +2.5/5.0
- Condition / age +2.5/5.0
- Appreciation +0.0/10.0
$69,900
🖨 Deal sheet 📄 Offer letter ✓ Due diligence
Listing remarks
Charming 3-bedroom, 1-bath Gem on 1.31 acres offering comfort, character, and space to enjoy-conveniently located just 20 minutes from Albany, GA. This home features a cozy family room with a fireplace, perfect for relaxing evenings, along with a formal dining room ideal for hosting family and friends. The kitchen open up to a breakfast area creating the perfect spot for everyday meals. A two-car carport provides ample parking, and the storage shed provides additional storage. Outside, the fenced yard offers privacy and plenty of room for pets, play, or outdoor entertaining. Whether you're searching for a primary residence or an investment opportunity, this home offers comfort, functionalit
Key facts
- Formal dining room
- Fenced yard
- Two-car carport
Tags
Neighborhood map
What this means for you Summary
Snapshot
- This is a 3-bed/1.0-bath single-family listed at $70k.
Deal economics
- At list price, monthly cash flow is $490 ($6k/yr) — positive.
- The deal already cash-flows at list — no discount required.
- Meets the 1% rule at list price ($1k rent vs $70k).
- Recommended offer: $64k (9.0% below list) — sets the bar for market timing.
- Cap rate 14.7% vs local median 3.6% in Sylvester — top-decile yield for the area; either an underpriced asset or a hidden risk that comps aren't pricing in. Stress-test before assuming the spread holds.
Location & tenants
- Location reads 63/100 on livability (#287 in GA) — a middle-class / working-renter tenant base. Strengths: cost of living A+, housing A+, crime B+; Watch: schools F, amenities F, commute F.
- Worth County (town): math 28% / reading 34% proficiency, ranked #91 of 174 in GA (top 52%) — families likely to look elsewhere, expect single-tenant / working-renter base with shorter leases; 66% free/reduced lunch — lower-income household profile, screen leases tightly.
- Market conditions: 71 active listings in the ZIP; 26 units permitted in Worth County in 2024 (0 in 5+ unit buildings).
Forward outlook
- Local home prices are declining (-3.0%/yr); year-one equity from $483 of loan paydown is wiped out by about $2k of value loss. Plan a longer hold.
- Worth County population projected at -31% by 2050 — secular population decline; favor cash flow + early exit over multi-decade hold.
- At projected returns (-3.0% appreciation + 3.0% rent growth), your $20k cash investment doubles in ~4 years — after that, you're playing with house money.
Negotiation context
- It's been on market 119 days — a 9% lower offer ($64k) is reasonable based on typical stale-listing flexibility.
- 5 sale attempts; this cycle's ask has dropped $10k (13%) from the opening price — seller is motivated, your offer sets the floor, not the list.
Risks & watch-outs
- Watch-outs: property tax is 2.7% of price.
- Climate carrying-cost: severe wind risk, 98% chance of damaging wind over 30y; moderate wildfire risk; extreme-heat days projected 7→19/yr by 2055 (HVAC capex compounding) — expect insurance premiums to compound above CPI over the hold.
Questions for the listing agent
- It's been on market 119 days. Have you received any prior offers? Is the seller open to a 9% concession, seller financing, or rate buy-down credit?
- Built in 1964 — when were the roof, HVAC, electrical panel, plumbing, and water heater last replaced?
- Property tax is high relative to price — has the assessment been appealed recently, and will the sale trigger a re-assessment?
- Why hasn't it sold? Are there any deal-killer items the seller is aware of (foundation, flood, title, zoning, code violations)?
- Is there a deadline driving the sale (1031 exchange, divorce, estate, relocation)? That informs how much negotiation room exists.
- Schools are F-rated, which usually means shorter tenancies and higher turnover. Who's the typical renter profile here, and what's been the actual vacancy rate?
- What's the average days-on-market for RENTAL listings here right now (not sales)? A rising rental-DOM trend means longer vacancies and softer asking-rent achievability than the comps imply.
- What's the recent tenant-quality profile in this submarket — average credit score on applications, eviction rate, late-payment / NSF rate, and stable-employment percentage? A property-management company in the area should have these aggregated.
- How much new for-sale + rental construction is in the pipeline within 1–3 miles? Heavy new supply typically softens prices + rents 12–24 months out; constrained supply supports both.
Investment metrics
- 1% rule
- 1.89% ✓
- Cap rate
- 14.71%
- Cash-on-cash
- 30.06%
- DSCR
- 2.34
- GRM
- 4.4
CMA / ARV
No comps found within radius.
Projected returns pro-forma
-3.0% appreciation · 3.0% rent growth · sell at horizon
- IRR
- 24.7%
- Equity multiple
- 2.02×
- Total profit
- $19,959
- Equity at exit
- $10,422
- IRR
- 32.5%
- Equity multiple
- 3.96×
- Total profit
- $57,838
- Equity at exit
- $6,044
Cash invested: $19,572 (down + closing). Projections, not guarantees.
Landlord ↔ Tenant lean methodology
- Overall (STATE)
- 90 Strongly Landlord-Friendly
- State Georgia
- 90 Strongly Landlord-Friendly · R+3
- County
- — inherits STATE
- City
- — inherits STATE
ZIP-level market 31791
- Home prices YoY
- -20.8%
- Active inventory
- 71
- Price-to-rent
- 4.4×
Monthly cashflow live
- Estimated rent
- $1,320 medium interval (Pro) →
- Mortgage (P&I)
- −$367
- Tax from tax record
- −$157 /mo · $1,880/yr
- Insurance
- −$29
- HOA
- −$0
- Vacancy / Maint / Mgmt
- −$277
- Net cashflow
- $490
Break-even live
UW: 25.0% down · 7.5% · 30yr · 1.5% tax · 5.0% vac · 8.0% maint · 8.0% mgmt
Financing live
Cash to close
- Down payment
- $17,475
- Closing costs
- $2,097
- Reserves months
- —
- Total cash needed
- —
Loan-product check · same deal, 3 products live
Conventional
25% down · 7.5% · 30yr
- Down + closing
- —
- Monthly P&I
- —
- Monthly cashflow
- —
- DSCR
- —
- Eligible?
- —
Personal DTI + credit; lowest rate.
DSCR
20% down · 8.5% · 30yr
- Down + closing
- —
- Monthly P&I
- —
- Monthly cashflow
- —
- DSCR
- —
- Eligible?
- —
No personal income docs; deal must DSCR.
Hard money
10% down · 12.0% · 12mo
- Down + closing
- —
- Monthly P&I
- —
- Monthly cashflow
- —
- DSCR
- —
- Eligible?
- —
Short-term bridge; refi at stabilization.
Listing history 30 events
-
2026-06-19days on market $69,900 Active 119 DOM
-
2026-06-18days on market $69,900 Active 118 DOM
-
2026-06-17days on market $69,900 Active 117 DOM
-
2026-06-16days on market $69,900 Active 116 DOM
-
2026-06-15days on market $69,900 Active 115 DOM
-
2026-06-14days on market $69,900 Active 113 DOM
-
2026-06-13days on market $69,900 Active 112 DOM
-
2026-06-10days on market $69,900 Active 110 DOM
-
2026-06-09days on market $69,900 Active 109 DOM
-
2026-06-08days on market $69,900 Active 108 DOM
-
2026-06-07days on market $69,900 Active 107 DOM
-
2026-06-05days on market $69,900 Active 104 DOM
-
2026-06-03days on market $69,900 Active 103 DOM
-
2026-06-02days on market $69,900 Active 102 DOM
-
2026-06-01days on market $69,900 Active 101 DOM
-
2026-05-31days on market $69,900 Active 100 DOM
-
2026-05-30days on market $69,900 Active 99 DOM
-
2026-05-13historical
-
2026-05-11historical
-
2026-04-28price $69,900
-
2026-04-28price $69,900
-
2026-04-28price $69,900
-
2026-03-20price $74,900
-
2026-03-20price $74,900
-
2026-03-20price $74,900
-
2026-02-20$79,900 Active
-
2026-02-18$79,900 Active
-
2026-02-18$79,900 Active
-
2026-02-17$79,900 Active
-
2026-02-16$79,900 New
ⓘ Source: listings_history table (triggers on properties + properties_extension) + one-shot
backfill from property_details.listing_events for pre-trigger history.
Tax reassessment forecast GA · Resets to sale price
- Current annual tax
- $1,880 · $157/mo
- Projected year-2 tax
- $1,880 · $157/mo
- Expected delta
- $0/yr ($0/mo · 0.0%)
ⓘ Screening estimate from a state-policy table — verify with the county assessor before closing.
Climate risk First Street
- Flood 1/10 Low FEMA zone X (unshaded) · 0% chance over 30 yrs
- Wildfire 5/10 Major
- Heat 7/10 Severe 7 d/yr ≥108°F today · 19 d/yr by 30 yrs out
- Wind 8/10 Severe 98% chance of damaging wind over 30 yrs
- Air quality 4/10 Moderate 5 unhealthy d/yr today · 6 by 30 yrs out
Nearby sold comps map
Loading sold comps map…
Walkable amenities ~0.75 mi
Loading nearby amenities…
Taxation est. · year 1
- Rental income
- $15,836
- − Mortgage interest
- −$3,915
- − Property taxes
- −$1,880
- − Insurance
- −$350
- − Repairs & maintenance
- −$1,267
- − Management
- −$1,267
- − Depreciation
- −$2,033
- Taxable income
- $5,124
- Est. tax owed @ 24.0%
- −$1,230
- After-tax cash flow
- $4,653/yr
For passive investors: Depreciation is non-cash, so a rental often shows a tax loss while cash-flowing — sheltering income. Rental losses are passive: they offset passive income freely, and up to $25,000/yr can offset ordinary (W-2) income if you actively participate and your MAGI is under $100k (phasing out to $0 by $150k); unused losses carry forward. On sale, claimed depreciation is recaptured at up to 25%, and gains may owe capital-gains tax (a 1031 exchange can defer both). Figures are a year-1 estimate at your 24.0% rate — not tax advice; consult a CPA.
Schools (NCES district)
- District
- Worth County
- NCES district ID
- 1305850
- Math proficiency
- 28% ▼ -5.00%
- Reading proficiency
- 34% ▼ -3.00%
- Median HH income
- $39,056
- Composite
- 25.97/100
- National rank
- #7327
- State rank
- #91 of 174 in GA
Livability — Sylvester
- Score
- 63/100
- State rank
- #287
- US rank
- #15795
Category grades
Schools grade is shown separately in the Schools card above.
Census & demographics
- Population (ZIP)
- 11,312
Population outlook (Worth County) Hauer SSP2
- Today (2025)
- 18,547 people
- By 2030
- 17,345 · -6.5%
- By 2040
- 14,978 · -19.2%
- By 2050
- 12,782 · -31.1%
- By 2075
- 8,832 · -52.4%
- By 2100
- 6,226 · -66.4%
Race, ethnicity, and origin ACS 2023
- Neighborhood character
- Majority White (57%)
- Race & ethnicity
- White 57% Black 35% Two or more races 6%
- Common ancestry
- Italian 2% Slovak 2% Lithuanian 1%
- Foreign-born
- 1%
Political lean MEDSL · Worth
- 2024 margin
- Solid R (+50.4) · D 24.7% · R 75.1%
- 2008→2024 swing
- -11.7pp toward R · 2008: -38.7pp · 2024: -50.4pp
- All cycles
- 2024: R+50.4 2020: R+47.8 2016: R+50.0 2012: R+40.2 2008: R+38.7
Not yet ingested
- Civics
- —
Market trends
- HPI YoY
- ▼ -48.96%
- Current HPI
- 185.9708
- Rent YoY
- —
- Metro
- —
- State GDP YoY
- ▲ 2.66%
- F500 in state
- 28
Industry mix (Fortune 500 HQ in GA)
| Industry | F500 HQs | Revenue |
|---|---|---|
| Paper / Packaging | 2 | $29B |
|
||
| Retail | 1 | $160B |
|
||
| Transportation / Logistics | 1 | $91B |
|
||
| Airlines | 1 | $62B |
|
||
| Consumer Goods | 1 | $47B |
|
||
| Utilities | 1 | $25B |
|
||
Price history
-12.5% since first listed13 events — show timeline
- 2026-05-13 Listing Removed — Hive MLS
- 2026-05-11 Listing Removed — Hive MLS
- 2026-04-28 Price Changed $69,900 MGMLS
- 2026-04-28 Price Changed $69,900 Hive MLS
- 2026-04-28 Price Changed $69,900 GAMLS
- 2026-03-20 Price Changed $74,900 MGMLS
- 2026-03-20 Price Changed $74,900 GAMLS
- 2026-03-20 Price Changed $74,900 Hive MLS
- 2026-02-20 Listed $79,900 Hive MLS
- 2026-02-18 Listed $79,900 Hive MLS
- 2026-02-18 Listed $79,900 MGMLS
- 2026-02-17 Listed $79,900 Hive MLS
- 2026-02-16 Listed $79,900 GAMLS
Property tax history
+8.2%/yrLatest (2025): $1,880 · +612.0% YoY. Source: county tax records.
Cash-flow waterfall
monthlySold comps — $/sqft
last 12 mo · ≤1 miLoading sold comps…