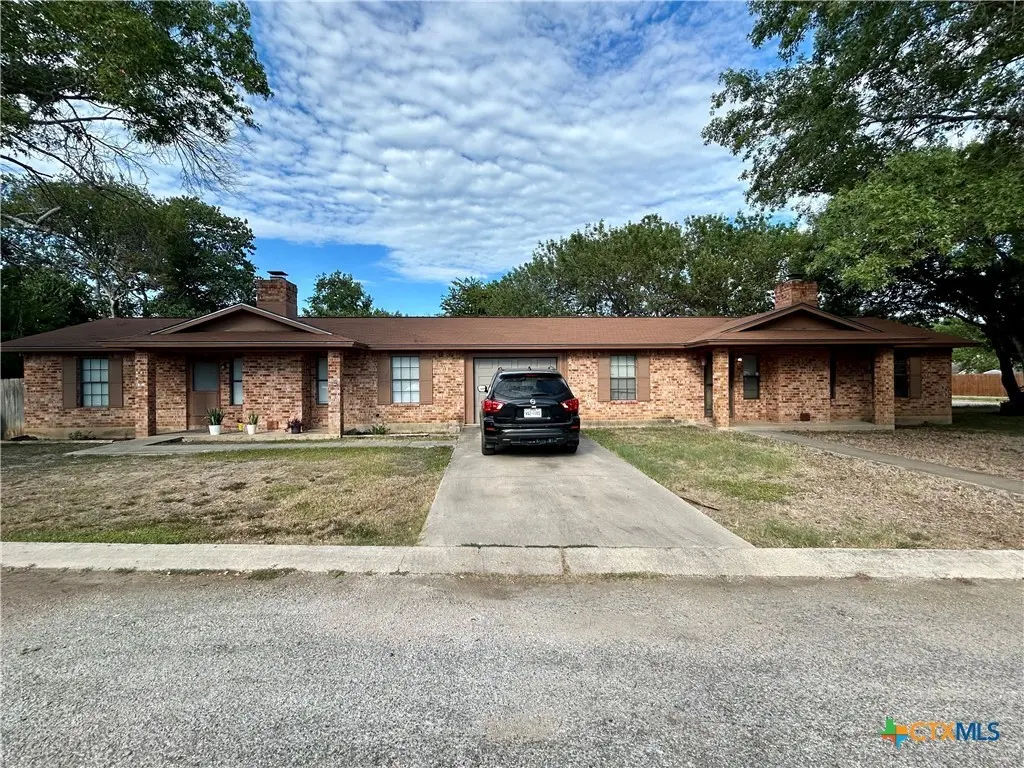
198 West St Unit A & B · New Braunfels, TX
Flood risk 1/10 · Minimal
- FEMA flood zone
- X (unshaded)
- Chance of flooding over 30 yrs
- 0.0%
- Est. flood insurance / yr
- $507 – $1,088
Fire risk 4/10 · Minor
- Est. fire insurance / yr
- $1,222 – $2,270
Heat risk 8/10 · Major
- Hot days now (above 108°F)
- 7 days/yr
- Hot days in 30 yrs
- 21 days/yr
Wind risk 8/10 · Major
- Chance of severe wind over 30 yrs
- 80.0%
Air-quality risk 1/10 · Minimal
- Unhealthy air days now
- 0 days/yr
- Unhealthy air days in 30 yrs
- 0 days/yr
Risk factors via First Street. Map © Google.
Why this score? — see what drove the F grade
The composite is a weighted blend of 9 inputs, each scored 0–100. Each bar is that input's sub-score; the figure is the points it added to the 100-point composite (weight × sub-score).
- ARV discount +8.2/15.0
- Schools +5.2/10.0
- Cash flow +4.2/30.0
- Livability +4.2/5.0
- Condition / age +2.5/5.0
- Rent growth +2.0/5.0
- 1% rule +0.3/10.0
- DSCR +0.0/10.0
- Appreciation +0.0/10.0
$345,000
🖨 Deal sheet 📄 Offer letter ✓ Due diligence
Listing remarks MLS
Duplex side one is a 2BD 2BA with a garage. Side two is a 3BD 2BA with no garage. It is in a nice neighborhood with large lots and trees. It is easy access to New Braunfels and Seguin. This is a great investor property, as both sides are currently rented.
Key facts
- Easy access
- Large lots
- Garage
Tags
Neighborhood map
What this means for you Summary
Snapshot
- This is a townhouse listed at $345k.
Deal economics
- At list price, monthly cash flow is $-935 ($-11k/yr) — negative.
- To cash-flow at today's rent, offer at most $180k (47.9% below list).
- To meet the 1% rule (rent ≥ 1% of price), the offer needs to be $182k (47.3% below list).
- Recommended offer: $180k (47.9% below list) — sets the bar for cash-flow.
Location & tenants
- Location reads 83/100 on livability (#9 in TX, #925 nationally) — a professional / high-income tenant draw. Strengths: amenities A+, housing A+, health & safety A+; Watch: commute F.
- Comal ISD (rural): math 57% / reading 59% proficiency, ranked #58 of 826 in TX (top 7%) — acceptable for families but not a draw, mixed tenant base, ~2y average lease.
- Market conditions: Rents soft (-2.0%/yr); 1896 active listings in the ZIP; 15 comparable units currently listed for rent nearby; rentals at typical pace (median 24d on market — plan ~3-4 weeks tenant-placement turnaround); 40% of comp listings sitting > 30 days — soft ceiling on asking rent; solid renter incomes; 2,064 units permitted in Guadalupe County in 2024 (133 in 5+ unit buildings).
Forward outlook
- Local home prices are declining (-3.0%/yr); year-one equity from $2k of loan paydown is wiped out by about $10k of value loss. Plan a longer hold.
- Guadalupe County population projected at +61% by 2050 — long-run rental-demand tailwind backs the buy-and-hold thesis.
Negotiation context
- It's been on market 254 days — a 12% lower offer ($304k) is reasonable based on typical stale-listing flexibility.
Risks & watch-outs
- Climate carrying-cost: severe wind risk, 80% chance of damaging wind over 30y; extreme-heat days projected 7→21/yr by 2055 (HVAC capex compounding) — expect insurance premiums to compound above CPI over the hold.
Questions for the listing agent
- What do current leases actually rent for vs. the listed asking? Can we see a recent rent roll and the last 12 months of T-12 income?
- It's been on market 254 days. Have you received any prior offers? Is the seller open to a 48% concession, seller financing, or rate buy-down credit?
- Why hasn't it sold? Are there any deal-killer items the seller is aware of (foundation, flood, title, zoning, code violations)?
- Is there a deadline driving the sale (1031 exchange, divorce, estate, relocation)? That informs how much negotiation room exists.
- Schools are B-rated — typically a magnet for longer-tenancy family renters. What's the average tenant stay here, and is there a school-zone premium baked into asking?
- The area grade is low — what's the realistic commute time and amenity access for the typical tenant pool here? Any planned neighborhood developments (good or bad) we should know about?
- What's the average days-on-market for RENTAL listings here right now (not sales)? A rising rental-DOM trend means longer vacancies and softer asking-rent achievability than the comps imply.
- What's the recent tenant-quality profile in this submarket — average credit score on applications, eviction rate, late-payment / NSF rate, and stable-employment percentage? A property-management company in the area should have these aggregated.
- How much new for-sale + rental construction is in the pipeline within 1–3 miles? Heavy new supply typically softens prices + rents 12–24 months out; constrained supply supports both.
Investment metrics
- 1% rule
- 0.53% ✗
- Cap rate
- 3.04%
- Cash-on-cash
- -11.62%
- DSCR
- 0.48
- GRM
- 15.8
CMA / ARV
- ARV (median comp)
- $350,439
- List price
- $345,000
- Delta
- -1.55%
- Verdict
- FAIR
- Comps
- 4 within 2.0 mi
Projected returns pro-forma
-3.0% appreciation · 0.0% rent growth · sell at horizon
- IRR
- -40.8%
- Equity multiple
- -0.25×
- Total profit
- $-120,787
- Equity at exit
- $51,441
- IRR
- -88.4%
- Equity multiple
- -1.10×
- Total profit
- $-202,411
- Equity at exit
- $29,829
Cash invested: $96,600 (down + closing). Projections, not guarantees.
Landlord ↔ Tenant lean methodology
- Overall (STATE)
- 87 Strongly Landlord-Friendly
- State Texas
- 87 Strongly Landlord-Friendly · R+5
- County
- — inherits STATE
- City
- — inherits STATE
ZIP-level market 78130
- Rents YoY
- -2.0%
- Active inventory
- 1896
- Price-to-rent
- 15.8×
Monthly cashflow live
- Estimated rent
- $1,820 high interval (Pro) →
- Mortgage (P&I)
- −$1,809
- Tax from tax record
- −$420 /mo · $5,039/yr
- Insurance
- −$144
- HOA
- −$0
- Vacancy / Maint / Mgmt
- −$382
- Net cashflow
- $-935
Break-even live
UW: 25.0% down · 7.5% · 30yr · 1.5% tax · 5.0% vac · 8.0% maint · 8.0% mgmt
Financing live
Cash to close
- Down payment
- $86,250
- Closing costs
- $10,350
- Reserves months
- —
- Total cash needed
- —
Loan-product check · same deal, 3 products live
Conventional
25% down · 7.5% · 30yr
- Down + closing
- —
- Monthly P&I
- —
- Monthly cashflow
- —
- DSCR
- —
- Eligible?
- —
Personal DTI + credit; lowest rate.
DSCR
20% down · 8.5% · 30yr
- Down + closing
- —
- Monthly P&I
- —
- Monthly cashflow
- —
- DSCR
- —
- Eligible?
- —
No personal income docs; deal must DSCR.
Hard money
10% down · 12.0% · 12mo
- Down + closing
- —
- Monthly P&I
- —
- Monthly cashflow
- —
- DSCR
- —
- Eligible?
- —
Short-term bridge; refi at stabilization.
Rent comps 15 comps
| Address | Beds | Baths | Sqft | Rent | $/sqft | DOM | Units | Dist |
|---|---|---|---|---|---|---|---|---|
| 121 Flora St New Braunfels, TX | 3.0 | 2.0 | 1696 | $2,000 | $1.18 | 43d | 1 | 0.27mi |
| 451 Forsythia New Braunfels, TX | 3.0 | 2.5 | 1837 | $1,695 | $0.92 | 43d | 1 | 0.47mi |
| 208 Texas Thistle New Braunfels, TX | 3.0 | 2.0 | 1680 | $1,750 | $1.04 | 17d | 1 | 0.52mi |
| 452 Lynwood Gold New Braunfels, TX | 3.0 | 2.0 | 2029 | $1,900 | $0.94 | 43d | 1 | 0.53mi |
| 440 Lynwood Gold New Braunfels, TX | 3.0 | 2.0 | 1688 | $1,700 | $1.01 | 12d | 1 | 0.54mi |
| 440 Lynwood Gold New Braunfels, TX | 3.0 | 2.0 | 1688 | $1,700 | $1.01 | 23d | 1 | 0.54mi |
| 409 Dakota Crk New Braunfels, TX | 3.0 | 2.5 | 2100 | $1,995 | $0.95 | 23d | 1 | 0.60mi |
| 426 Dakota Crk New Braunfels, TX | 3.0 | 2.5 | 2145 | $1,800 | $0.84 | 43d | 1 | 0.62mi |
| 518 Deer Crest Dr New Braunfels, TX | 3.0 | 2.0 | 2381 | $1,995 | $0.84 | 1d | 1 | 0.68mi |
| 513 Harvest Flds New Braunfels, TX | 3.0 | 2.5 | 2090 | $2,050 | $0.98 | 1d | 1 | 0.70mi |
| 418 Harvest Flds New Braunfels, TX | 3.0 | 2.0 | 2382 | $2,050 | $0.86 | 4d | 1 | 0.74mi |
| 1212 Treehouse Ln New Braunfels, TX | 3.0 | 2.0 | 1687 | $1,706 | $1.01 | 21d | 1 | 0.77mi |
| 1220 Treehouse Ln New Braunfels, TX | 3.0 | 2.0 | 2120 | $1,896 | $0.89 | 43d | 1 | 0.78mi |
| 2123 Dodge Dr New Braunfels, TX | 3.0 | 2.5 | 2243 | $2,020 | $0.90 | 3d | 1 | 0.97mi |
| 756 Guna Dr New Braunfels, TX | 3.0 | 2.5 | 1594 | $1,980 | $1.24 | 43d | 1 | 1.30mi |
Listing history 15 events
-
2026-06-18days on market $345,000 Active 254 DOM
-
2026-06-17days on market $345,000 Active 253 DOM
-
2026-06-16days on market $345,000 Active 252 DOM
-
2026-06-15days on market $345,000 Active 251 DOM
-
2026-06-13days on market $345,000 Active 249 DOM
-
2026-06-09days on market $345,000 Active 245 DOM
-
2026-06-08days on market $345,000 Active 244 DOM
-
2026-06-07days on market $345,000 Active 243 DOM
-
2026-06-04days on market $345,000 Active 240 DOM
-
2026-06-03days on market $345,000 Active 239 DOM
-
2026-06-02days on market $345,000 Active 238 DOM
-
2026-06-02days on market $345,000 Active 237 DOM
-
2026-05-31days on market $345,000 Active 236 DOM
-
2025-09-29$345,000 Active 255-char remark
Show marketing remark (255 chars)
Duplex side one is a 2BD 2BA with a garage. Side two is a 3BD 2BA with no garage. It is in a nice neighborhood with large lots and trees. It is easy access to New Braunfels and Seguin. This is a great investor property, as both sides are currently rented.
-
1992-06-02soldstatus
ⓘ Source: listings_history table (triggers on properties + properties_extension) + one-shot
backfill from property_details.listing_events for pre-trigger history.
Tax reassessment forecast TX · Resets to sale price
- Current annual tax
- $5,039 · $420/mo
- Projected year-2 tax
- $6,314 · $526/mo
- Expected delta
- +$1,274/yr (+$106/mo · 25.3%)
ⓘ Screening estimate from a state-policy table — verify with the county assessor before closing.
Climate risk First Street
- Flood 1/10 Low FEMA zone X (unshaded) · 0% chance over 30 yrs
- Wildfire 4/10 Moderate
- Heat 8/10 Severe 7 d/yr ≥108°F today · 21 d/yr by 30 yrs out
- Wind 8/10 Severe 80% chance of damaging wind over 30 yrs
- Air quality 1/10 Low 0 unhealthy d/yr today · 0 by 30 yrs out
Nearby sold comps map
Loading sold comps map…
Walkable amenities ~0.75 mi
Loading nearby amenities…
Taxation est. · year 1
- Rental income
- $21,837
- − Mortgage interest
- −$19,325
- − Property taxes
- −$5,039
- − Insurance
- −$1,725
- − Repairs & maintenance
- −$1,747
- − Management
- −$1,747
- − Depreciation
- −$10,036
- Taxable loss
- −$17,783
- Est. tax savings @ 24.0%
- +$4,268
- After-tax cash flow
- $-6,956/yr
For passive investors: Depreciation is non-cash, so a rental often shows a tax loss while cash-flowing — sheltering income. Rental losses are passive: they offset passive income freely, and up to $25,000/yr can offset ordinary (W-2) income if you actively participate and your MAGI is under $100k (phasing out to $0 by $150k); unused losses carry forward. On sale, claimed depreciation is recaptured at up to 25%, and gains may owe capital-gains tax (a 1031 exchange can defer both). Figures are a year-1 estimate at your 24.0% rate — not tax advice; consult a CPA.
Schools (NCES district)
- District
- Comal ISD
- NCES district ID
- 4814730
- Math proficiency
- 57% ▼ -9.00%
- Reading proficiency
- 59% ▼ -2.00%
- Median HH income
- $74,792
- Composite
- 51.79/100
- National rank
- #1671
- State rank
- #58 of 826 in TX
Livability — New Braunfels
- Score
- 83/100
- State rank
- #9
- US rank
- #925
Category grades
Schools grade is shown separately in the Schools card above.
Census & demographics
- County
- Comal County · 206,262 people
- City population
- 144,962
- Metro
- San Antonio-New Braunfels, TX
- Population (ZIP)
- 104,009
- Household income
- $83,064
- Rent vs Own
- Severe rent burden
- 2912.0
Population outlook (Guadalupe County) Hauer SSP2
- Today (2025)
- 196,854 people
- By 2030
- 220,210 · +11.9%
- By 2040
- 268,004 · +36.1%
- By 2050
- 316,333 · +60.7%
- By 2075
- 434,747 · +120.8%
- By 2100
- 520,447 · +164.4%
Race, ethnicity, and origin ACS 2023
- Neighborhood character
- Majority White (58%)
- Race & ethnicity
- White 58% Hispanic / Latino 37% Two or more races 19% Black 2%
- Hispanic origin (detail)
- Mexican 32%
- Common ancestry
- Romanian 2% Lithuanian 2% Slovak 2%
- Foreign-born
- 7% · Canada
- Languages at home
- 78% English-only · Spanish 20% German/W. Germanic 1%
Political lean MEDSL · Guadalupe
- 2024 margin
- Strong R (+29.5) · D 34.8% · R 64.3%
- 2008→2024 swing
- +1.5pp toward D · 2008: -31.0pp · 2024: -29.5pp
- All cycles
- 2024: R+29.5 2020: R+24.2 2016: R+31.8 2012: R+35.1 2008: R+31.0
Not yet ingested
- Civics
- —
Market trends
- HPI YoY
- ▼ -190.61%
- Current HPI
- 173.7128
- Rent YoY
- ▼ -1.97%
- Metro
- San Antonio-New Braunfels, TX
- State GDP YoY
- ▲ 3.95%
- F500 in state
- 110
Industry mix (Fortune 500 HQ in TX)
| Industry | F500 HQs | Revenue |
|---|---|---|
| Energy | 16 | $1,198B |
|
||
| Technology | 5 | $198B |
|
||
| Engineering / Construction | 4 | $72B |
|
||
| Energy Services | 3 | $60B |
|
||
| Utilities | 3 | $41B |
|
||
| Healthcare | 2 | $330B |
|
||
Price history
2 events — show timeline
- 2025-09-29 Listed $345,000 CTXMLS
- 1992-06-02 Sold (Public Records) — Public Records
Property tax history
+4.4%/yrLatest (2026): $5,039 · -1.5% YoY. Source: county tax records.
Cash-flow waterfall
monthlySold comps — $/sqft
last 12 mo · ≤1 miLoading sold comps…