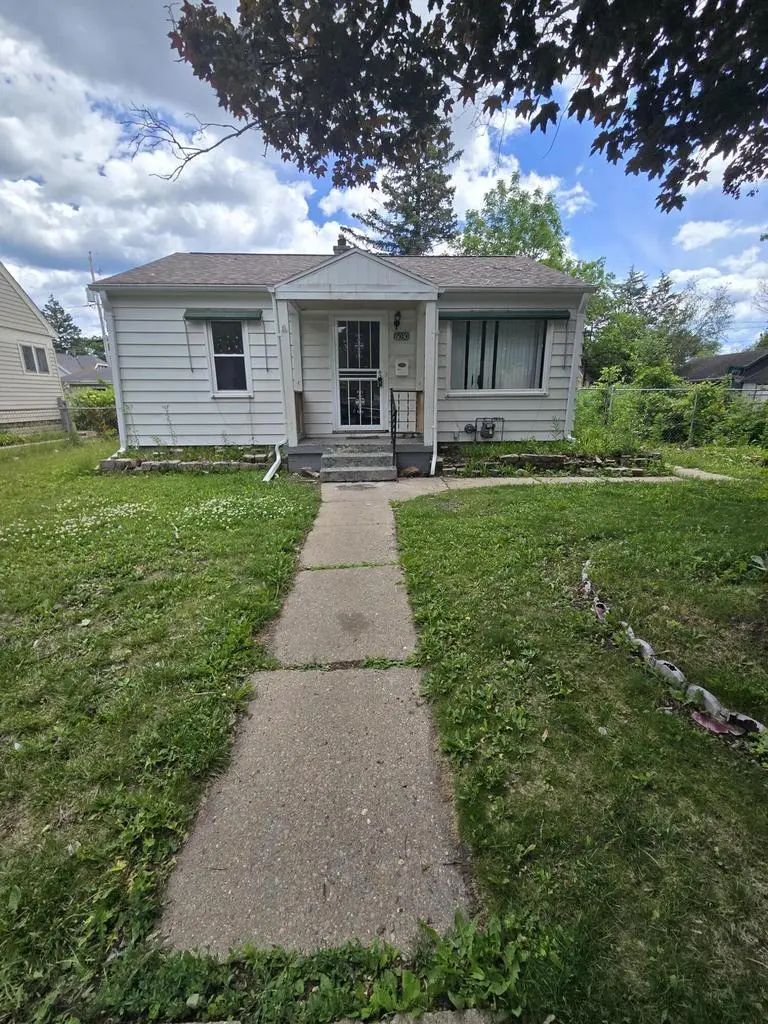
6030 N 36th St · Milwaukee, WI
Flood risk 1/10 · Minimal
- FEMA flood zone
- X (unshaded)
- Chance of flooding over 30 yrs
- 0.0%
- Est. flood insurance / yr
- $473 – $860
Fire risk 1/10 · Minimal
- Est. fire insurance / yr
- $636 – $1,182
Heat risk 2/10 · Minimal
- Hot days now (above 98°F)
- 7 days/yr
- Hot days in 30 yrs
- 13 days/yr
Wind risk 2/10 · Minimal
- Chance of severe wind over 30 yrs
- —
Air-quality risk 2/10 · Minimal
- Unhealthy air days now
- 2 days/yr
- Unhealthy air days in 30 yrs
- 2 days/yr
Risk factors via First Street. Map © Google.
Why this score? — see what drove the C- grade
The composite is a weighted blend of 9 inputs, each scored 0–100. Each bar is that input's sub-score; the figure is the points it added to the 100-point composite (weight × sub-score).
- Cash flow +22.2/30.0
- DSCR +7.1/10.0
- 1% rule +7.0/10.0
- Rent growth +4.7/5.0
- Livability +4.0/5.0
- ARV discount +3.5/15.0
- Condition / age +2.5/5.0
- Schools +1.2/10.0
- Appreciation +0.0/10.0
$118,000
🖨 Deal sheet 📄 Offer letter ✓ Due diligence
Listing remarks MLS
Dont miss out on this Truly Wonderful Opportunity to own a Completely Updated home. Walk in and appreciate the Brand New Kitchen, Gleaming Hardwood Floors, Updated Bathroom Fixtures, Updated Electrical Service. All this on a Spacious Oversized Lot! Add a Garage & Carport and you have a Careful Buyers Dream! Hurry!!
Key facts
- 7,405 sq ft lot
- Garage
- Built 1950
Property features AI
Finance
- Other: Appliances included: refrigerator, stove, washer and dryer
Exterior
- Parking: Detached 1-car garage; Carport
- Utilities: Municipal water; Municipal sewer; Natural gas
- Home design: Single-family, 1-story home; Lot approximately 0.17 acres (less than 1/2 acre); Subdivision: Fairfield; Zoning: RS6
- Construction: Aluminum / Aluminum or steel exterior
- Exterior features: Fenced yard; Sidewalks
Interior
- Kitchen: Kitchen on the main level, 9 x 13; Includes oven/range and refrigerator
- Bedrooms: Master bedroom on the main level, 10 x 12; Second bedroom on the main level, 8 x 10
- Bathrooms: One full bath with tub and shower over tub
- Heating & cooling: Forced air heating (natural gas)
- Interior features: Full basement; Living room (main level) measuring 14 x 15
- Laundry & utility: Washer and dryer included
Neighborhood map
What this means for you Summary
Snapshot
- This is a 2-bed/1.0-bath single-family listed at $118k.
Deal economics
- At list price, monthly cash flow is $192 ($2k/yr) — positive.
- The deal already cash-flows at list — no discount required.
- Meets the 1% rule at list price ($1k rent vs $118k).
- Cap rate 8.2% vs local median 5.1% in Milwaukee — top-decile yield for the area; either an underpriced asset or a hidden risk that comps aren't pricing in. Stress-test before assuming the spread holds.
Location & tenants
- Location reads 81/100 on livability (#55 in WI, #1,534 nationally) — a professional / high-income tenant draw. Strengths: amenities A+, commute A+, cost of living A+; Watch: employment D+, crime F.
- Milwaukee School District (urban): math 10% / reading 18% proficiency, ranked #337 of 342 in WI (top 98%) — low school quality limits family demand, transient renter base, plan for 1-2y turnover; 77% free/reduced lunch — lower-income household profile, screen leases tightly.
- Zoned schools: Thurston Woods Elementary (math 2% / reading 2%, grade F, #1,024 of 1,041 statewide, top 100%, 355 students, 94% FRL) — zoned schools average 94% FRL vs 77% district-wide (17 pts higher); higher-poverty schools than district average — tighter screening recommended.
- Market conditions: Rents rising fast (+8.6%/yr); 168 active listings in the ZIP; 2 comparable units currently listed for rent nearby; 1,017 units permitted in Milwaukee County in 2024 (803 in 5+ unit buildings).
- This rent runs 35% of the median local income ($48k/yr) — at the standard rent-burdened threshold; future hikes will face affordability resistance.
Forward outlook
- Local home prices are declining (-3.0%/yr); year-one equity from $816 of loan paydown is wiped out by about $4k of value loss. Plan a longer hold.
- Milwaukee County population projected at +4% by 2050 — modest demand growth; plan on rents tracking national, not racing it.
- At projected returns (-3.0% appreciation + 8.0% rent growth), your $33k cash investment doubles in ~8 years — after that, you're playing with house money.
Negotiation context
- Only 3 days on market — expect competitive offers; lowballing is unlikely to land.
- Current owner paid $74k; list at $118k implies a 58% gain — meaningful room to come down on a strong offer.
Risks & watch-outs
- Watch-outs: property tax is 2.6% of price; built in 1950 — expect roof / HVAC / electrical / plumbing capex.
Questions for the listing agent
- Built in 1950 — when were the roof, HVAC, electrical panel, plumbing, and water heater last replaced?
- Property tax is high relative to price — has the assessment been appealed recently, and will the sale trigger a re-assessment?
- Is there a deadline driving the sale (1031 exchange, divorce, estate, relocation)? That informs how much negotiation room exists.
- Schools are F-rated, which usually means shorter tenancies and higher turnover. Who's the typical renter profile here, and what's been the actual vacancy rate?
- Crime grade is F in this area — have there been break-ins, vandalism, or insurance claims at this property in the last 3 years? What carrier currently insures it and at what premium?
- What's the average days-on-market for RENTAL listings here right now (not sales)? A rising rental-DOM trend means longer vacancies and softer asking-rent achievability than the comps imply.
- What's the recent tenant-quality profile in this submarket — average credit score on applications, eviction rate, late-payment / NSF rate, and stable-employment percentage? A property-management company in the area should have these aggregated.
- How much new for-sale + rental construction is in the pipeline within 1–3 miles? Heavy new supply typically softens prices + rents 12–24 months out; constrained supply supports both.
Investment metrics
- 1% rule
- 1.20% ✓
- Cap rate
- 8.24%
- Cash-on-cash
- 6.97%
- DSCR
- 1.31
- GRM
- 7.0
CMA / ARV
- ARV (on-the-fly)
- $108,267
- Comps found
- 12
Show comp detail 12 sales within ~0.75 mi
| Address | Dist | Beds/Ba | Sqft | Sold | Price | $/sf | Match |
|---|---|---|---|---|---|---|---|
| 5908 N 32nd St | 0.27mi | 2/1.0 | 720 (+0%) | 1mo | $134,900 | $187 | 85 |
| 6110 N 39th St | 0.22mi | 2/1.0 | 698 (-3%) | 1mo | $76,000 | $109 | 84 |
| 3805 W Kaul Ave | 0.18mi | 2/1.0 | 747 (+4%) | 11mo | $109,900 | $147 | 76 |
| 6115 N 37th St | 0.15mi | 2/1.0 | 676 (-6%) | 14mo | $102,000 | $151 | 72 |
| 5846 N 41st St | 0.39mi | 2/1.0 | 720 (+0%) | 14mo | $50,000 | $69 | 69 |
| 3819 W Douglas Ave | 0.30mi | 2/1.0 | 672 (-6%) | 8mo | $92,000 | $137 | 69 |
| 5915 N 38th St | 0.22mi | 3/1.0 (+1) | 782 (+9%) | 6mo | $65,000 | $83 | 65 |
| 4228 W Newton Pl | 0.55mi | 2/1.0 | 672 (-6%) | 3mo | $53,000 | $79 | 62 |
| 5528 N 32nd St | 0.69mi | 2/1.0 | 748 (+4%) | 8mo | $115,000 | $154 | 54 |
| 5519 N 35th St | 0.66mi | 2/1.0 | 713 (-1%) | 17mo | $114,900 | $161 | 54 |
| 5738 N 38th St | 0.37mi | 2/1.0 | 820 (+14%) | 6mo | $157,000 | $191 | 54 |
| 4222 W Thurston Ave | 0.58mi | 2/1.0 | 781 (+9%) | 12mo | $146,500 | $188 | 48 |
Match score weights: distance 35% · size 25% · config 20% · recency 20%. Top-matched comps best support the ARV.
Projected returns pro-forma
-3.0% appreciation · 8.0% rent growth · sell at horizon
- IRR
- 0.5%
- Equity multiple
- 1.02×
- Total profit
- $650
- Equity at exit
- $17,594
- IRR
- 15.1%
- Equity multiple
- 2.53×
- Total profit
- $50,621
- Equity at exit
- $10,202
Cash invested: $33,040 (down + closing). Projections, not guarantees.
Landlord ↔ Tenant lean methodology
- Overall (STATE)
- 73 Landlord-Friendly
- State Wisconsin
- 73 Landlord-Friendly · R+2
- County
- — inherits STATE
- City
- — inherits STATE
ZIP-level market 53209
- Rents YoY
- 8.6%
- Active inventory
- 168
- Price-to-rent
- 7.0×
Monthly cashflow live
- Estimated rent
- $1,412 medium interval (Pro) →
- Mortgage (P&I)
- −$619
- Tax from tax record
- −$256 /mo · $3,067/yr
- Insurance
- −$49
- HOA
- −$0
- Vacancy / Maint / Mgmt
- −$297
- Net cashflow
- $192
Break-even live
UW: 25.0% down · 7.5% · 30yr · 1.5% tax · 5.0% vac · 8.0% maint · 8.0% mgmt
Financing live
Cash to close
- Down payment
- $29,500
- Closing costs
- $3,540
- Reserves months
- —
- Total cash needed
- —
Loan-product check · same deal, 3 products live
Conventional
25% down · 7.5% · 30yr
- Down + closing
- —
- Monthly P&I
- —
- Monthly cashflow
- —
- DSCR
- —
- Eligible?
- —
Personal DTI + credit; lowest rate.
DSCR
20% down · 8.5% · 30yr
- Down + closing
- —
- Monthly P&I
- —
- Monthly cashflow
- —
- DSCR
- —
- Eligible?
- —
No personal income docs; deal must DSCR.
Hard money
10% down · 12.0% · 12mo
- Down + closing
- —
- Monthly P&I
- —
- Monthly cashflow
- —
- DSCR
- —
- Eligible?
- —
Short-term bridge; refi at stabilization.
Rent comps 2 comps
| Address | Beds | Baths | Sqft | Rent | $/sqft | DOM | Units | Dist |
|---|---|---|---|---|---|---|---|---|
| 6110 N 39th St Milwaukee, WI | 2.0 | 1.0 | 703 | $1,395 | $1.98 | 4d | 1 | 0.24mi |
| 6600 N Sidney Pl Glendale, WI | 1.0–2.0 | 1.0 | 800 | $1,587 | $1.98 | 3d | 13 | 0.89mi |
Listing history 4 events
-
2026-06-18days on market $118,000 Active 3 DOM
-
2026-06-17days on market $118,000 Active 2 DOM
-
2026-06-16remarks 181-char remark
-
2026-06-16$118,000 Active 1 DOM
ⓘ Source: listings_history table (triggers on properties + properties_extension) + one-shot
backfill from property_details.listing_events for pre-trigger history.
Tax reassessment forecast WI · Partial reset (capped growth)
- Current annual tax
- $3,067 · $256/mo
- Projected year-2 tax
- $3,067 · $256/mo
- Expected delta
- $0/yr ($0/mo · 0.0%)
ⓘ Screening estimate from a state-policy table — verify with the county assessor before closing.
Climate risk First Street
- Flood 1/10 Low FEMA zone X (unshaded) · 0% chance over 30 yrs
- Wildfire 1/10 Low
- Heat 2/10 Low 7 d/yr ≥98°F today · 13 d/yr by 30 yrs out
- Wind 2/10 Low
- Air quality 2/10 Low 2 unhealthy d/yr today · 2 by 30 yrs out
Nearby sold comps map
Loading sold comps map…
Walkable amenities ~0.75 mi
Loading nearby amenities…
Taxation est. · year 1
- Rental income
- $16,944
- − Mortgage interest
- −$6,610
- − Property taxes
- −$3,067
- − Insurance
- −$590
- − Repairs & maintenance
- −$1,355
- − Management
- −$1,355
- − Depreciation
- −$3,433
- Taxable income
- $533
- Est. tax owed @ 24.0%
- −$128
- After-tax cash flow
- $2,175/yr
For passive investors: Depreciation is non-cash, so a rental often shows a tax loss while cash-flowing — sheltering income. Rental losses are passive: they offset passive income freely, and up to $25,000/yr can offset ordinary (W-2) income if you actively participate and your MAGI is under $100k (phasing out to $0 by $150k); unused losses carry forward. On sale, claimed depreciation is recaptured at up to 25%, and gains may owe capital-gains tax (a 1031 exchange can defer both). Figures are a year-1 estimate at your 24.0% rate — not tax advice; consult a CPA.
Schools (NCES district)
- District
- Milwaukee School District
- NCES district ID
- 5509600
- Math proficiency
- 10% ▼ -5.00%
- Reading proficiency
- 18% ▬ 0.00%
- Median HH income
- $36,339
- Composite
- 11.61/100
- National rank
- #9696
- State rank
- #337 of 342 in WI
Livability — Milwaukee
- Score
- 81/100
- State rank
- #55
- US rank
- #1534
Category grades
Schools grade is shown separately in the Schools card above.
Census & demographics
- Census place
- Milwaukee, WI
- County
- Milwaukee County · 926,379 people
- City population
- 573,768
- Metro
- Milwaukee-Waukesha, WI
- Population (ZIP)
- 45,170
- Household income
- $48,486
- Rent vs Own
- Severe rent burden
- 3390.0
Population outlook (Milwaukee County) Hauer SSP2
- Today (2025)
- 995,758 people
- By 2030
- 1,009,124 · +1.3%
- By 2040
- 1,028,128 · +3.3%
- By 2050
- 1,040,066 · +4.4%
- By 2075
- 1,057,849 · +6.2%
- By 2100
- 1,039,774 · +4.4%
Race, ethnicity, and origin ACS 2023
- Neighborhood character
- Predominantly Black (66%)
- Race & ethnicity
- Black 66% White 22% Hispanic / Latino 5% Two or more races 5% Asian 2%
- Hispanic origin (detail)
- Mexican 2% Puerto Rican 3%
- Common ancestry
- Romanian 3% Portuguese 1% Iranian 1%
- Foreign-born
- 3% · Canada
- Languages at home
- 92% English-only · Spanish 4% Other Asian/Pacific 1% Russian/Polish/Slavic 1%
Political lean MEDSL · Milwaukee
- 2024 margin
- Solid D (+38.5) · D 68.3% · R 29.8% · Other 1.8%
- 2008→2024 swing
- +2.7pp toward D · 2008: 35.9pp · 2024: 38.5pp
- All cycles
- 2024: D+38.5 2020: D+39.9 2016: D+37.5 2012: D+34.6 2008: D+35.9
Not yet ingested
- Civics
- —
Market trends
- HPI YoY
- ▼ -194.98%
- Current HPI
- 172.4275
- Rent YoY
- ▲ 8.61%
- Metro
- Milwaukee-Waukesha, WI
- State GDP YoY
- ▲ 2.10%
- F500 in state
- 20
Industry mix (Fortune 500 HQ in WI)
| Industry | F500 HQs | Revenue |
|---|---|---|
| Industrial Machinery | 4 | $23B |
|
||
| Industrial Technology | 2 | $36B |
|
||
| Insurance | 1 | $36B |
|
||
| Professional Services | 1 | $19B |
|
||
| Utilities | 1 | $9B |
|
||
| Consumer Goods | 1 | $3B |
|
||
Price history
+58.4% since first listed3 events — show timeline
- 2026-06-15 Listed $118,000 METROMLS
- 2006-04-19 Sold (Public Records) $74,500 Public Records
- 2006-03-10 Sold (MLS) $74,500 METROMLS
Property tax history
+2.5%/yrLatest (2024): $3,067 · +56.1% YoY. Source: county tax records.
Cash-flow waterfall
monthlySold comps — $/sqft
last 12 mo · ≤1 miLoading sold comps…