1100 Sant Charles Pl #207 · Pembroke Pines, FL
Flood risk 1/10 · Minimal
- FEMA flood zone
- X (shaded)
- Chance of flooding over 30 yrs
- 0.0%
- Est. flood insurance / yr
- $507 – $1,088
Fire risk 1/10 · Minimal
- Est. fire insurance / yr
- $947 – $1,759
Heat risk 10/10 · Severe
- Hot days now (above 105°F)
- 7 days/yr
- Hot days in 30 yrs
- 28 days/yr
Wind risk 10/10 · Severe
- Chance of severe wind over 30 yrs
- 99.0%
Air-quality risk 2/10 · Minimal
- Unhealthy air days now
- 2 days/yr
- Unhealthy air days in 30 yrs
- 2 days/yr
Risk factors via First Street. Map © Google.
Why this score? — see what drove the C+ grade
The composite is a weighted blend of 9 inputs, each scored 0–100. Each bar is that input's sub-score; the figure is the points it added to the 100-point composite (weight × sub-score).
- Cash flow +25.0/30.0
- 1% rule +10.0/10.0
- DSCR +8.1/10.0
- ARV discount +7.5/15.0
- Livability +4.2/5.0
- Schools +4.1/10.0
- Rent growth +2.9/5.0
- Condition / age +2.5/5.0
- Appreciation +0.0/10.0
$130,000
🖨 Deal sheet 📄 Offer letter ✓ Due diligence
Listing remarks
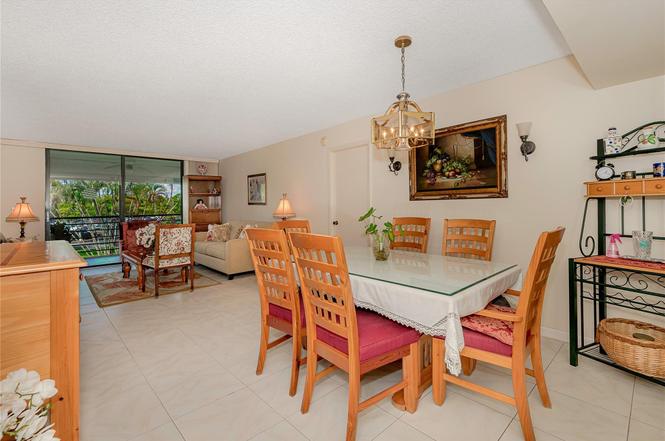
Outstanding 2 bedroom 2 bath apt. in nice condition overlooking garden area and Golf Course Park Place offers the Best value for your money in Pembroke Pines ! Only 6 buildings all with interior hallways and secure lobbies. Residents can enjoy an active lifestyle which includes 4 heated pools, tennis, pickleball, new park, with a barbecue, jogging/walking paths, active clubhouse with exercise equipment, billiard tables, shows and movies. All of this within a Guard Gated secure community with all of the conveniences only minutes away including shopping, Mall, transportation, hospital, banks and restaurants. Don't miss the opportunity to call this apt your new home! Park Place is a 55+ com
Key facts
- Active clubhouse
- Exercise equipment
- Billiard tables
Tags
Property features AI
Finance
- Other: Not waterfront; Resale property
- HOA & community: Monthly HOA with amenities; Association amenities include pool, clubhouse, community room, billiard room, basketball court, pickleball courts, jogging path, picnic area, courtesy bus, trash chute, maintenance; HOA covers insurance, grounds and structure maintenance, pest control, common areas, hot water, reserve funds, recreation facility maintenance, and pool service; This is a senior community
Exterior
- Parking: Guest parking
- Security: Security guard; Security fence; Security system
- Utilities: Has heating and cooling; Hot water provided through association
- Home design: Condominium; First-floor entry; 8-story building
- Construction: Block construction
- Exterior features: Patio; Fenced
Interior
- Kitchen: Dishwasher; Electric range; Microwave; Refrigerator; Garbage disposal; Electric water heater
- Bedrooms: 2 bedrooms on the main level
- Flooring: Tile
- Bathrooms: 2 full bathrooms on the main level
- Heating & cooling: Central electric heating; Central electric cooling
- Interior features: Walk-in closets; Split bedroom layout
- Laundry & utility: Hot water included in association amenities
Neighborhood map
What this means for you Summary
Snapshot
- This is a 2-bed/2.0-bath condo listed at $130k.
Deal economics
- At list price, monthly cash flow is $282 ($3k/yr) — positive.
- The deal already cash-flows at list — no discount required.
- Meets the 1% rule at list price ($2k rent vs $130k).
- Recommended offer: $118k (9.0% below list) — sets the bar for market timing.
- Cap rate 8.9% vs local median 4.0% in Pembroke Pines — top-decile yield for the area; either an underpriced asset or a hidden risk that comps aren't pricing in. Stress-test before assuming the spread holds.
Location & tenants
- Location reads 83/100 on livability (#54 in FL, #933 nationally) — a professional / high-income tenant draw. Strengths: housing A+, health & safety A+, crime A-; Watch: amenities D+, cost of living D+.
- Broward (suburban): math 42% / reading 53% proficiency, ranked #46 of 73 in FL (top 63%) — families likely to look elsewhere, expect single-tenant / working-renter base with shorter leases.
- Zoned schools: Pembroke Lakes Elementary School (math 62% / reading 73%, grade B+, #435 of 2,144 statewide, top 21%, 657 students, 51% FRL); Walter C. Young Middle School (math 49% / reading 62%, grade B-, #178 of 571 statewide, top 31%, 873 students, 56% FRL); Charles W Flanagan High School (math 29% / reading 50%, grade F, #304 of 667 statewide, top 47%, 2,475 students, 57% FRL) — zoned schools at 55% FRL track the district average.
- Market conditions: Rents rising (+1.6%/yr); 222 active listings in the ZIP; 40 comparable units currently listed for rent nearby; rentals at typical pace (median 22d on market — plan ~3-4 weeks tenant-placement turnaround); solid renter incomes; 2,111 units permitted in Broward County in 2024 (1,265 in 5+ unit buildings).
- This rent runs 30% of the median local income ($89k/yr) — at the standard rent-burdened threshold; future hikes will face affordability resistance.
Forward outlook
- Local home prices are declining (-3.0%/yr); year-one equity from $899 of loan paydown is wiped out by about $4k of value loss. Plan a longer hold.
- Broward County population projected at +34% by 2050 — long-run rental-demand tailwind backs the buy-and-hold thesis.
Negotiation context
- It's been on market 99 days — a 9% lower offer ($118k) is reasonable based on typical stale-listing flexibility.
Risks & watch-outs
- Watch-outs: HOA is 31% of rent.
- Climate carrying-cost: severe wind risk, 99% chance of damaging wind over 30y; extreme-heat days projected 7→28/yr by 2055 (HVAC capex compounding) — expect insurance premiums to compound above CPI over the hold.
Questions for the listing agent
- It's been on market 99 days. Have you received any prior offers? Is the seller open to a 9% concession, seller financing, or rate buy-down credit?
- What does the HOA fee cover, when was the last increase, and are there any pending special assessments or reserve-fund shortfalls?
- Any open or pending special assessments — roof, HVAC, plumbing, elevator, façade? What's the per-unit balance and payoff schedule, and is the seller paying it off at close or rolling it to the buyer?
- Why hasn't it sold? Are there any deal-killer items the seller is aware of (foundation, flood, title, zoning, code violations)?
- Is there a deadline driving the sale (1031 exchange, divorce, estate, relocation)? That informs how much negotiation room exists.
- Schools are A-rated — typically a magnet for longer-tenancy family renters. What's the average tenant stay here, and is there a school-zone premium baked into asking?
- What's the average days-on-market for RENTAL listings here right now (not sales)? A rising rental-DOM trend means longer vacancies and softer asking-rent achievability than the comps imply.
- What's the recent tenant-quality profile in this submarket — average credit score on applications, eviction rate, late-payment / NSF rate, and stable-employment percentage? A property-management company in the area should have these aggregated.
- How much new apartment / multifamily construction is in the pipeline within 1–3 miles? Heavy new supply (>2% of stock underway) typically softens rents 12–24 months out; light construction supports rent growth.
Investment metrics
- 1% rule
- 1.72% ✓
- Cap rate
- 8.90%
- Cash-on-cash
- 9.30%
- DSCR
- 1.41
- GRM
- 4.8
CMA / ARV
No comps found within radius.
Projected returns pro-forma
-3.0% appreciation · 1.58% rent growth · sell at horizon
- IRR
- -4.4%
- Equity multiple
- 0.84×
- Total profit
- $-5,858
- Equity at exit
- $19,383
- IRR
- 2.9%
- Equity multiple
- 1.19×
- Total profit
- $7,058
- Equity at exit
- $11,240
Cash invested: $36,400 (down + closing). Projections, not guarantees.
Landlord ↔ Tenant lean methodology
- Overall (STATE)
- 87 Strongly Landlord-Friendly
- State Florida
- 87 Strongly Landlord-Friendly · R+3
- County
- — inherits STATE
- City
- — inherits STATE
ZIP-level market 33026
- Rents YoY
- 1.6%
- Active inventory
- 222
- Price-to-rent
- 4.8×
Monthly cashflow live
- Estimated rent
- $2,241 high interval (Pro) →
- Mortgage (P&I)
- −$682
- Tax from tax record
- −$49 /mo · $588/yr
- Insurance
- −$54
- HOA
- −$703
- Vacancy / Maint / Mgmt
- −$471
- Net cashflow
- $282
Break-even live
UW: 25.0% down · 7.5% · 30yr · 1.5% tax · 5.0% vac · 8.0% maint · 8.0% mgmt
Financing live
Cash to close
- Down payment
- $32,500
- Closing costs
- $3,900
- Reserves months
- —
- Total cash needed
- —
Loan-product check · same deal, 3 products live
Conventional
25% down · 7.5% · 30yr
- Down + closing
- —
- Monthly P&I
- —
- Monthly cashflow
- —
- DSCR
- —
- Eligible?
- —
Personal DTI + credit; lowest rate.
DSCR
20% down · 8.5% · 30yr
- Down + closing
- —
- Monthly P&I
- —
- Monthly cashflow
- —
- DSCR
- —
- Eligible?
- —
No personal income docs; deal must DSCR.
Hard money
10% down · 12.0% · 12mo
- Down + closing
- —
- Monthly P&I
- —
- Monthly cashflow
- —
- DSCR
- —
- Eligible?
- —
Short-term bridge; refi at stabilization.
Rent comps 40 comps
| Address | Beds | Baths | Sqft | Rent | $/sqft | DOM | Units | Dist |
|---|---|---|---|---|---|---|---|---|
| 1100 Saint Charles Pl #606 Pembroke Pines, FL | 1.0 | 1.5 | 780 | $1,700 | $2.18 | 24d | 1 | 0.03mi |
| 1100 Saint Charles Pl #620 Pembroke Pines, FL | 1.0 | 1.5 | 740 | $1,750 | $2.36 | 24d | 1 | 0.03mi |
| 1100 Saint Charles Pl #606 Pembroke Pines, FL | 1.0 | 1.5 | 780 | $1,700 | $2.18 | 3d | 1 | 0.03mi |
| 1100 Saint Charles Pl Pembroke Pines, FL | 2.0 | 2.0 | 1100 | $2,000 | $1.82 | 24d | 1 | 0.05mi |
| 1200 Saint Charles Pl #606 Pembroke Pines, FL | 1.0 | 1.5 | 780 | $1,600 | $2.05 | 21d | 1 | 0.10mi |
| 10329 NW 11th St #201 Pembroke Pines, FL | 2.0 | 2.0 | 806 | $2,100 | $2.61 | 24d | 1 | 0.16mi |
| 785 NW 103rd Ter #202 Pembroke Pines, FL | 2.0 | 2.0 | 914 | $2,100 | $2.30 | 10d | 1 | 0.17mi |
| 785 NW 103rd Ter #202 Pembroke Pines, FL | 2.0 | 2.0 | 914 | $2,100 | $2.30 | 4d | 1 | 0.17mi |
| 900 Saint Charles Pl #708 Pembroke Pines, FL | 2.0 | 2.0 | 1100 | $1,999 | $1.82 | 3d | 1 | 0.19mi |
| 900 Saint Charles Pl #708 Pembroke Pines, FL | 2.0 | 2.0 | 1100 | $1,999 | $1.82 | 2d | 1 | 0.19mi |
| 10408 NW 8th St Pembroke Pines, FL | 2.0 | 2.0 | 932 | $2,100 | $2.25 | 24d | 1 | 0.21mi |
| 10409 NW 11th St Pembroke Pines, FL | 2.0 | 2.0 | 806 | $2,000 | $2.48 | 24d | 1 | 0.22mi |
| 716 NW 103rd Ter #203 Pembroke Pines, FL | 2.0 | 2.0 | 932 | $2,200 | $2.36 | 24d | 1 | 0.22mi |
| 940 NW 104th Ave #203 Pembroke Pines, FL | 2.0 | 2.0 | 806 | $2,100 | $2.61 | 7d | 1 | 0.23mi |
| 10468 NW 10th St #204 Pembroke Pines, FL | 2.0 | 2.0 | 806 | $2,150 | $2.67 | 24d | 1 | 0.26mi |
| 1400 Saint Charles Pl #608 Pembroke Pines, FL | 2.0 | 2.0 | 1100 | $1,900 | $1.73 | 15d | 1 | 0.27mi |
| 1400 Saint Charles Pl #323 Pembroke Pines, FL | 2.0 | 2.0 | 1070 | $2,400 | $2.24 | 24d | 1 | 0.27mi |
| 1400 Saint Charles Pl #701 Pembroke Pines, FL | 2.0 | 2.0 | 1100 | $2,000 | $1.82 | 2d | 1 | 0.27mi |
| 1400 Saint Charles Pl #713 Pembroke Pines, FL | 2.0 | 2.0 | 1260 | $2,000 | $1.59 | 16d | 1 | 0.27mi |
| 1400 Saint Charles Pl #323 Pembroke Pines, FL | 2.0 | 2.0 | 1070 | $2,350 | $2.20 | 7d | 1 | 0.27mi |
| 1400 Saint Charles Pl #314 Pembroke Pines, FL | 1.0 | 1.5 | 740 | $1,800 | $2.43 | 24d | 1 | 0.27mi |
| 565 NW 100th Pl #203 Pembroke Pines, FL | 2.0 | 2.0 | 754 | $2,050 | $2.72 | 24d | 1 | 0.28mi |
| 551 NW 100th Pl #101 Pembroke Pines, FL | 2.0 | 2.0 | 754 | $2,500 | $3.32 | 24d | 1 | 0.28mi |
| 561 NW 100th Pl #201 Pembroke Pines, FL | 2.0 | 2.0 | 754 | $2,100 | $2.79 | 15d | 1 | 0.28mi |
| 561 NW 100th Pl #201 Pembroke Pines, FL | 2.0 | 2.0 | 754 | $2,150 | $2.85 | 24d | 1 | 0.28mi |
| 741 NW 105th Ter Pembroke Pines, FL | 2.0 | 2.5 | 1224 | $2,650 | $2.17 | 13d | 1 | 0.30mi |
| 1148 NW 106th Ter Pembroke Pines, FL | 2.0 | 2.0 | 806 | $2,500 | $3.10 | 24d | 1 | 0.30mi |
| 10050 NW 6th St #202 Pembroke Pines, FL | 2.0 | 2.0 | 754 | $2,150 | $2.85 | 11d | 1 | 0.31mi |
| 10050 NW 6th St #202 Pembroke Pines, FL | 2.0 | 2.0 | 754 | $2,150 | $2.85 | 1d | 1 | 0.31mi |
| 10613 NW 11th St #205 Pembroke Pines, FL | 2.0 | 2.0 | 806 | $2,100 | $2.61 | 24d | 1 | 0.31mi |
| 10633 NW 10th St #102 Pembroke Pines, FL | 2.0 | 2.0 | 806 | $2,200 | $2.73 | 10d | 1 | 0.33mi |
| 10633 NW 10th St #102 Pembroke Pines, FL | 2.0 | 2.0 | 806 | $2,200 | $2.73 | 24d | 1 | 0.33mi |
| 10616 NW 10th St #104 Pembroke Pines, FL | 2.0 | 2.0 | 806 | $2,200 | $2.73 | 20d | 1 | 0.34mi |
| 353 NW 103rd Ter Pembroke Pines, FL | 2.0 | 2.5 | 1218 | $2,800 | $2.30 | 5d | 1 | 0.34mi |
| 1072 NW 106th Ter #205 Pembroke Pines, FL | 2.0 | 2.0 | 806 | $2,100 | $2.61 | 17d | 1 | 0.36mi |
| 10609 NW 8th St Pembroke Pines, FL | 2.0 | 2.5 | 1224 | $2,700 | $2.21 | 14d | 1 | 0.38mi |
| 730 NW 106th Ave #730 Pembroke Pines, FL | 2.0 | 2.5 | 1224 | $2,550 | $2.08 | 24d | 1 | 0.40mi |
| 1641 Fairway Rd Pembroke Pines, FL | 3.0 | 2.0 | 1359 | $3,200 | $2.35 | 24d | 1 | 0.40mi |
| 1641 Fairway Rd Pembroke Pines, FL | 3.0 | 2.0 | 1359 | $3,200 | $2.35 | 14d | 1 | 0.40mi |
| 730 NW 106th Ter #730 Pembroke Pines, FL | 2.0 | 2.5 | 1224 | $2,500 | $2.04 | 24d | 1 | 0.43mi |
HOA detail condo
- Monthly dues
- $703 · $8,436/yr
- Likely covers
- poolsecurity
- Assessments
- None detected in remarks — confirm with the listing agent.
Listing history 14 events
-
2026-06-18days on market $130,000 Active 99 DOM
-
2026-06-17days on market $130,000 Active 98 DOM
-
2026-06-16days on market $130,000 Active 97 DOM
-
2026-06-15days on market $130,000 Active 96 DOM
-
2026-06-13days on market $130,000 Active 94 DOM
-
2026-06-09days on market $130,000 Active 90 DOM
-
2026-06-07days on market $130,000 Active 88 DOM
-
2026-06-04days on market $130,000 Active 85 DOM
-
2026-06-03days on market $130,000 Active 84 DOM
-
2026-06-02days on market $130,000 Active 83 DOM
-
2026-06-01days on market $130,000 Active 82 DOM
-
2026-05-31days on market $130,000 Active 81 DOM
-
2026-05-08price $135,000
-
2025-10-24$145,000 Active
ⓘ Source: listings_history table (triggers on properties + properties_extension) + one-shot
backfill from property_details.listing_events for pre-trigger history.
Tax reassessment forecast FL · Resets to sale price
- Current annual tax
- $588 · $49/mo
- Projected year-2 tax
- $1,079 · $90/mo
- Expected delta
- +$491/yr (+$41/mo · 83.5%)
ⓘ Screening estimate from a state-policy table — verify with the county assessor before closing.
Climate risk First Street
- Flood 1/10 Low FEMA zone X (shaded) · 0% chance over 30 yrs
- Wildfire 1/10 Low
- Heat 10/10 Extreme 7 d/yr ≥105°F today · 28 d/yr by 30 yrs out
- Wind 10/10 Extreme 99% chance of damaging wind over 30 yrs
- Air quality 2/10 Low 2 unhealthy d/yr today · 2 by 30 yrs out
Nearby sold comps map
Loading sold comps map…
Walkable amenities ~0.75 mi
Loading nearby amenities…
Taxation est. · year 1
- Rental income
- $26,886
- − Mortgage interest
- −$7,282
- − Property taxes
- −$588
- − Insurance
- −$650
- − Repairs & maintenance
- −$2,151
- − Management
- −$2,151
- − HOA
- −$8,436
- − Depreciation
- −$3,782
- Taxable income
- $1,847
- Est. tax owed @ 24.0%
- −$443
- After-tax cash flow
- $2,942/yr
For passive investors: Depreciation is non-cash, so a rental often shows a tax loss while cash-flowing — sheltering income. Rental losses are passive: they offset passive income freely, and up to $25,000/yr can offset ordinary (W-2) income if you actively participate and your MAGI is under $100k (phasing out to $0 by $150k); unused losses carry forward. On sale, claimed depreciation is recaptured at up to 25%, and gains may owe capital-gains tax (a 1031 exchange can defer both). Figures are a year-1 estimate at your 24.0% rate — not tax advice; consult a CPA.
Schools (NCES district)
- District
- Broward
- NCES district ID
- 1200180
- Math proficiency
- 42% ▼ -18.00%
- Reading proficiency
- 53% ▼ -5.00%
- Median HH income
- $52,139
- Composite
- 40.88/100
- National rank
- #3621
- State rank
- #46 of 73 in FL
Livability — Pembroke Pines
- Score
- 83/100
- State rank
- #54
- US rank
- #933
Category grades
Schools grade is shown separately in the Schools card above.
Census & demographics
- Census place
- Pembroke Pines, FL
- County
- Broward County · 1,963,430 people
- City population
- 180,224
- Metro
- Miami-Fort Lauderdale-Pompano Beach, FL
- Population (ZIP)
- 31,172
- Household income
- $89,306
- Rent vs Own
- Severe rent burden
- 517.0
Population outlook (Broward County) Hauer SSP2
- Today (2025)
- 2,207,033 people
- By 2030
- 2,360,704 · +7.0%
- By 2040
- 2,661,208 · +20.6%
- By 2050
- 2,946,698 · +33.5%
- By 2075
- 3,602,273 · +63.2%
- By 2100
- 3,970,984 · +79.9%
Race, ethnicity, and origin ACS 2023
- Neighborhood character
- Diverse neighborhood (Simpson 0.69)
- Race & ethnicity
- Hispanic / Latino 41% White 35% Two or more races 23% Black 15% Asian 4%
- Hispanic origin (detail)
- Puerto Rican 5% Cuban 13% Dominican 2%
- Common ancestry
- Hispanic 5% Romanian 3% Scotch-Irish 2%
- Foreign-born
- 35% · Canada, Jamaica, China
- Languages at home
- 52% English-only · Spanish 35% French/Haitian/Cajun 5% Other Indo-European 4%
Political lean MEDSL · Broward
- 2024 margin
- D (+17.0) · D 58.0% · R 41.0%
- 2008→2024 swing
- -17.8pp toward R · 2008: 34.7pp · 2024: 17.0pp
- All cycles
- 2024: D+17.0 2020: D+29.8 2016: D+35.0 2012: D+34.9 2008: D+34.7
Not yet ingested
- Civics
- —
Market trends
- HPI YoY
- ▼ -248.72%
- Current HPI
- 380.7596
- Rent YoY
- ▲ 1.58%
- Metro
- Miami-Fort Lauderdale-Pompano Beach, FL
- State GDP YoY
- ▲ 3.28%
- F500 in state
- 36
Industry mix (Fortune 500 HQ in FL)
| Industry | F500 HQs | Revenue |
|---|---|---|
| Industrial Technology | 2 | $29B |
|
||
| Insurance | 2 | $17B |
|
||
| Retail | 1 | $60B |
|
||
| Technology Distribution | 1 | $58B |
|
||
| Homebuilding | 1 | $35B |
|
||
| Technology Manufacturing | 1 | $35B |
|
||
Price history
-6.9% since first listed2 events — show timeline
- 2026-05-08 Price Changed $135,000 Beaches MLS
- 2025-10-24 Listed $145,000 Beaches MLS
Property tax history
+1.0%/yrLatest (2025): $588 · +2.0% YoY. Source: county tax records.
Cash-flow waterfall
monthlySold comps — $/sqft
last 12 mo · ≤1 miLoading sold comps…