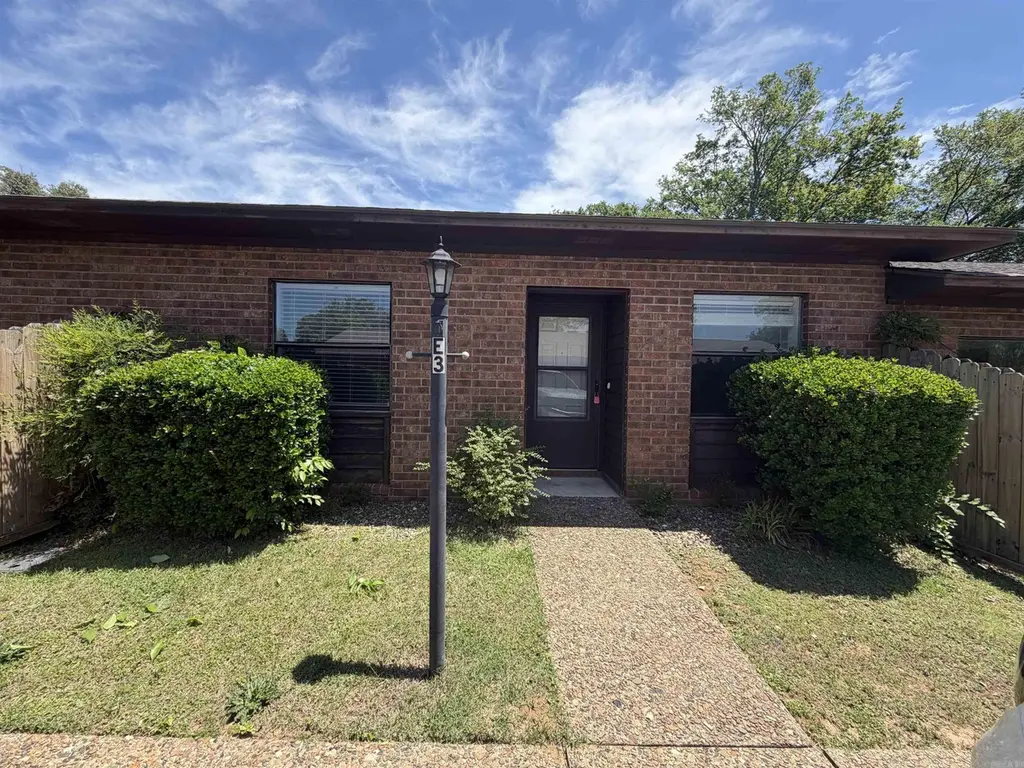
301 Hammond Dr Unit E3 · Hot Springs, AR
Flood risk No data
- FEMA flood zone
- —
- Chance of flooding over 30 yrs
- —
- Est. flood insurance / yr
- —
Fire risk No data
- Est. fire insurance / yr
- —
Heat risk No data
- Hot days now (above threshold)
- —
- Hot days in 30 yrs
- —
Wind risk No data
- Chance of severe wind over 30 yrs
- —
Air-quality risk No data
- Unhealthy air days now
- —
- Unhealthy air days in 30 yrs
- —
Risk factors via First Street. Map © Google.
Why this score? — see what drove the C- grade
The composite is a weighted blend of 9 inputs, each scored 0–100. Each bar is that input's sub-score; the figure is the points it added to the 100-point composite (weight × sub-score).
- Cash flow +16.9/30.0
- ARV discount +13.0/15.0
- 1% rule +5.9/10.0
- DSCR +5.3/10.0
- Rent growth +4.1/5.0
- Livability +3.2/5.0
- Condition / age +2.5/5.0
- Schools +2.0/10.0
- Appreciation +0.0/10.0
$99,999
🖨 Deal sheet 📄 Offer letter ✓ Due diligence
Listing remarks MLS
Move in ready condo in the city. Owners redid 2 years ago. New carpet, tile, paint and appliances. Roomy master, eat-in kitchen and patio area off the back. Stack w/ d and new heat pump.
Key facts
- Big covered pavilion
- Swimming pool
- New roof
Tags
Property features AI
Finance
- Other: Approximate living area reported as 1,000; Subdivision: CHARMARY SQUARE HPR
- Financial info: Financing options may include conventional loans, cash, trade or exchange
- HOA & community: Monthly association fee covers building exterior and grounds; other items as noted; Association fee billed monthly
Exterior
- Parking: Parking pads
- Utilities: Public sewer; Public water; Municipal electric service (Entergy); Natural gas
- Home design: Unit in a multi-unit building; Located inside city limits
- Construction: Architectural shingle roof; Slab foundation
- Exterior features: Brick exterior; Patio; Fully fenced yard; Paved road access; Level lot in a subdivision; Community amenities include swimming pool(s) and picnic area
Interior
- Kitchen: Microwave; Electric range; Dishwasher; Garbage disposal
- Flooring: Tile; Laminate
- Bathrooms: 2 full bathrooms
- Heating & cooling: Central electric cooling; Central gas heating
- Interior features: Washer connection; washer and dryer remain with the property; Gas water heater; Smoke detectors; Ceiling fans; Walk-in shower; Breakfast bar; Sheetrock walls and ceilings
- Laundry & utility: Washer connection; washer and dryer stay
Neighborhood map
What this means for you Summary
Snapshot
- This is a 2-bed/2.0-bath condo listed at $100k.
Deal economics
- At list price, monthly cash flow is $66 ($794/yr) — positive.
- The deal already cash-flows at list — no discount required.
- Meets the 1% rule at list price ($1k rent vs $100k).
- Recommended offer: $98k (1.5% below list) — sets the bar for market timing.
- Cap rate 7.1% vs local median 2.8% in Hot Springs — top-decile yield for the area; either an underpriced asset or a hidden risk that comps aren't pricing in. Stress-test before assuming the spread holds.
Location & tenants
- Location reads 65/100 on livability (#140 in AR) — a middle-class / working-renter tenant base. Strengths: cost of living A+, housing A+, health & safety A-; Watch: schools D, crime F, amenities F.
- Hot Springs School District (urban): math 24% / reading 25% proficiency, ranked #195 of 238 in AR (top 82%) — low school quality limits family demand, transient renter base, plan for 1-2y turnover; 72% free/reduced lunch — lower-income household profile, screen leases tightly.
- Market conditions: Rents rising fast (+6.4%/yr); 986 active listings in the ZIP; 3 comparable units currently listed for rent nearby; rentals lingering (median 44d on market — plan ~5-8 weeks vacancy on turnover, expect pricing pressure); 100% of comp listings sitting > 30 days — soft ceiling on asking rent; 117 units permitted in Garland County in 2024 (24 in 5+ unit buildings).
Forward outlook
- Local home prices are declining (-3.0%/yr); year-one equity from $691 of loan paydown is wiped out by about $3k of value loss. Plan a longer hold.
- Garland County population projected at +7% by 2050 — modest demand growth; plan on rents tracking national, not racing it.
Negotiation context
- It's been on market 21 days — a 2% lower offer ($98k) is reasonable based on typical stale-listing flexibility.
- 2 sale attempts since 16y ago with the ask held roughly flat each time — persistent listings suggest the price (not the market) is what's stuck; bring a comps-based counter.
- Current owner paid $62k; list at $100k implies a 61% gain — meaningful room to come down on a strong offer.
Questions for the listing agent
- What does the HOA fee cover, when was the last increase, and are there any pending special assessments or reserve-fund shortfalls?
- Any open or pending special assessments — roof, HVAC, plumbing, elevator, façade? What's the per-unit balance and payoff schedule, and is the seller paying it off at close or rolling it to the buyer?
- Is there a deadline driving the sale (1031 exchange, divorce, estate, relocation)? That informs how much negotiation room exists.
- Schools are D-rated, which usually means shorter tenancies and higher turnover. Who's the typical renter profile here, and what's been the actual vacancy rate?
- Crime grade is F in this area — have there been break-ins, vandalism, or insurance claims at this property in the last 3 years? What carrier currently insures it and at what premium?
- What's the average days-on-market for RENTAL listings here right now (not sales)? A rising rental-DOM trend means longer vacancies and softer asking-rent achievability than the comps imply.
- What's the recent tenant-quality profile in this submarket — average credit score on applications, eviction rate, late-payment / NSF rate, and stable-employment percentage? A property-management company in the area should have these aggregated.
- How much new apartment / multifamily construction is in the pipeline within 1–3 miles? Heavy new supply (>2% of stock underway) typically softens rents 12–24 months out; light construction supports rent growth.
Investment metrics
- 1% rule
- 1.09% ✓
- Cap rate
- 7.09%
- Cash-on-cash
- 2.84%
- DSCR
- 1.13
- GRM
- 7.7
CMA / ARV
- ARV (median comp)
- $113,844
- List price
- $99,999
- Delta
- -12.16%
- Verdict
- UNDERPRICED
- Comps
- 20 within 1.0 mi
Projected returns pro-forma
-3.0% appreciation · 6.43% rent growth · sell at horizon
- IRR
- -7.5%
- Equity multiple
- 0.71×
- Total profit
- $-8,026
- Equity at exit
- $14,910
- IRR
- 6.5%
- Equity multiple
- 1.57×
- Total profit
- $15,862
- Equity at exit
- $8,646
Cash invested: $28,000 (down + closing). Projections, not guarantees.
Landlord ↔ Tenant lean methodology
- Overall (STATE)
- 92 Strongly Landlord-Friendly
- State Arkansas
- 92 Strongly Landlord-Friendly · R+14
- County
- — inherits STATE
- City
- — inherits STATE
ZIP-level market 71913
- Home prices YoY
- -33.9%
- Rents YoY
- 6.4%
- Active inventory
- 986
- Price-to-rent
- 7.7×
Monthly cashflow live
- Estimated rent
- $1,088 medium interval (Pro) →
- Mortgage (P&I)
- −$524
- Tax from tax record
- −$43 /mo · $518/yr
- Insurance
- −$42
- HOA
- −$184
- Vacancy / Maint / Mgmt
- −$228
- Net cashflow
- $66
Break-even live
UW: 25.0% down · 7.5% · 30yr · 1.5% tax · 5.0% vac · 8.0% maint · 8.0% mgmt
Financing live
Cash to close
- Down payment
- $25,000
- Closing costs
- $3,000
- Reserves months
- —
- Total cash needed
- —
Loan-product check · same deal, 3 products live
Conventional
25% down · 7.5% · 30yr
- Down + closing
- —
- Monthly P&I
- —
- Monthly cashflow
- —
- DSCR
- —
- Eligible?
- —
Personal DTI + credit; lowest rate.
DSCR
20% down · 8.5% · 30yr
- Down + closing
- —
- Monthly P&I
- —
- Monthly cashflow
- —
- DSCR
- —
- Eligible?
- —
No personal income docs; deal must DSCR.
Hard money
10% down · 12.0% · 12mo
- Down + closing
- —
- Monthly P&I
- —
- Monthly cashflow
- —
- DSCR
- —
- Eligible?
- —
Short-term bridge; refi at stabilization.
Rent comps 3 comps
| Address | Beds | Baths | Sqft | Rent | $/sqft | DOM | Units | Dist |
|---|---|---|---|---|---|---|---|---|
| 150 Sun St Hot Springs National Park, AR | 3.0 | 1.0 | 1120 | $1,150 | $1.03 | 44d | 1 | 0.60mi |
| 1036 Garland Ave Hot Springs National Park, AR | 2.0 | 1.0 | 1200 | $1,150 | $0.96 | 44d | 1 | 1.40mi |
| 410 Oakwood Ave Hot Springs, AR | 2.0–3.0 | 2.0 | 1000 | $999 | $1.00 | 44d | 6 | 1.47mi |
HOA detail condo
- Monthly dues
- $184 · $2,208/yr
- Assessments
- None detected in remarks — confirm with the listing agent.
Listing history 14 events
-
2026-06-03status $99,999 Under Contract 21 DOM
-
2026-06-02days on market $99,999 Price Change 21 DOM
-
2026-06-01days on market $99,999 Price Change 20 DOM
-
2026-05-31days on market $99,999 Price Change 19 DOM
-
2026-05-30days on market $99,999 Price Change 18 DOM
-
2026-05-12$105,000 New Listing 604-char remark
-
2011-11-22soldstatus $62,000
-
2011-11-21soldstatus $62,000 186-char remark
Show marketing remark (186 chars)
Move in ready condo in the city. Owners redid 2 years ago. New carpet, tile, paint and appliances. Roomy master, eat-in kitchen and patio area off the back. Stack w/ d and new heat pump.
-
2011-10-21historical 186-char remark
Show marketing remark (186 chars)
Move in ready condo in the city. Owners redid 2 years ago. New carpet, tile, paint and appliances. Roomy master, eat-in kitchen and patio area off the back. Stack w/ d and new heat pump.
-
2010-03-01$70,000 186-char remark
Show marketing remark (186 chars)
Move in ready condo in the city. Owners redid 2 years ago. New carpet, tile, paint and appliances. Roomy master, eat-in kitchen and patio area off the back. Stack w/ d and new heat pump.
-
2007-10-18soldstatus $75,000
-
2002-10-21soldstatus $57,000
-
2000-06-20soldstatus $48,000
-
1999-12-28soldstatus $43,000
ⓘ Source: listings_history table (triggers on properties + properties_extension) + one-shot
backfill from property_details.listing_events for pre-trigger history.
Tax reassessment forecast AR · Resets to sale price
- Current annual tax
- $518 · $43/mo
- Projected year-2 tax
- $640 · $53/mo
- Expected delta
- +$122/yr (+$10/mo · 23.5%)
ⓘ Screening estimate from a state-policy table — verify with the county assessor before closing.
Nearby sold comps map
Loading sold comps map…
Walkable amenities ~0.75 mi
Loading nearby amenities…
Taxation est. · year 1
- Rental income
- $13,055
- − Mortgage interest
- −$5,601
- − Property taxes
- −$518
- − Insurance
- −$500
- − Repairs & maintenance
- −$1,044
- − Management
- −$1,044
- − HOA
- −$2,208
- − Depreciation
- −$2,909
- Taxable loss
- −$771
- Est. tax savings @ 24.0%
- +$185
- After-tax cash flow
- $979/yr
For passive investors: Depreciation is non-cash, so a rental often shows a tax loss while cash-flowing — sheltering income. Rental losses are passive: they offset passive income freely, and up to $25,000/yr can offset ordinary (W-2) income if you actively participate and your MAGI is under $100k (phasing out to $0 by $150k); unused losses carry forward. On sale, claimed depreciation is recaptured at up to 25%, and gains may owe capital-gains tax (a 1031 exchange can defer both). Figures are a year-1 estimate at your 24.0% rate — not tax advice; consult a CPA.
Schools (NCES district)
- District
- Hot Springs School District
- NCES district ID
- 0507890
- Math proficiency
- 24% ▼ -15.00%
- Reading proficiency
- 25% ▼ -12.00%
- Median HH income
- $28,817
- Composite
- 19.62/100
- National rank
- #8746
- State rank
- #195 of 238 in AR
Livability — Hot Springs
- Score
- 65/100
- State rank
- #140
- US rank
- #12498
Category grades
Schools grade is shown separately in the Schools card above.
Census & demographics
- Census place
- Hot Springs, AR
- County
- Garland County · 76,414 people
- City population
- 76,414
- Metro
- Hot Springs, AR
- Population (ZIP)
- 47,477
- Household income
- $56,010
- Rent vs Own
- Severe rent burden
- 1442.0
Population outlook (Garland County) Hauer SSP2
- Today (2025)
- 100,343 people
- By 2030
- 101,880 · +1.5%
- By 2040
- 104,804 · +4.4%
- By 2050
- 107,292 · +6.9%
- By 2075
- 113,182 · +12.8%
- By 2100
- 112,247 · +11.9%
Race, ethnicity, and origin ACS 2023
- Neighborhood character
- Predominantly White (79%)
- Race & ethnicity
- White 79% Hispanic / Latino 8% Black 8% Two or more races 6% Asian 1%
- Hispanic origin (detail)
- Mexican 6%
- Common ancestry
- Italian 3% Lithuanian 2% Slovak 2%
- Foreign-born
- 5% · Canada
- Languages at home
- 91% English-only · Spanish 7% Other Indo-European 1%
Political lean MEDSL · Garland
- 2024 margin
- Solid R (+36.2) · D 30.8% · R 67.0% · Other 2.2%
- 2008→2024 swing
- -11.3pp toward R · 2008: -25.0pp · 2024: -36.2pp
- All cycles
- 2024: R+36.2 2020: R+34.0 2016: R+34.1 2012: R+29.9 2008: R+25.0
Not yet ingested
- Civics
- —
Market trends
- HPI YoY
- ▼ -137.67%
- Current HPI
- 268.5228
- Rent YoY
- ▲ 6.43%
- Metro
- Hot Springs, AR
- State GDP YoY
- ▲ 3.80%
- F500 in state
- 10
Industry mix (Fortune 500 HQ in AR)
| Industry | F500 HQs | Revenue |
|---|---|---|
| Retail | 1 | $681B |
|
||
| Food / Agriculture | 1 | $53B |
|
||
| Retail / Energy | 1 | $22B |
|
||
| Transportation / Logistics | 1 | $12B |
|
||
| Energy | 1 | $4B |
|
||
Price history
+132.6% since first listed13 events — show timeline
- 2026-06-02 Pending — CARMLS
- 2026-05-30 Price Changed $99,999 CARMLS
- 2026-05-24 Price Changed $97,500 CARMLS
- 2026-05-19 Price Changed $99,999 CARMLS
- 2026-05-12 Listed $105,000 CARMLS
- 2011-11-22 Sold (Public Records) $62,000 Public Records
- 2011-11-21 Sold (MLS) $62,000 CARMLS
- 2011-10-21 Listing Removed — CARMLS
- 2010-03-01 Listed $70,000 CARMLS
- 2007-10-18 Sold (Public Records) $75,000 Public Records
- 2002-10-21 Sold (Public Records) $57,000 Public Records
- 2000-06-20 Sold (Public Records) $48,000 Public Records
- 1999-12-28 Sold (Public Records) $43,000 Public Records
Property tax history
+1.3%/yrLatest (2025): $518 · +3.0% YoY. Source: county tax records.
Cash-flow waterfall
monthlySold comps — $/sqft
last 12 mo · ≤1 miLoading sold comps…