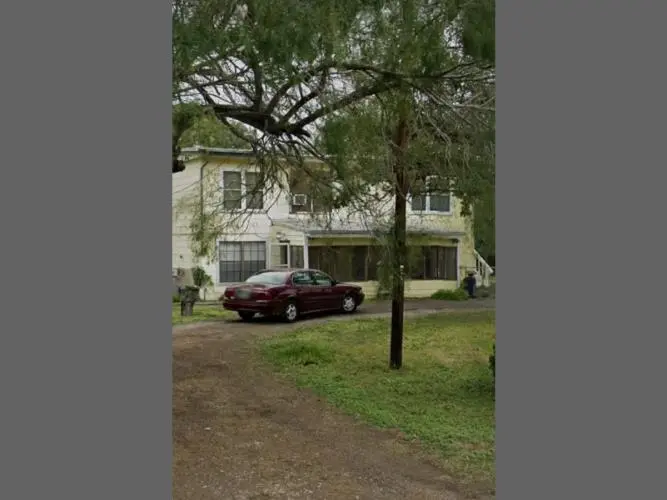
100 4th St · Lake City, TX
Flood risk 1/10 · Minimal
- FEMA flood zone
- X (unshaded)
- Chance of flooding over 30 yrs
- 0.0%
- Est. flood insurance / yr
- $507 – $1,088
Fire risk 4/10 · Minor
- Est. fire insurance / yr
- $1,222 – $2,270
Heat risk 9/10 · Severe
- Hot days now (above 110°F)
- 7 days/yr
- Hot days in 30 yrs
- 21 days/yr
Wind risk 9/10 · Severe
- Chance of severe wind over 30 yrs
- 99.0%
Air-quality risk 1/10 · Minimal
- Unhealthy air days now
- 0 days/yr
- Unhealthy air days in 30 yrs
- 0 days/yr
Risk factors via First Street. Map © Google.
Why this score? — see what drove the A- grade
The composite is a weighted blend of 9 inputs, each scored 0–100. Each bar is that input's sub-score; the figure is the points it added to the 100-point composite (weight × sub-score).
- Cash flow +30.0/30.0
- ARV discount +15.0/15.0
- 1% rule +10.0/10.0
- DSCR +10.0/10.0
- Appreciation +7.2/10.0
- Livability +3.0/5.0
- Schools +2.9/10.0
- Rent growth +2.5/5.0
- Condition / age +2.5/5.0
$65,000
🖨 Deal sheet 📄 Offer letter ✓ Due diligence
Listing remarks MLS
ABSOUTLEY LOOKING FOR CASH BUYERS WITH PROOF OF FUNDS. NO WHOLESALERS UNLESS YOU HAVE AN ACTUAL BUYER Price: $65,000 Bedrooms: 3 Bathrooms: 2 Square Footage: 1680 Year Built: 1960 Type: Duplex Property Description Investment Opportunity: Assignment of Contract – 2-Story Duplex on Large Lot Property Type: 2-Story Duplex Location: 100 4th St. Lake City, Tx. 78368 Lot Size: Approximately 0.75 Acres (¾ Acre) Layout: Downstairs Unit: 1 Bed / 1 Bath / Upstairs Unit: 2 Bed / 1 Bath Key Property Features: Duplex sits on a spacious ¾-acre lot – great potential for rental income or owner-occupant plus rental strategy.
Key facts
- Large lot
- 2 story duplex
- Built 1960
Tags
Neighborhood map
What this means for you Summary
Snapshot
- This is a 3-bed/2.0-bath single-family listed at $65k.
Deal economics
- At list price, monthly cash flow is $581 ($7k/yr) — positive.
- The deal already cash-flows at list — no discount required.
- Meets the 1% rule at list price ($1k rent vs $65k).
- Recommended offer: $57k (12.0% below list) — sets the bar for market timing.
Location & tenants
- Location reads 59/100 on livability (#1,180 in TX) — a working-class tenant base; expect higher turnover. Strengths: cost of living A+, housing A+; Watch: health & safety C-, schools F, crime F.
- Mathis ISD (town): math 29% / reading 42% proficiency, ranked #528 of 826 in TX (top 64%) — families likely to look elsewhere, expect single-tenant / working-renter base with shorter leases; 78% free/reduced lunch — lower-income household profile, screen leases tightly.
- Market conditions: 110 active listings in the ZIP; 344 units permitted in San Patricio County in 2024 (0 in 5+ unit buildings).
Forward outlook
- In year one you build about $3k of equity ($449 loan paydown + $3k appreciation (4.4% local appreciation)).
- San Patricio County population projected at +27% by 2050 — long-run rental-demand tailwind backs the buy-and-hold thesis.
- At projected returns (4.4% appreciation + 3.0% rent growth), your $18k cash investment doubles in ~2 years — after that, you're playing with house money.
- By year 10, paydown + projected appreciation supports a ~$33k cash-out refi (75% LTV) — recoverable capital for the next deal without selling this one.
Negotiation context
- It's been on market 300 days — a 12% lower offer ($57k) is reasonable based on typical stale-listing flexibility.
Risks & watch-outs
- Watch-outs: property tax is 3.2% of price.
- Climate carrying-cost: severe wind risk, 99% chance of damaging wind over 30y; extreme-heat days projected 7→21/yr by 2055 (HVAC capex compounding) — expect insurance premiums to compound above CPI over the hold.
Questions for the listing agent
- It's been on market 300 days. Have you received any prior offers? Is the seller open to a 12% concession, seller financing, or rate buy-down credit?
- Built in 1960 — when were the roof, HVAC, electrical panel, plumbing, and water heater last replaced?
- Property tax is high relative to price — has the assessment been appealed recently, and will the sale trigger a re-assessment?
- Why hasn't it sold? Are there any deal-killer items the seller is aware of (foundation, flood, title, zoning, code violations)?
- Is there a deadline driving the sale (1031 exchange, divorce, estate, relocation)? That informs how much negotiation room exists.
- Schools are F-rated, which usually means shorter tenancies and higher turnover. Who's the typical renter profile here, and what's been the actual vacancy rate?
- Crime grade is F in this area — have there been break-ins, vandalism, or insurance claims at this property in the last 3 years? What carrier currently insures it and at what premium?
- What's the average days-on-market for RENTAL listings here right now (not sales)? A rising rental-DOM trend means longer vacancies and softer asking-rent achievability than the comps imply.
- What's the recent tenant-quality profile in this submarket — average credit score on applications, eviction rate, late-payment / NSF rate, and stable-employment percentage? A property-management company in the area should have these aggregated.
- How much new for-sale + rental construction is in the pipeline within 1–3 miles? Heavy new supply typically softens prices + rents 12–24 months out; constrained supply supports both.
Investment metrics
- 1% rule
- 2.18% ✓
- Cap rate
- 17.03%
- Cash-on-cash
- 38.33%
- DSCR
- 2.71
- GRM
- 3.8
CMA / ARV
- ARV (on-the-fly)
- $120,960
- Comps found
- 1
Show comp detail 1 sale within ~0.75 mi
| Address | Dist | Beds/Ba | Sqft | Sold | Price | $/sf | Match |
|---|---|---|---|---|---|---|---|
| 115 Lake St | 0.16mi | 4/2.0 (+1) | 1,818 (+8%) | 13mo | $130,000 | $72 | 63 |
Match score weights: distance 35% · size 25% · config 20% · recency 20%. Top-matched comps best support the ARV.
Projected returns pro-forma
4.39% appreciation · 3.0% rent growth · sell at horizon
- IRR
- 45.9%
- Equity multiple
- 3.74×
- Total profit
- $49,841
- Equity at exit
- $34,447
- IRR
- 44.4%
- Equity multiple
- 7.59×
- Total profit
- $119,956
- Equity at exit
- $57,564
Cash invested: $18,200 (down + closing). Projections, not guarantees.
Landlord ↔ Tenant lean methodology
- Overall (STATE)
- 87 Strongly Landlord-Friendly
- State Texas
- 87 Strongly Landlord-Friendly · R+5
- County
- — inherits STATE
- City
- — inherits STATE
ZIP-level market 78368
- Home prices YoY
- 4.7%
- Active inventory
- 110
- Price-to-rent
- 3.8×
Monthly cashflow live
- Estimated rent
- $1,420 medium interval (Pro) →
- Mortgage (P&I)
- −$341
- Tax from tax record
- −$172 /mo · $2,067/yr
- Insurance
- −$27
- HOA
- −$0
- Vacancy / Maint / Mgmt
- −$298
- Net cashflow
- $581
Break-even live
UW: 25.0% down · 7.5% · 30yr · 1.5% tax · 5.0% vac · 8.0% maint · 8.0% mgmt
Financing live
Cash to close
- Down payment
- $16,250
- Closing costs
- $1,950
- Reserves months
- —
- Total cash needed
- —
Loan-product check · same deal, 3 products live
Conventional
25% down · 7.5% · 30yr
- Down + closing
- —
- Monthly P&I
- —
- Monthly cashflow
- —
- DSCR
- —
- Eligible?
- —
Personal DTI + credit; lowest rate.
DSCR
20% down · 8.5% · 30yr
- Down + closing
- —
- Monthly P&I
- —
- Monthly cashflow
- —
- DSCR
- —
- Eligible?
- —
No personal income docs; deal must DSCR.
Hard money
10% down · 12.0% · 12mo
- Down + closing
- —
- Monthly P&I
- —
- Monthly cashflow
- —
- DSCR
- —
- Eligible?
- —
Short-term bridge; refi at stabilization.
Listing history 16 events
-
2026-06-18days on market $65,000 Active 300 DOM
-
2026-06-17days on market $65,000 Active 299 DOM
-
2026-06-16days on market $65,000 Active 298 DOM
-
2026-06-15days on market $65,000 Active 297 DOM
-
2026-06-15days on market $65,000 Active 296 DOM
-
2026-06-13days on market $65,000 Active 295 DOM
-
2026-06-12days on market $65,000 Active 294 DOM
-
2026-06-10days on market $65,000 Active 291 DOM
-
2026-06-08days on market $65,000 Active 290 DOM
-
2026-06-08days on market $65,000 Active 289 DOM
-
2026-06-05days on market $65,000 Active 287 DOM
-
2026-06-03days on market $65,000 Active 285 DOM
-
2026-06-02days on market $65,000 Active 284 DOM
-
2026-06-01days on market $65,000 Active 283 DOM
-
2026-05-31days on market $65,000 Active 282 DOM
-
2025-08-19$65,000 Active 643-char remark
Show marketing remark (643 chars)
ABSOUTLEY LOOKING FOR CASH BUYERS WITH PROOF OF FUNDS. NO WHOLESALERS UNLESS YOU HAVE AN ACTUAL BUYER Price: $65,000 Bedrooms: 3 Bathrooms: 2 Square Footage: 1680 Year Built: 1960 Type: Duplex Property Description Investment Opportunity: Assignment of Contract – 2-Story Duplex on Large Lot Property Type: 2-Story Duplex Location: 100 4th St. Lake City, Tx. 78368 Lot Size: Approximately 0.75 Acres (¾ Acre) Layout: Downstairs Unit: 1 Bed / 1 Bath / Upstairs Unit: 2 Bed / 1 Bath Key Property Features: Duplex sits on a spacious ¾-acre lot – great potential for rental income or owner-occupant plus rental strategy.
ⓘ Source: listings_history table (triggers on properties + properties_extension) + one-shot
backfill from property_details.listing_events for pre-trigger history.
Tax reassessment forecast TX · Resets to sale price
- Current annual tax
- $2,067 · $172/mo
- Projected year-2 tax
- $2,067 · $172/mo
- Expected delta
- $0/yr ($0/mo · 0.0%)
ⓘ Screening estimate from a state-policy table — verify with the county assessor before closing.
Climate risk First Street
- Flood 1/10 Low FEMA zone X (unshaded) · 0% chance over 30 yrs
- Wildfire 4/10 Moderate
- Heat 9/10 Extreme 7 d/yr ≥110°F today · 21 d/yr by 30 yrs out
- Wind 9/10 Extreme 99% chance of damaging wind over 30 yrs
- Air quality 1/10 Low 0 unhealthy d/yr today · 0 by 30 yrs out
Nearby sold comps map
Loading sold comps map…
Walkable amenities ~0.75 mi
Loading nearby amenities…
Taxation est. · year 1
- Rental income
- $17,036
- − Mortgage interest
- −$3,641
- − Property taxes
- −$2,067
- − Insurance
- −$325
- − Repairs & maintenance
- −$1,363
- − Management
- −$1,363
- − Depreciation
- −$1,891
- Taxable income
- $6,386
- Est. tax owed @ 24.0%
- −$1,533
- After-tax cash flow
- $5,443/yr
For passive investors: Depreciation is non-cash, so a rental often shows a tax loss while cash-flowing — sheltering income. Rental losses are passive: they offset passive income freely, and up to $25,000/yr can offset ordinary (W-2) income if you actively participate and your MAGI is under $100k (phasing out to $0 by $150k); unused losses carry forward. On sale, claimed depreciation is recaptured at up to 25%, and gains may owe capital-gains tax (a 1031 exchange can defer both). Figures are a year-1 estimate at your 24.0% rate — not tax advice; consult a CPA.
Schools (NCES district)
- District
- Mathis ISD
- NCES district ID
- 4829400
- Math proficiency
- 29% ▼ -13.00%
- Reading proficiency
- 42% ▼ -2.00%
- Median HH income
- $36,954
- Composite
- 29.47/100
- National rank
- #6509
- State rank
- #528 of 826 in TX
Livability — Lake City
- Score
- 59/100
- State rank
- #1180
- US rank
- #20606
Category grades
Schools grade is shown separately in the Schools card above.
Census & demographics
- Census place
- Lake City, TX
- Population (ZIP)
- 9,474
Population outlook (San Patricio County) Hauer SSP2
- Today (2025)
- 75,538 people
- By 2030
- 79,575 · +5.3%
- By 2040
- 87,670 · +16.1%
- By 2050
- 96,107 · +27.2%
- By 2075
- 117,984 · +56.2%
- By 2100
- 130,010 · +72.1%
Race, ethnicity, and origin ACS 2023
- Neighborhood character
- Majority Hispanic (61%)
- Race & ethnicity
- Hispanic / Latino 61% White 33% Two or more races 32%
- Hispanic origin (detail)
- Mexican 55%
- Common ancestry
- Romanian 1% Lithuanian 1% Serbian 1%
- Foreign-born
- 1% · Canada
- Languages at home
- 60% English-only · Spanish 39%
Political lean MEDSL · San Patricio
- 2024 margin
- Solid R (+36.4) · D 31.4% · R 67.8%
- 2008→2024 swing
- -19.8pp toward R · 2008: -16.6pp · 2024: -36.4pp
- All cycles
- 2024: R+36.4 2020: R+29.1 2016: R+24.1 2012: R+20.6 2008: R+16.6
Not yet ingested
- Civics
- —
Market trends
- HPI YoY
- ▲ 4.39%
- Current HPI
- 98.6577
- Rent YoY
- —
- Metro
- —
- State GDP YoY
- ▲ 3.95%
- F500 in state
- 110
Industry mix (Fortune 500 HQ in TX)
| Industry | F500 HQs | Revenue |
|---|---|---|
| Energy | 16 | $1,198B |
|
||
| Technology | 5 | $198B |
|
||
| Engineering / Construction | 4 | $72B |
|
||
| Energy Services | 3 | $60B |
|
||
| Utilities | 3 | $41B |
|
||
| Healthcare | 2 | $330B |
|
||
Price history
1 event — show timeline
- 2025-08-19 Listed $65,000 Fizber.com
Property tax history
+3.0%/yrLatest (2025): $2,067 · +11.3% YoY. Source: county tax records.
Cash-flow waterfall
monthlySold comps — $/sqft
last 12 mo · ≤1 miLoading sold comps…