6001 Larkgrove Dr · Louisville/Jefferson County metro government (balance), KY
Flood risk 1/10 · Minimal
- FEMA flood zone
- X (unshaded)
- Chance of flooding over 30 yrs
- 0.0%
- Est. flood insurance / yr
- $507 – $1,088
Fire risk 1/10 · Minimal
- Est. fire insurance / yr
- $839 – $1,559
Heat risk 5/10 · Moderate
- Hot days now (above 104°F)
- 7 days/yr
- Hot days in 30 yrs
- 19 days/yr
Wind risk 2/10 · Minimal
- Chance of severe wind over 30 yrs
- 3.0%
Air-quality risk 3/10 · Minor
- Unhealthy air days now
- 2 days/yr
- Unhealthy air days in 30 yrs
- 5 days/yr
Risk factors via First Street. Map © Google.
Why this score? — see what drove the D+ grade
The composite is a weighted blend of 9 inputs, each scored 0–100. Each bar is that input's sub-score; the figure is the points it added to the 100-point composite (weight × sub-score).
- ARV discount +15.0/15.0
- Cash flow +14.3/30.0
- DSCR +4.3/10.0
- Rent growth +3.9/5.0
- 1% rule +3.4/10.0
- Livability +2.5/5.0
- Condition / age +2.5/5.0
- Schools +2.3/10.0
- Appreciation +0.0/10.0
$260,000
🖨 Deal sheet (PDF) 📄 Offer letter ✓ Due diligence
Listing remarks MLS
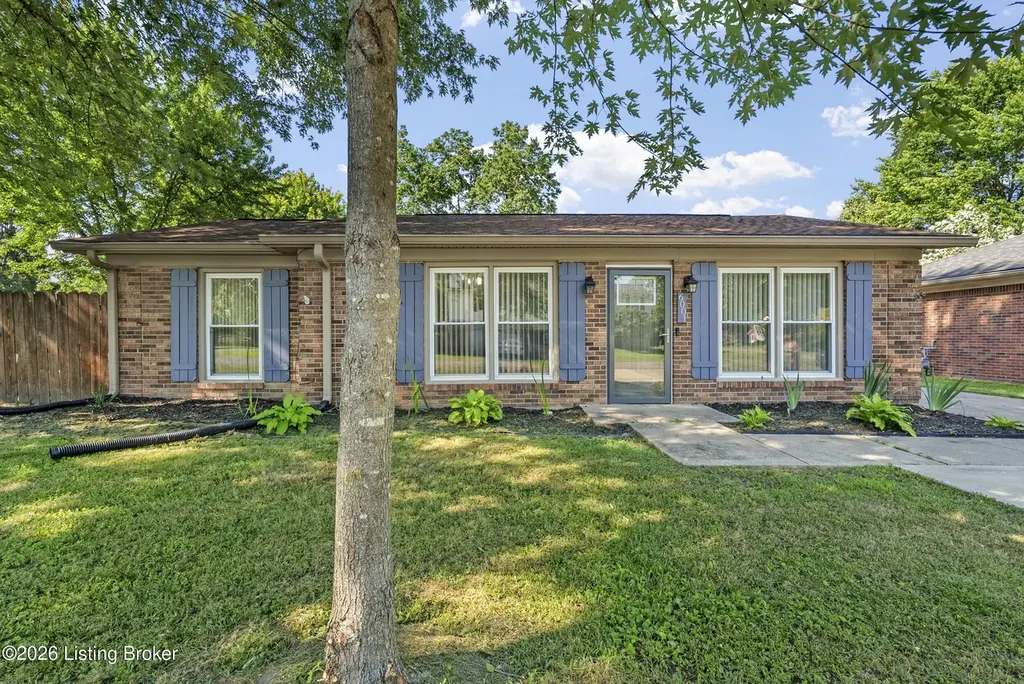
This wonderfully maintained four bedroom ranch has more than you can expect! As you enter in through the front foyer, you'll notice the brand new beautiful engineered laminate flooring throughout the entire home! Located near Penn Run Golf Course with additional amenities minutes away, don't let it slip. This spacious 4 bedroom, 2 bath home is waiting for its next home owner! Schedule your showing today!
Key facts
- Park-like backyard
- Corner lot
- Gorgeous landscaping
Tags
Property features AI
Finance
- HOA & community: No association fee
Exterior
- Parking: Driveway
- Utilities: Electricity connected; Natural gas available
- Home design: Single-family ranch-style home; One story; Built in 1987
- Construction: Wood frame with brick exterior; Shingle roof; Built in 1987
- Exterior features: Privacy wood fencing
Interior
- Kitchen: Kitchen located on the first floor
- Bedrooms: 4 bedrooms, all on the first floor
- Bathrooms: 1 full bathroom on the first floor; 1 half bathroom on the first floor
- Interior features: 8 total rooms; 7 closets; 1 fireplace
- Laundry & utility: Laundry room on the first floor
Neighborhood map
What this means for you Summary
Snapshot
- This is a 4-bed/1.5-bath single-family listed at $260k.
Deal economics
- At list price, monthly cash flow is $46 ($552/yr) — positive.
- The deal already cash-flows at list — no discount required.
- To meet the 1% rule (rent ≥ 1% of price), the offer needs to be $218k (16.2% below list).
- Recommended offer: $218k (16.2% below list) — sets the bar for 1% rule.
- Cap rate 6.5% vs local median 4.0% in Louisville/Jefferson County metro government (balance) — top-decile yield for the area; either an underpriced asset or a hidden risk that comps aren't pricing in. Stress-test before assuming the spread holds.
Location & tenants
- Location reads: area grade D — affects rentability + tenant quality, not the cash-flow math above.
- Jefferson County (urban): math 19% / reading 35% proficiency, ranked #121 of 165 in KY (top 73%) — low school quality limits family demand, transient renter base, plan for 1-2y turnover.
- Market conditions: Rents rising fast (+5.5%/yr); 243 active listings in the ZIP; 7 comparable units currently listed for rent nearby; rentals leasing fast (median 13d on market — plan ~1-2 weeks tenant-placement turnaround); solid renter incomes; 2,836 units permitted in Jefferson County in 2024 (1,558 in 5+ unit buildings).
- This rent runs 33% of the median local income ($80k/yr) — at the standard rent-burdened threshold; future hikes will face affordability resistance.
Forward outlook
- Local home prices are declining (-3.0%/yr); year-one equity from $2k of loan paydown is wiped out by about $8k of value loss. Plan a longer hold.
- Jefferson County population projected at +13% by 2050 — modest demand growth; plan on rents tracking national, not racing it.
Negotiation context
- Only 10 days on market — expect competitive offers; lowballing is unlikely to land.
- 4 sale attempts since 29y ago with the ask held roughly flat each time — persistent listings suggest the price (not the market) is what's stuck; bring a comps-based counter.
- Current owner paid $220k; 18% above their basis — modest negotiation headroom, anchor on the comps not their cost.
Risks & watch-outs
- Climate carrying-cost: extreme-heat days projected 7→19/yr by 2055 (HVAC capex compounding) — expect insurance premiums to compound above CPI over the hold.
Questions for the listing agent
- Is there a deadline driving the sale (1031 exchange, divorce, estate, relocation)? That informs how much negotiation room exists.
- The area grade is low — what's the realistic commute time and amenity access for the typical tenant pool here? Any planned neighborhood developments (good or bad) we should know about?
- What's the average days-on-market for RENTAL listings here right now (not sales)? A rising rental-DOM trend means longer vacancies and softer asking-rent achievability than the comps imply.
- What's the recent tenant-quality profile in this submarket — average credit score on applications, eviction rate, late-payment / NSF rate, and stable-employment percentage? A property-management company in the area should have these aggregated.
- How much new for-sale + rental construction is in the pipeline within 1–3 miles? Heavy new supply typically softens prices + rents 12–24 months out; constrained supply supports both.
Investment metrics
- 1% rule
- 0.84% ✗
- Cap rate
- 6.51%
- Cash-on-cash
- 0.76%
- DSCR
- 1.03
- GRM
- 9.9
CMA / ARV
- ARV (on-the-fly)
- $347,360
- Comps found
- 12
Show comp detail 12 sales within ~0.75 mi
| Address | Dist | Beds/Ba | Sqft | Sold | Price | $/sf | Match |
|---|---|---|---|---|---|---|---|
| 10910 Waycross Ave | 0.21mi | 4/2.0 | 1,600 (-4%) | 4mo | $250,000 | $156 | 78 |
| 11128 Pheasant Run Ct | 0.23mi | 4/2.0 | 1,771 (+6%) | 1mo | $378,774 | $214 | 76 |
| 11112 Pheasant Run Ct | 0.21mi | 4/2.0 | 1,501 (-10%) | 4mo | $312,741 | $208 | 68 |
| 11106 Pheasant Run Ct | 0.24mi | 3/2.5 (-1) | 1,818 (+9%) | 5mo | $330,306 | $182 | 61 |
| 219 Magnolia Dr | 0.71mi | 3/2.0 (-1) | 1,691 (+1%) | 3mo | $340,000 | $201 | 55 |
| 10503 Waycross Ave | 0.53mi | 4/2.5 | 1,808 (+8%) | 3mo | $362,000 | $200 | 55 |
| 5508 Hasbrook Dr | 0.58mi | 4/2.0 | 1,540 (-8%) | 4mo | $233,000 | $151 | 54 |
| 10906 Hidden Trail Ct | 0.18mi | 3/2.0 (-1) | 1,424 (-15%) | 7mo | $313,000 | $220 | 54 |
| 5513 Antle Dr | 0.50mi | 3/1.5 (-1) | 1,840 (+10%) | 7mo | $265,000 | $144 | 49 |
| 401 Bentwood Dr | 0.45mi | 3/2.0 (-1) | 1,445 (-14%) | 4mo | $315,000 | $218 | 46 |
| 195 Bentwood Dr | 0.63mi | 3/2.0 (-1) | 1,437 (-14%) | 1mo | $330,000 | $230 | 39 |
| 189 Magnolia Dr | 0.70mi | 3/2.0 (-1) | 1,459 (-13%) | 1mo | $309,900 | $212 | 38 |
Match score weights: distance 35% · size 25% · config 20% · recency 20%. Top-matched comps best support the ARV.
Projected returns pro-forma
-3.0% appreciation · 5.46% rent growth · sell at horizon
- IRR
- -12.6%
- Equity multiple
- 0.54×
- Total profit
- $-33,718
- Equity at exit
- $38,767
- IRR
- -0.3%
- Equity multiple
- 0.97×
- Total profit
- $-1,911
- Equity at exit
- $22,480
Cash invested: $72,800 (down + closing). Projections, not guarantees.
Landlord ↔ Tenant lean methodology
- Overall (STATE)
- 83 Strongly Landlord-Friendly
- State Kentucky
- 83 Strongly Landlord-Friendly · R+16
- County
- — inherits STATE
- City
- — inherits STATE
ZIP-level market 40229
- Rents YoY
- 5.5%
- Active inventory
- 243
- Price-to-rent
- 9.9×
Monthly cashflow live
- Estimated rent
- $2,179 high interval (Pro) →
- Mortgage (P&I)
- −$1,363
- Tax from tax record
- −$204 /mo · $2,443/yr
- Insurance
- −$108
- HOA
- −$0
- Vacancy / Maint / Mgmt
- −$458
- Net cashflow
- $46
Break-even live
Sensitivity live
| Price | -10% $193 | -5% $120 | +0% $46 | +5% $-28 | +10% $-101 |
|---|---|---|---|---|---|
| Rent | -10% $-126 | -5% $-40 | +0% $46 | +5% $132 | +10% $218 |
| Rate | -1.0pp $177 | -0.5pp $112 | base $46 | +0.5pp $-21 | +1.0pp $-90 |
UW: 25.0% down · 7.5% · 30yr · 1.5% tax · 5.0% vac · 8.0% maint · 8.0% mgmt
Financing live
Cash to close
- Down payment
- $65,000
- Closing costs
- $7,800
- Reserves months
- —
- Total cash needed
- —
Loan-product check · same deal, 3 products live
Conventional
25% down · 7.5% · 30yr
- Down + closing
- —
- Monthly P&I
- —
- Monthly cashflow
- —
- DSCR
- —
- Eligible?
- —
Personal DTI + credit; lowest rate.
DSCR
20% down · 8.5% · 30yr
- Down + closing
- —
- Monthly P&I
- —
- Monthly cashflow
- —
- DSCR
- —
- Eligible?
- —
No personal income docs; deal must DSCR.
Hard money
10% down · 12.0% · 12mo
- Down + closing
- —
- Monthly P&I
- —
- Monthly cashflow
- —
- DSCR
- —
- Eligible?
- —
Short-term bridge; refi at stabilization.
Rent comps 7 comps
| Address | Beds | Baths | Sqft | Rent | $/sqft | DOM | Units | Dist |
|---|---|---|---|---|---|---|---|---|
| 11926 Washington Green Rd Louisville, KY | 3.0 | 3.0 | 1817 | $2,255 | $1.24 | 21d | 1 | 0.52mi |
| 11502 Top Walnut Loop Louisville, KY | 3.0 | 2.0 | 1865 | $2,385 | $1.28 | 24d | 1 | 0.56mi |
| 11706 Maple Way Louisville, KY | 4.0 | 1.0 | 1400 | $1,799 | $1.28 | 12d | 1 | 0.71mi |
| 11616 Maple Way Louisville, KY | 3.0 | 2.0 | 1135 | $1,895 | $1.67 | 4d | 1 | 0.74mi |
| 6507 Rod N Reel Ct Louisville, KY | 3.0 | 2.0 | 1150 | $1,550 | $1.35 | 24d | 1 | 1.08mi |
| 11602 Apex View Dr Louisville, KY | 1.0–3.0 | 1.0–2.0 | 1050 | $2,049 | $1.95 | 2d | 35 | 1.12mi |
| 11912 Parkside Vista Ln Louisville, KY | 3.0 | 2.0 | 1780 | $2,505 | $1.41 | 2d | 1 | 1.25mi |
Listing history 8 events
-
2026-06-18days on market $260,000 Active 10 DOM
-
2026-06-17days on market $260,000 Active 9 DOM
-
2026-06-16pricedays on market $260,000 Active 8 DOM
-
2026-06-15days on market $265,000 Active 7 DOM
-
2026-06-13days on market $265,000 Active 5 DOM
-
2026-06-10days on market $265,000 Active 2 DOM
-
2026-06-08remarks 699-char remark
-
2026-06-08$265,000 Active 1 DOM
ⓘ Source: listings_history table (triggers on properties + properties_extension) + one-shot
backfill from property_details.listing_events for pre-trigger history.
Tax reassessment forecast KY · Resets to sale price
- Current annual tax
- $2,443 · $204/mo
- Projected year-2 tax
- $2,443 · $204/mo
- Expected delta
- $0/yr ($0/mo · 0.0%)
ⓘ Screening estimate from a state-policy table — verify with the county assessor before closing.
Climate risk First Street
- Flood 1/10 Low FEMA zone X (unshaded) · 0% chance over 30 yrs
- Wildfire 1/10 Low
- Heat 5/10 Major 7 d/yr ≥104°F today · 19 d/yr by 30 yrs out
- Wind 2/10 Low 3% chance of damaging wind over 30 yrs
- Air quality 3/10 Moderate 2 unhealthy d/yr today · 5 by 30 yrs out
Nearby sold comps map
Loading sold comps map…
Walkable amenities ~0.75 mi
Loading nearby amenities…
Taxation est. · year 1
- Rental income
- $26,148
- − Mortgage interest
- −$14,564
- − Property taxes
- −$2,443
- − Insurance
- −$1,300
- − Repairs & maintenance
- −$2,092
- − Management
- −$2,092
- − Depreciation
- −$7,564
- Taxable loss
- −$3,907
- Est. tax savings @ 24.0%
- +$938
- After-tax cash flow
- $1,490/yr
For passive investors: Depreciation is non-cash, so a rental often shows a tax loss while cash-flowing — sheltering income. Rental losses are passive: they offset passive income freely, and up to $25,000/yr can offset ordinary (W-2) income if you actively participate and your MAGI is under $100k (phasing out to $0 by $150k); unused losses carry forward. On sale, claimed depreciation is recaptured at up to 25%, and gains may owe capital-gains tax (a 1031 exchange can defer both). Figures are a year-1 estimate at your 24.0% rate — not tax advice; consult a CPA.
Schools (NCES district)
- District
- Jefferson County
- NCES district ID
- 2102990
- Math proficiency
- 19% ▼ -17.00%
- Reading proficiency
- 35% ▼ -11.00%
- Median HH income
- $47,885
- Composite
- 23.45/100
- National rank
- #7884
- State rank
- #121 of 165 in KY
Livability — Louisville/Jefferson County metro government (balance)
No livability data for this city. (Only ~50 U.S. cities are tracked.)
Census & demographics
- Census place
- Louisville/Jefferson County metro government (balance), KY
- County
- Jefferson County · 790,184 people
- City population
- 419,741
- Metro
- Louisville/Jefferson County, KY-IN
- Population (ZIP)
- 41,299
- Household income
- $79,936
- Rent vs Own
- Severe rent burden
- 628.0
Population outlook (Jefferson County) Hauer SSP2
- Today (2025)
- 823,112 people
- By 2030
- 849,343 · +3.2%
- By 2040
- 895,696 · +8.8%
- By 2050
- 933,630 · +13.4%
- By 2075
- 1,028,262 · +24.9%
- By 2100
- 1,072,675 · +30.3%
Race, ethnicity, and origin ACS 2023
- Neighborhood character
- Predominantly White (71%)
- Race & ethnicity
- White 71% Black 12% Hispanic / Latino 12% Two or more races 9% Asian 1%
- Hispanic origin (detail)
- Mexican 3% Cuban 6%
- Common ancestry
- Lithuanian 2% Slovak 2% Italian 1%
- Foreign-born
- 9% · Canada
- Languages at home
- 87% English-only · Spanish 10% Other Indo-European 1%
Political lean MEDSL · Jefferson
- 2024 margin
- D (+16.6) · D 57.4% · R 40.9% · Other 1.7%
- 2008→2024 swing
- +4.5pp toward D · 2008: 12.0pp · 2024: 16.6pp
- All cycles
- 2024: D+16.6 2020: D+20.1 2016: D+13.3 2012: D+11.1 2008: D+12.0
Not yet ingested
- Civics
- —
Market trends
- HPI YoY
- ▼ -148.38%
- Current HPI
- 244.2747
- Rent YoY
- ▲ 5.46%
- Metro
- Louisville/Jefferson County, KY-IN
- State GDP YoY
- ▲ 1.81%
- F500 in state
- 4
Industry mix (Fortune 500 HQ in KY)
| Industry | F500 HQs | Revenue |
|---|---|---|
| Healthcare | 1 | $118B |
|
||
| Food / Beverage | 1 | $7B |
|
||
Price history
+194.8% since first listed9 events — show timeline
- 2026-06-08 Listed $265,000 Metro Search MLS
- 2024-01-18 Sold (Public Records) $219,900 Public Records
- 2024-01-12 Sold (MLS) $219,900 Metro Search MLS
- 2023-11-13 Pending — Metro Search MLS
- 2023-11-10 Listed $219,900 Metro Search MLS
- 1998-04-13 Sold (MLS) $87,500 Metro Search MLS
- 1998-04-13 Sold (MLS) $87,500 Metro Search MLS
- 1997-09-17 Listed $89,900 Metro Search MLS
- 1997-09-17 Listed $89,900 Metro Search MLS
Property tax history
+5.0%/yrLatest (2025): $2,443 · +7.5% YoY. Source: county tax records.
Cash-flow waterfall
monthlySold comps — $/sqft
last 12 mo · ≤1 miLoading sold comps…