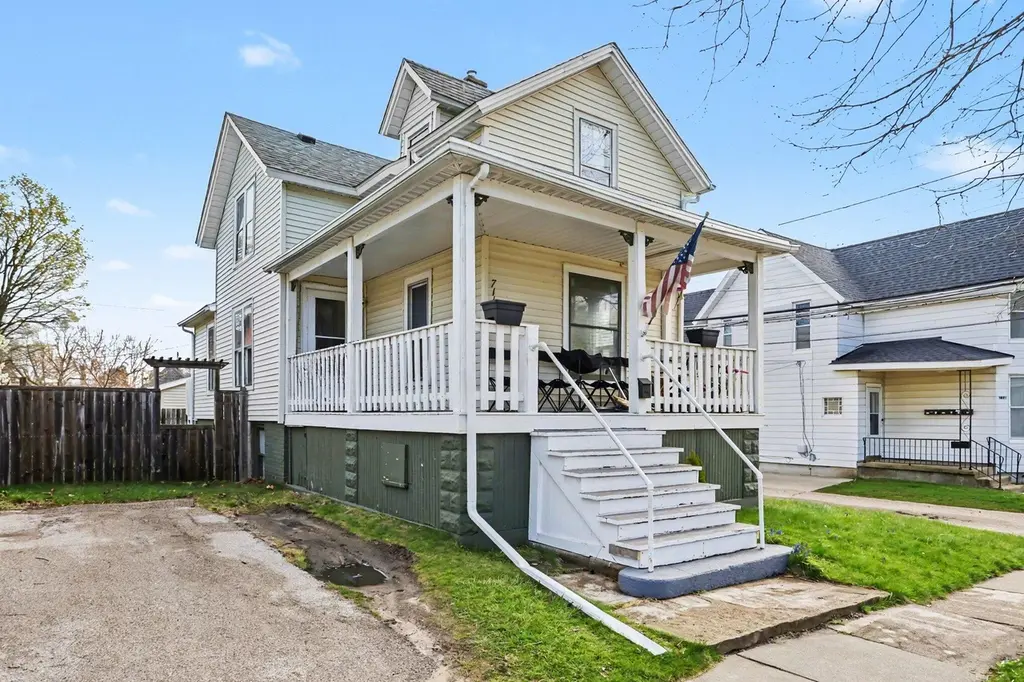
711 Jones St · St. Joseph, MI
Flood risk 1/10 · Minimal
- FEMA flood zone
- X (unshaded)
- Chance of flooding over 30 yrs
- 0.0%
- Est. flood insurance / yr
- $473 – $860
Fire risk 1/10 · Minimal
- Est. fire insurance / yr
- $784 – $1,456
Heat risk 2/10 · Minimal
- Hot days now (above 100°F)
- 7 days/yr
- Hot days in 30 yrs
- 14 days/yr
Wind risk 2/10 · Minimal
- Chance of severe wind over 30 yrs
- —
Air-quality risk 5/10 · Moderate
- Unhealthy air days now
- 8 days/yr
- Unhealthy air days in 30 yrs
- 8 days/yr
Risk factors via First Street. Map © Google.
Why this score? — see what drove the C grade
The composite is a weighted blend of 9 inputs, each scored 0–100. Each bar is that input's sub-score; the figure is the points it added to the 100-point composite (weight × sub-score).
- Cash flow +21.1/30.0
- ARV discount +12.9/15.0
- DSCR +6.7/10.0
- 1% rule +5.2/10.0
- Schools +5.1/10.0
- Livability +2.5/5.0
- Condition / age +2.5/5.0
- Rent growth +2.4/5.0
- Appreciation +0.0/10.0
$209,900
🖨 Deal sheet 📄 Offer letter ✓ Due diligence
Listing remarks MLS
Charming 3-bedroom, 1-bath home located in the heart of downtown St. Joseph. This well-maintained, move-in ready property offers a cozy and inviting atmosphere filled with character. New roof installed 2025. A great opportunity to own a home just moments from local shops, dining, and all that downtown has to offer.
Key facts
- Downtown location
- Dining
- New roof
Tags
Property features AI
Exterior
- Utilities: Public water; Natural gas connected; High-speed internet available
- Home design: Traditional style single-family residence; Living area approximately 1,065
- Construction: Vinyl siding; Composition roof; Built in 1900
- Exterior features: Sidewalk; Paved road access
Interior
- Kitchen: Dishwasher; Oven; Range; Refrigerator
- Bedrooms: Primary bedroom (12 x 12); Bedroom 2 (11 x 9); Bedroom 3 (12 x 10); Bedroom 4; Bedroom 5
- Bathrooms: 1 full bathroom; Primary bathroom; Additional bathroom
- Heating & cooling: Forced air heating; Central cooling
- Interior features: Eat-in kitchen; Pantry; 7 total rooms; Full basement; Sitting room
- Laundry & utility: Washer; Dryer; Laundry room
Neighborhood map
What this means for you Summary
Snapshot
- This is a 3-bed/1.0-bath single-family listed at $210k.
Deal economics
- At list price, monthly cash flow is $299 ($4k/yr) — positive.
- The deal already cash-flows at list — no discount required.
- Meets the 1% rule at list price ($2k rent vs $210k).
- Cap rate 8.0% vs local median 2.6% in St. Joseph — top-decile yield for the area; either an underpriced asset or a hidden risk that comps aren't pricing in. Stress-test before assuming the spread holds.
Location & tenants
- Location reads: area grade C — affects rentability + tenant quality, not the cash-flow math above.
- St. Joseph Public Schools (suburban): math 53% / reading 64% proficiency, ranked #47 of 540 in MI (top 9%) — acceptable for families but not a draw, mixed tenant base, ~2y average lease; only 18% free/reduced lunch — higher-income household profile.
- Market conditions: Rents soft (-0.2%/yr); 221 active listings in the ZIP; 1 comparable units currently listed for rent nearby; solid renter incomes; 397 units permitted in Berrien County in 2024 (40 in 5+ unit buildings).
Forward outlook
- Local home prices are declining (-3.0%/yr); year-one equity from $1k of loan paydown is wiped out by about $6k of value loss. Plan a longer hold.
- Berrien County population projected at -16% by 2050 — secular population decline; favor cash flow + early exit over multi-decade hold.
Negotiation context
- Only 14 days on market — expect competitive offers; lowballing is unlikely to land.
- 15 sale attempts since 31y ago with the ask held roughly flat each time — persistent listings suggest the price (not the market) is what's stuck; bring a comps-based counter.
- Current owner paid $133k; list at $210k implies a 58% gain — meaningful room to come down on a strong offer.
Risks & watch-outs
- Watch-outs: built in 1900 — expect roof / HVAC / electrical / plumbing capex.
Questions for the listing agent
- Built in 1900 — when were the roof, HVAC, electrical panel, plumbing, and water heater last replaced?
- Is there a deadline driving the sale (1031 exchange, divorce, estate, relocation)? That informs how much negotiation room exists.
- What's the average days-on-market for RENTAL listings here right now (not sales)? A rising rental-DOM trend means longer vacancies and softer asking-rent achievability than the comps imply.
- What's the recent tenant-quality profile in this submarket — average credit score on applications, eviction rate, late-payment / NSF rate, and stable-employment percentage? A property-management company in the area should have these aggregated.
- How much new for-sale + rental construction is in the pipeline within 1–3 miles? Heavy new supply typically softens prices + rents 12–24 months out; constrained supply supports both.
Investment metrics
- 1% rule
- 1.02% ✓
- Cap rate
- 8.00%
- Cash-on-cash
- 6.11%
- DSCR
- 1.27
- GRM
- 8.2
CMA / ARV
- ARV (on-the-fly)
- $238,560
- Comps found
- 12
Show comp detail 12 sales within ~0.75 mi
| Address | Dist | Beds/Ba | Sqft | Sold | Price | $/sf | Match |
|---|---|---|---|---|---|---|---|
| 711 Jones St | 0.00mi | 3/1.0 | 1,065 (0%) | 1mo | $209,900 | $197 | 99 |
| 810 Hoyt St | 0.11mi | 3/1.0 | 1,021 (-4%) | 1mo | $220,000 | $215 | 87 |
| 716 Price St | 0.04mi | 2/1.0 (-1) | 1,102 (+4%) | 11mo | $225,500 | $205 | 78 |
| 1804 S State St | 0.48mi | 2/1.0 (-1) | 1,068 (+0%) | 0mo | $322,000 | $301 | 72 |
| 912 Market St | 0.26mi | 2/1.5 (-1) | 1,014 (-5%) | 6mo | $147,400 | $145 | 68 |
| 1008 Wayne St | 0.17mi | 2/1.5 (-1) | 1,176 (+10%) | 2mo | $249,900 | $213 | 66 |
| 526 La Salle Ave | 0.55mi | 2/1.0 (-1) | 1,068 (+0%) | 4mo | $250,000 | $234 | 66 |
| 1512 S State St | 0.33mi | 2/1.0 (-1) | 1,133 (+6%) | 4mo | $206,500 | $182 | 65 |
| 807 Church St | 0.15mi | 2/1.0 (-1) | 956 (-10%) | 9mo | $250,000 | $262 | 64 |
| 849 Lewis Ave | 0.39mi | 2/1.0 (-1) | 1,146 (+8%) | 9mo | $289,000 | $252 | 57 |
| 1200 Mohawk Ln | 0.62mi | 2/1.0 (-1) | 1,070 (+0%) | 12mo | $262,500 | $245 | 55 |
| 1018 Market St | 0.32mi | 2/2.0 (-1) | 954 (-10%) | 12mo | $214,000 | $224 | 49 |
Match score weights: distance 35% · size 25% · config 20% · recency 20%. Top-matched comps best support the ARV.
Projected returns pro-forma
-3.0% appreciation · 0.0% rent growth · sell at horizon
- IRR
- -10.2%
- Equity multiple
- 0.64×
- Total profit
- $-21,234
- Equity at exit
- $31,297
- IRR
- -5.5%
- Equity multiple
- 0.69×
- Total profit
- $-18,228
- Equity at exit
- $18,148
Cash invested: $58,772 (down + closing). Projections, not guarantees.
Landlord ↔ Tenant lean methodology
- Overall (STATE)
- 62 Landlord-Friendly
- State Michigan
- 62 Landlord-Friendly · EVEN
- County
- — inherits STATE
- City
- — inherits STATE
ZIP-level market 49085
- Rents YoY
- -0.2%
- Active inventory
- 221
- Price-to-rent
- 8.2×
Monthly cashflow live
- Estimated rent
- $2,143 medium interval (Pro) →
- Mortgage (P&I)
- −$1,101
- Tax from tax record
- −$206 /mo · $2,468/yr
- Insurance
- −$87
- HOA
- −$0
- Vacancy / Maint / Mgmt
- −$450
- Net cashflow
- $299
Break-even live
UW: 25.0% down · 7.5% · 30yr · 1.5% tax · 5.0% vac · 8.0% maint · 8.0% mgmt
Financing live
Cash to close
- Down payment
- $52,475
- Closing costs
- $6,297
- Reserves months
- —
- Total cash needed
- —
Loan-product check · same deal, 3 products live
Conventional
25% down · 7.5% · 30yr
- Down + closing
- —
- Monthly P&I
- —
- Monthly cashflow
- —
- DSCR
- —
- Eligible?
- —
Personal DTI + credit; lowest rate.
DSCR
20% down · 8.5% · 30yr
- Down + closing
- —
- Monthly P&I
- —
- Monthly cashflow
- —
- DSCR
- —
- Eligible?
- —
No personal income docs; deal must DSCR.
Hard money
10% down · 12.0% · 12mo
- Down + closing
- —
- Monthly P&I
- —
- Monthly cashflow
- —
- DSCR
- —
- Eligible?
- —
Short-term bridge; refi at stabilization.
Rent comps 1 comps
| Address | Beds | Baths | Sqft | Rent | $/sqft | DOM | Units | Dist |
|---|---|---|---|---|---|---|---|---|
| 187 Wayne St #13 Saint Joseph, MI | 3.0 | 2.0 | 1500 | $2,900 | $1.93 | 43d | 1 | 0.58mi |
Listing history 39 events
-
2026-04-30status Pending 316-char remark
Show marketing remark (316 chars)
Charming 3-bedroom, 1-bath home located in the heart of downtown St. Joseph. This well-maintained, move-in ready property offers a cozy and inviting atmosphere filled with character. New roof installed 2025. A great opportunity to own a home just moments from local shops, dining, and all that downtown has to offer.
-
2026-04-30status Pending
Show marketing remark (316 chars)
Charming 3-bedroom, 1-bath home located in the heart of downtown St. Joseph. This well-maintained, move-in ready property offers a cozy and inviting atmosphere filled with character. New roof installed 2025. A great opportunity to own a home just moments from local shops, dining, and all that downtown has to offer.
-
2026-04-20historical Accepting Backup Offers 316-char remark
Show marketing remark (316 chars)
Charming 3-bedroom, 1-bath home located in the heart of downtown St. Joseph. This well-maintained, move-in ready property offers a cozy and inviting atmosphere filled with character. New roof installed 2025. A great opportunity to own a home just moments from local shops, dining, and all that downtown has to offer.
-
2026-04-20historical Active Under Contract 316-char remark
Show marketing remark (316 chars)
Charming 3-bedroom, 1-bath home located in the heart of downtown St. Joseph. This well-maintained, move-in ready property offers a cozy and inviting atmosphere filled with character. New roof installed 2025. A great opportunity to own a home just moments from local shops, dining, and all that downtown has to offer.
-
2026-04-20historical Active - Backup Offers Accepted
Show marketing remark (316 chars)
Charming 3-bedroom, 1-bath home located in the heart of downtown St. Joseph. This well-maintained, move-in ready property offers a cozy and inviting atmosphere filled with character. New roof installed 2025. A great opportunity to own a home just moments from local shops, dining, and all that downtown has to offer.
-
2026-04-16$209,900 Active 316-char remark
Show marketing remark (316 chars)
Charming 3-bedroom, 1-bath home located in the heart of downtown St. Joseph. This well-maintained, move-in ready property offers a cozy and inviting atmosphere filled with character. New roof installed 2025. A great opportunity to own a home just moments from local shops, dining, and all that downtown has to offer.
-
2026-04-15$209,900 Active 316-char remark
Show marketing remark (316 chars)
Charming 3-bedroom, 1-bath home located in the heart of downtown St. Joseph. This well-maintained, move-in ready property offers a cozy and inviting atmosphere filled with character. New roof installed 2025. A great opportunity to own a home just moments from local shops, dining, and all that downtown has to offer.
-
2026-04-15$209,900 Active
Show marketing remark (316 chars)
Charming 3-bedroom, 1-bath home located in the heart of downtown St. Joseph. This well-maintained, move-in ready property offers a cozy and inviting atmosphere filled with character. New roof installed 2025. A great opportunity to own a home just moments from local shops, dining, and all that downtown has to offer.
-
2019-09-13soldstatus $133,000
-
2019-09-03soldstatus $133,000
-
2019-09-03soldstatus $133,000 Sold
-
2019-08-04historical Active Backup
-
2019-07-26status Active
-
2019-07-18historical Active Backup
-
2019-07-16price $139,900
-
2019-07-09price $149,900
-
2019-06-14price $159,900
-
2019-03-21$139,900
-
2019-03-21historical
-
2019-03-21$169,900 Active
-
2019-03-21$139,900
-
2019-03-21historical
-
2018-12-17historical
-
2018-10-23price $169,900
-
2018-09-07$169,900
-
2018-09-07$179,900 Active
-
2018-09-07$169,900
-
2018-06-07soldstatus $101,100
-
2018-06-06soldstatus $101,100
-
2018-06-06soldstatus $101,100 Sold
-
2018-05-26historical Active Backup
-
2018-05-16$99,900
-
2018-05-16$99,900 Active
-
2018-05-16$99,900
-
1995-05-19soldstatus $38,000
-
1995-05-19soldstatus $38,000
-
1995-04-11$47,500
-
1995-04-11$47,500
ⓘ Source: listings_history table (triggers on properties + properties_extension) + one-shot
backfill from property_details.listing_events for pre-trigger history.
Tax reassessment forecast MI · Partial reset (capped growth)
- Current annual tax
- $2,468 · $206/mo
- Projected year-2 tax
- $2,850 · $238/mo
- Expected delta
- +$382/yr (+$32/mo · 15.5%)
ⓘ Screening estimate from a state-policy table — verify with the county assessor before closing.
Climate risk First Street
- Flood 1/10 Low FEMA zone X (unshaded) · 0% chance over 30 yrs
- Wildfire 1/10 Low
- Heat 2/10 Low 7 d/yr ≥100°F today · 14 d/yr by 30 yrs out
- Wind 2/10 Low
- Air quality 5/10 Major 8 unhealthy d/yr today · 8 by 30 yrs out
Nearby sold comps map
Loading sold comps map…
Walkable amenities ~0.75 mi
Loading nearby amenities…
Taxation est. · year 1
- Rental income
- $25,719
- − Mortgage interest
- −$11,758
- − Property taxes
- −$2,468
- − Insurance
- −$1,050
- − Repairs & maintenance
- −$2,058
- − Management
- −$2,058
- − Depreciation
- −$6,106
- Taxable income
- $223
- Est. tax owed @ 24.0%
- −$53
- After-tax cash flow
- $3,538/yr
For passive investors: Depreciation is non-cash, so a rental often shows a tax loss while cash-flowing — sheltering income. Rental losses are passive: they offset passive income freely, and up to $25,000/yr can offset ordinary (W-2) income if you actively participate and your MAGI is under $100k (phasing out to $0 by $150k); unused losses carry forward. On sale, claimed depreciation is recaptured at up to 25%, and gains may owe capital-gains tax (a 1031 exchange can defer both). Figures are a year-1 estimate at your 24.0% rate — not tax advice; consult a CPA.
Schools (NCES district)
- District
- St. Joseph Public Schools
- NCES district ID
- 2632850
- Math proficiency
- 53% ▼ -12.00%
- Reading proficiency
- 64% ▼ -8.00%
- Median HH income
- $61,232
- Composite
- 50.87/100
- National rank
- #1795
- State rank
- #47 of 540 in MI
Livability — St. Joseph
No livability data for this city. (Only ~50 U.S. cities are tracked.)
Census & demographics
- Census place
- St. Joseph, MI
- County
- Berrien County · 71,477 people
- Metro
- Niles, MI
- Population (ZIP)
- 23,827
- Household income
- $104,969
- Rent vs Own
- Severe rent burden
- 277.0
Population outlook (Berrien County) Hauer SSP2
- Today (2025)
- 149,273 people
- By 2030
- 145,211 · -2.7%
- By 2040
- 135,435 · -9.3%
- By 2050
- 125,543 · -15.9%
- By 2075
- 103,986 · -30.3%
- By 2100
- 82,256 · -44.9%
Race, ethnicity, and origin ACS 2023
- Neighborhood character
- Predominantly White (85%)
- Race & ethnicity
- White 85% Two or more races 6% Asian 4% Hispanic / Latino 3% Black 3%
- Common ancestry
- Romanian 6% Iranian 4% Italian 4%
- Foreign-born
- 8% · Canada, China
- Languages at home
- 91% English-only · Other Indo-European 5% Spanish 1% Chinese 1%
Political lean MEDSL · Berrien
- 2024 margin
- Lean R (+7.9) · D 45.4% · R 53.2% · Other 1.4%
- 2008→2024 swing
- -13.3pp toward R · 2008: 5.5pp · 2024: -7.9pp
- All cycles
- 2024: R+7.9 2020: R+7.4 2016: R+12.7 2012: R+6.6 2008: D+5.5
Not yet ingested
- Civics
- —
Market trends
- HPI YoY
- ▼ -332.72%
- Current HPI
- 207.2281
- Rent YoY
- ▼ -0.24%
- Metro
- Niles, MI
- State GDP YoY
- ▲ 1.37%
- F500 in state
- 28
Industry mix (Fortune 500 HQ in MI)
| Industry | F500 HQs | Revenue |
|---|---|---|
| Automotive Parts | 3 | $48B |
|
||
| Automotive | 2 | $372B |
|
||
| Chemicals | 1 | $45B |
|
||
| Automotive Retail | 1 | $29B |
|
||
| Healthcare / Medical Devices | 1 | $23B |
|
||
| Automotive Technology | 1 | $20B |
|
||
Price history
+341.9% since first listed39 events — show timeline
- 2026-04-30 Pending — REALCOMP
- 2026-04-30 Pending — MiRealSource-MiMLS
- 2026-04-30 Pending — SW Michigan MLS
- 2026-04-20 Contingent — MiRealSource-MiMLS
- 2026-04-20 Contingent — REALCOMP
- 2026-04-20 Contingent — SW Michigan MLS
- 2026-04-16 Listed $209,900 REALCOMP
- 2026-04-15 Listed $209,900 SW Michigan MLS
- 2026-04-15 Listed $209,900 MiRealSource-MiMLS
- 2019-09-13 Sold (Public Records) $133,000 Public Records
- 2019-09-03 Sold (MLS) $133,000 SW Michigan MLS
- 2019-09-03 Sold (MLS) $133,000 REALCOMP
- 2019-08-04 Contingent — SW Michigan MLS
- 2019-07-26 Relisted — SW Michigan MLS
- 2019-07-18 Contingent — SW Michigan MLS
- 2019-07-16 Price Changed $139,900 SW Michigan MLS
- 2019-07-09 Price Changed $149,900 SW Michigan MLS
- 2019-06-14 Price Changed $159,900 SW Michigan MLS
- 2019-03-21 Listing Removed — MiRealSource-MiMLS
- 2019-03-21 Listed $139,900 MiRealSource-MiMLS
- 2019-03-21 Listed $169,900 SW Michigan MLS
- 2019-03-21 Listing Removed — REALCOMP
- 2019-03-21 Listed $139,900 REALCOMP
- 2018-12-17 Listing Removed — SW Michigan MLS
- 2018-10-23 Price Changed $169,900 SW Michigan MLS
- 2018-09-07 Listed $169,900 MiRealSource-MiMLS
- 2018-09-07 Listed $179,900 SW Michigan MLS
- 2018-09-07 Listed $169,900 REALCOMP
- 2018-06-07 Sold (Public Records) $101,100 Public Records
- 2018-06-06 Sold (MLS) $101,100 SW Michigan MLS
- 2018-06-06 Sold (MLS) $101,100 REALCOMP
- 2018-05-26 Contingent — SW Michigan MLS
- 2018-05-16 Listed $99,900 MiRealSource-MiMLS
- 2018-05-16 Listed $99,900 SW Michigan MLS
- 2018-05-16 Listed $99,900 REALCOMP
- 1995-05-19 Sold (MLS) $38,000 REALCOMP
- 1995-05-19 Sold (MLS) $38,000 SW Michigan MLS
- 1995-04-11 Listed $47,500 REALCOMP
- 1995-04-11 Listed $47,500 SW Michigan MLS
Property tax history
+15.4%/yrLatest (2024): $2,468 · +4.3% YoY. Source: county tax records.
Cash-flow waterfall
monthlySold comps — $/sqft
last 12 mo · ≤1 miLoading sold comps…