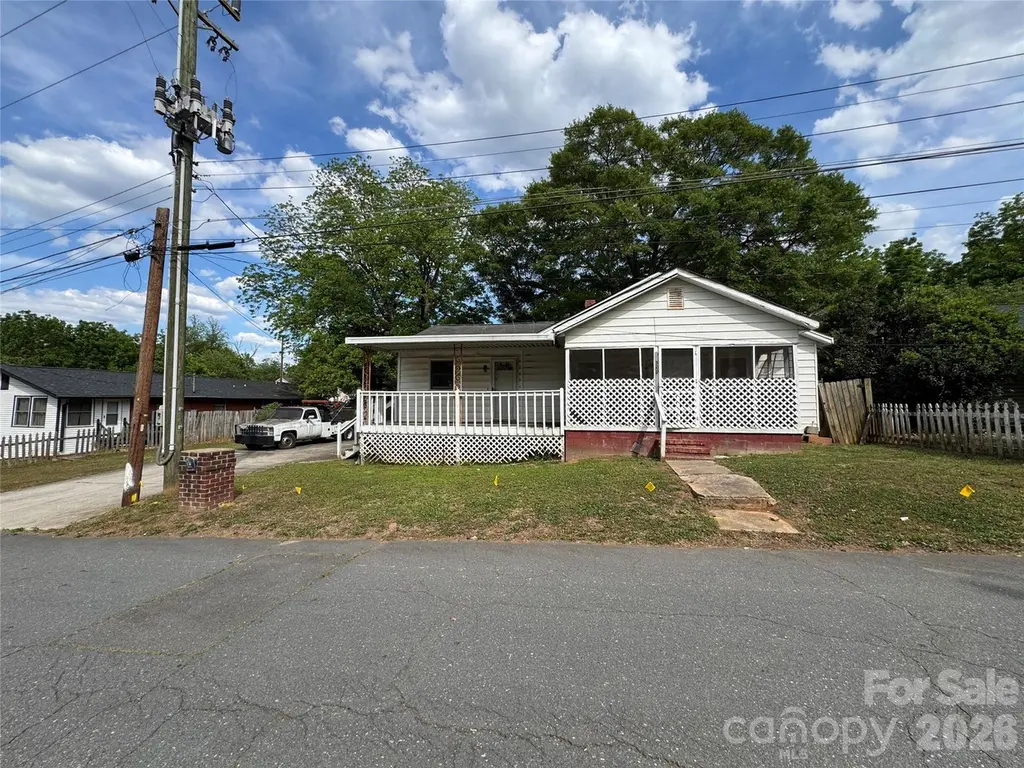
3209 Lasalle St · Charlotte, NC
Flood risk 3/10 · Minor
- FEMA flood zone
- X (unshaded)
- Chance of flooding over 30 yrs
- 0.1%
- Est. flood insurance / yr
- $507 – $1,088
Fire risk 1/10 · Minimal
- Est. fire insurance / yr
- $906 – $1,684
Heat risk 6/10 · Moderate
- Hot days now (above 103°F)
- 7 days/yr
- Hot days in 30 yrs
- 17 days/yr
Wind risk 6/10 · Moderate
- Chance of severe wind over 30 yrs
- 27.0%
Air-quality risk 3/10 · Minor
- Unhealthy air days now
- 3 days/yr
- Unhealthy air days in 30 yrs
- 4 days/yr
Risk factors via First Street. Map © Google.
Why this score? — see what drove the B grade
The composite is a weighted blend of 9 inputs, each scored 0–100. Each bar is that input's sub-score; the figure is the points it added to the 100-point composite (weight × sub-score).
- Cash flow +30.0/30.0
- 1% rule +10.0/10.0
- DSCR +10.0/10.0
- ARV discount +7.5/15.0
- Livability +3.9/5.0
- Schools +3.8/10.0
- Rent growth +3.0/5.0
- Condition / age +2.5/5.0
- Appreciation +0.0/10.0
$130,000
🖨 Deal sheet (PDF) 📄 Offer letter ✓ Due diligence
Listing remarks
Welcome to 3209 Lasalle Street, a charming Charlotte home full of character, opportunity, and convenience. Whether you’re a first-time buyer, investor, or someone looking to put down roots close to the heart of the city, this property offers the perfect blend of comfortand location. Perfect opportunity for an investor or the handy home buyer, who wants to put some equity into their next project! Don’t miss your chance to own a piece of Charlotte in a location that continues to grow in demand. Schedule your showing today!
Key facts
- 0.29 acre lot
- Built 1948
- Listed 7 days
Property features AI
Finance
- HOA & community: No HOA
Exterior
- Parking: Driveway
- Utilities: City water; Public sewer
- Home design: Single-family residential; One story; Site-built construction; Zoned N1-C; Entry level: main
- Construction: Aluminum and vinyl exterior; Crawl space foundation
- Exterior features: Covered, enclosed front porch
Interior
- Kitchen: No appliances included
- Bedrooms: 3 bedrooms on the main level
- Flooring: Carpet; Laminate; Tile
- Bathrooms: 2 full bathrooms on the main level
- Heating & cooling: Central heating; Central air conditioning
- Interior features: 9 total rooms; Den with fireplace
- Laundry & utility: Laundry details: Other — see remarks
Neighborhood map
What this means for you Summary
Snapshot
- This is a 2-bed/2.0-bath single-family listed at $130k.
Deal economics
- At list price, monthly cash flow is $763 ($9k/yr) — positive.
- The deal already cash-flows at list — no discount required.
- Meets the 1% rule at list price ($2k rent vs $130k).
- Cap rate 13.3% vs local median 3.1% in Charlotte — top-decile yield for the area; either an underpriced asset or a hidden risk that comps aren't pricing in. Stress-test before assuming the spread holds.
Location & tenants
- Location reads 78/100 on livability (#26 in NC, #2,502 nationally) — a middle-class / working-renter tenant base. Strengths: amenities A+, commute A+, housing A+; Watch: crime F.
- Charlotte-Mecklenburg Schools (urban): math 42% / reading 46% proficiency, ranked #85 of 178 in NC (top 48%) — families likely to look elsewhere, expect single-tenant / working-renter base with shorter leases.
- Zoned schools: Briarwood Academy (math 28% / reading 22%, grade F, #1,101 of 1,410 statewide, top 79%, 655 students, 99% FRL); Ranson Middle (math 12% / reading 18%, grade F, #459 of 475 statewide, top 97%, 817 students, 100% FRL); West Charlotte High School (math 33% / reading 34%, grade F, #436 of 535 statewide, top 82%, 1,538 students, 100% FRL) — zoned schools average 100% FRL vs 49% district-wide (51 pts higher); higher-poverty schools than district average — tighter screening recommended.
- Zoned-school proficiency averages 24% at this address vs 44% district-wide (-20 pts) — the specific schools serving this property underperform the Charlotte-Mecklenburg Schools average; the district grade overstates school quality for this exact location.
- Market conditions: Rents rising (+2.1%/yr); 462 active listings in the ZIP; 40 comparable units currently listed for rent nearby; rentals at typical pace (median 25d on market — plan ~3-4 weeks tenant-placement turnaround); 11,969 units permitted in Mecklenburg County in 2024 (5,377 in 5+ unit buildings).
- This rent runs 38% of the median local income ($66k/yr) — at the standard rent-burdened threshold; future hikes will face affordability resistance.
Forward outlook
- Local home prices are declining (-3.0%/yr); year-one equity from $899 of loan paydown is wiped out by about $4k of value loss. Plan a longer hold.
- Mecklenburg County population projected at +53% by 2050 — long-run rental-demand tailwind backs the buy-and-hold thesis.
- At projected returns (-3.0% appreciation + 2.1% rent growth), your $36k cash investment doubles in ~6 years — after that, you're playing with house money.
Negotiation context
- Only 7 days on market — expect competitive offers; lowballing is unlikely to land.
- Current owner paid $37k; list at $130k implies a 251% gain — meaningful room to come down on a strong offer.
Risks & watch-outs
- Watch-outs: built in 1948 — expect roof / HVAC / electrical / plumbing capex.
- Climate carrying-cost: major wind risk, 27% chance of damaging wind over 30y; extreme-heat days projected 7→17/yr by 2055 (HVAC capex compounding) — expect insurance premiums to compound above CPI over the hold.
Questions for the listing agent
- Built in 1948 — when were the roof, HVAC, electrical panel, plumbing, and water heater last replaced?
- Is there a deadline driving the sale (1031 exchange, divorce, estate, relocation)? That informs how much negotiation room exists.
- Schools are D-rated, which usually means shorter tenancies and higher turnover. Who's the typical renter profile here, and what's been the actual vacancy rate?
- Crime grade is F in this area — have there been break-ins, vandalism, or insurance claims at this property in the last 3 years? What carrier currently insures it and at what premium?
- What's the average days-on-market for RENTAL listings here right now (not sales)? A rising rental-DOM trend means longer vacancies and softer asking-rent achievability than the comps imply.
- What's the recent tenant-quality profile in this submarket — average credit score on applications, eviction rate, late-payment / NSF rate, and stable-employment percentage? A property-management company in the area should have these aggregated.
- How much new for-sale + rental construction is in the pipeline within 1–3 miles? Heavy new supply typically softens prices + rents 12–24 months out; constrained supply supports both.
Investment metrics
- 1% rule
- 1.60% ✓
- Cap rate
- 13.33%
- Cash-on-cash
- 25.14%
- DSCR
- 2.12
- GRM
- 5.2
CMA / ARV
- ARV (on-the-fly)
- $308,034
- Comps found
- 12
Show comp detail 12 sales within ~0.75 mi
| Address | Dist | Beds/Ba | Sqft | Sold | Price | $/sf | Match |
|---|---|---|---|---|---|---|---|
| 3020 Bellaire Dr | 0.24mi | 3/2.5 (+1) | 1,400 (-1%) | 15mo | $357,500 | $255 | 68 |
| 161 N Smallwood Pl | 0.44mi | 3/2.0 (+1) | 1,385 (-2%) | 4mo | $520,000 | $375 | 68 |
| 1827 Mcdonald St | 0.38mi | 3/2.5 (+1) | 1,446 (+2%) | 13mo | $280,000 | $194 | 60 |
| 2908 Bellaire Dr | 0.35mi | 3/1.5 (+1) | 1,337 (-5%) | 14mo | $269,000 | $201 | 56 |
| 501 Seldon Dr | 0.55mi | 3/2.0 (+1) | 1,294 (-8%) | 3mo | $505,000 | $390 | 53 |
| 2138 Syracuse Dr | 0.44mi | 3/2.0 (+1) | 1,301 (-8%) | 12mo | $315,000 | $242 | 51 |
| 124 Lakewood Ave | 0.57mi | 3/2.0 (+1) | 1,465 (+4%) | 14mo | $260,750 | $178 | 50 |
| 2501 Booker Ave | 0.47mi | 3/2.0 (+1) | 1,288 (-9%) | 12mo | $235,000 | $182 | 48 |
| 2321 Dundeen St | 0.52mi | 3/2.0 (+1) | 1,204 (-15%) | 3mo | $139,000 | $115 | 43 |
| 337 Lakewood Ave | 0.69mi | 3/1.5 (+1) | 1,292 (-9%) | 6mo | $310,000 | $240 | 41 |
| 2101 Russell Ave | 0.72mi | 3/1.5 (+1) | 1,352 (-4%) | 13mo | $255,000 | $189 | 41 |
| 2325 Sanders Ave | 0.58mi | 3/2.0 (+1) | 1,266 (-10%) | 13mo | $276,300 | $218 | 40 |
Match score weights: distance 35% · size 25% · config 20% · recency 20%. Top-matched comps best support the ARV.
Projected returns pro-forma
-3.0% appreciation · 2.08% rent growth · sell at horizon
- IRR
- 17.6%
- Equity multiple
- 1.70×
- Total profit
- $25,617
- Equity at exit
- $19,383
- IRR
- 25.4%
- Equity multiple
- 3.12×
- Total profit
- $77,243
- Equity at exit
- $11,240
Cash invested: $36,400 (down + closing). Projections, not guarantees.
Landlord ↔ Tenant lean methodology
- Overall (STATE)
- 85 Strongly Landlord-Friendly
- State North Carolina
- 85 Strongly Landlord-Friendly · R+3
- County
- — inherits STATE
- City
- — inherits STATE
ZIP-level market 28216
- Home prices YoY
- -31.8%
- Rents YoY
- 2.1%
- Active inventory
- 462
- Price-to-rent
- 5.2×
Monthly cashflow live
- Estimated rent
- $2,082 high interval (Pro) →
- Mortgage (P&I)
- −$682
- Tax from tax record
- −$147 /mo · $1,760/yr
- Insurance
- −$54
- HOA
- −$0
- Vacancy / Maint / Mgmt
- −$437
- Net cashflow
- $763
Break-even live
Sensitivity live
| Price | -10% $836 | -5% $799 | +0% $763 | +5% $726 | +10% $689 |
|---|---|---|---|---|---|
| Rent | -10% $598 | -5% $680 | +0% $763 | +5% $845 | +10% $927 |
| Rate | -1.0pp $828 | -0.5pp $796 | base $763 | +0.5pp $729 | +1.0pp $695 |
UW: 25.0% down · 7.5% · 30yr · 1.5% tax · 5.0% vac · 8.0% maint · 8.0% mgmt
Financing live
Cash to close
- Down payment
- $32,500
- Closing costs
- $3,900
- Reserves months
- —
- Total cash needed
- —
Loan-product check · same deal, 3 products live
Conventional
25% down · 7.5% · 30yr
- Down + closing
- —
- Monthly P&I
- —
- Monthly cashflow
- —
- DSCR
- —
- Eligible?
- —
Personal DTI + credit; lowest rate.
DSCR
20% down · 8.5% · 30yr
- Down + closing
- —
- Monthly P&I
- —
- Monthly cashflow
- —
- DSCR
- —
- Eligible?
- —
No personal income docs; deal must DSCR.
Hard money
10% down · 12.0% · 12mo
- Down + closing
- —
- Monthly P&I
- —
- Monthly cashflow
- —
- DSCR
- —
- Eligible?
- —
Short-term bridge; refi at stabilization.
Rent comps 40 comps
| Address | Beds | Baths | Sqft | Rent | $/sqft | DOM | Units | Dist |
|---|---|---|---|---|---|---|---|---|
| 3221 Lasalle St Charlotte, NC | 3.0 | 2.0 | 1110 | $1,773 | $1.60 | 25d | 1 | 0.03mi |
| 2715 Dundeen St Charlotte, NC | 2.0 | 1.0 | 900 | $1,200 | $1.33 | 25d | 1 | 0.24mi |
| 2700 Pitts Dr Charlotte, NC | 2.0 | 1.0 | 900 | $1,315 | $1.46 | 25d | 1 | 0.25mi |
| 3016 Colfax St Charlotte, NC | 3.0 | 1.0 | 1066 | $1,495 | $1.40 | 17d | 1 | 0.28mi |
| 2827 Burbank Dr Charlotte, NC | 3.0 | 1.0 | 1000 | $1,495 | $1.50 | 16d | 1 | 0.38mi |
| 124 Judson Ave Charlotte, NC | 1.0 | 1.0 | 1560 | $1,045 | $0.67 | 25d | 1 | 0.38mi |
| 2635 W Trade St Charlotte, NC | 3.0–4.0 | 3.5 | 1723 | $2,425 | $1.41 | 9d | 6 | 0.42mi |
| 2508 Booker Ave Charlotte, NC | 3.0 | 2.0 | 1183 | $1,995 | $1.69 | 15d | 1 | 0.42mi |
| 4139 Walking Ridge Rd Charlotte, NC | 3.0 | 2.5 | 1617 | $2,300 | $1.42 | 25d | 1 | 0.43mi |
| 309 Centre St Charlotte, NC | 3.0 | 2.5 | 1579 | $1,895 | $1.20 | 25d | 1 | 0.47mi |
| 3115 Southwest Blvd Charlotte, NC | 2.0–3.0 | 1.0–2.0 | 999 | $1,075 | $1.08 | 25d | 1 | 0.49mi |
| 142 Mattoon St Charlotte, NC | 3.0 | 3.5 | 1846 | $2,800 | $1.52 | 15d | 1 | 0.52mi |
| 144 Mattoon St Charlotte, NC | 3.0 | 3.5 | 1846 | $2,700 | $1.46 | 15d | 1 | 0.52mi |
| 144 Mattoon St Charlotte, NC | 3.0 | 3.5 | 1846 | $2,700 | $1.46 | 15d | 1 | 0.52mi |
| 3311 Rozzelles Ferry Rd Unit 104 Charlotte, NC | 3.0 | 2.0 | 1160 | $1,601 | $1.38 | 6d | 1 | 0.54mi |
| 3311 Rozzelles Ferry Rd Unit 101 Charlotte, NC | 2.0 | 2.0 | 918 | $1,456 | $1.59 | 17d | 1 | 0.54mi |
| 2743 Rozzelles Ferry Rd Charlotte, NC | 3.0 | 3.5 | 1673 | $2,899 | $1.73 | 25d | 1 | 0.57mi |
| 637 Ethridge Pl Charlotte, NC | 3.0 | 3.5 | 1572 | $2,096 | $1.33 | 0d | 12 | 0.57mi |
| 2146 Caldera St Charlotte, NC | 3.0 | 3.5 | 1617 | $3,299 | $2.04 | 25d | 1 | 0.57mi |
| 2741 Rozzelles Ferry Rd Charlotte, NC | 3.0 | 3.5 | 1673 | $2,899 | $1.73 | 25d | 1 | 0.57mi |
| 2227 Celia Ave Charlotte, NC | 3.0 | 2.0 | 1236 | $2,000 | $1.62 | 11d | 1 | 0.57mi |
| 2136 Caldera St Charlotte, NC | 3.0 | 3.5 | 1617 | $3,299 | $2.04 | 25d | 1 | 0.58mi |
| 2132 Caldera St Charlotte, NC | 3.0 | 3.5 | 1617 | $3,299 | $2.04 | 25d | 1 | 0.58mi |
| 212 Mattoon St Charlotte, NC | 3.0 | 3.5 | 1832 | $2,525 | $1.38 | 23d | 1 | 0.58mi |
| 2116 Caldera St Charlotte, NC | 3.0 | 3.5 | 1617 | $3,299 | $2.04 | 25d | 1 | 0.59mi |
| 2701 Rozzelles Ferry Rd Charlotte, NC | 3.0 | 4.0 | 1617 | $2,499 | $1.55 | 25d | 1 | 0.59mi |
| 2713 Rozzelles Ferry Rd Charlotte, NC | 3.0 | 3.5 | 1673 | $2,899 | $1.73 | 25d | 1 | 0.60mi |
| 2004 Caldera St Charlotte, NC | 3.0 | 3.5 | 1617 | $3,299 | $2.04 | 25d | 1 | 0.63mi |
| 2623 Rozzelles Ferry Rd Charlotte, NC | 3.0 | 3.5 | 1617 | $3,299 | $2.04 | 17d | 1 | 0.64mi |
| 1407 Fairmont St Charlotte, NC | 2.0 | 1.0 | 1000 | $1,465 | $1.47 | 9d | 1 | 0.70mi |
| 2244 English Dr Charlotte, NC | 3.0 | 1.0 | 962 | $1,550 | $1.61 | 25d | 1 | 0.72mi |
| 214 S Gardner Ave Charlotte, NC | 2.0 | 1.0 | 930 | $1,650 | $1.77 | 6d | 1 | 0.75mi |
| 517 N Linwood Ave Charlotte, NC | 3.0 | 2.0 | 1154 | $1,973 | $1.71 | 17d | 1 | 0.83mi |
| 2544 Abelwood Rd Charlotte, NC | 3.0 | 1.0 | 975 | $1,495 | $1.53 | 25d | 1 | 0.84mi |
| 550 Beatties Ford Rd Charlotte, NC | 3.0 | 3.5 | 1627 | $2,295 | $1.41 | 25d | 1 | 0.85mi |
| 546 Beatties Ford Rd Charlotte, NC | 3.0 | 3.5 | 1664 | $2,165 | $1.30 | 25d | 1 | 0.86mi |
| 542 Beatties Ford Rd Charlotte, NC | 3.0 | 3.5 | 1664 | $2,165 | $1.30 | 25d | 1 | 0.86mi |
| 538 Beatties Ford Rd Charlotte, NC | 3.0 | 3.5 | 1664 | $2,165 | $1.30 | 25d | 1 | 0.86mi |
| 534 Beatties Ford Rd Charlotte, NC | 3.0 | 3.5 | 1664 | $2,195 | $1.32 | 25d | 1 | 0.86mi |
| 528 Beatties Ford Rd Charlotte, NC | 3.0 | 3.5 | 1664 | $2,195 | $1.32 | 25d | 1 | 0.86mi |
Listing history 2 events
-
2026-05-22$130,000 Active
-
1997-07-21soldstatus $37,000
ⓘ Source: listings_history table (triggers on properties + properties_extension) + one-shot
backfill from property_details.listing_events for pre-trigger history.
Tax reassessment forecast NC · Resets to sale price
- Current annual tax
- $1,760 · $147/mo
- Projected year-2 tax
- $1,760 · $147/mo
- Expected delta
- $0/yr ($0/mo · 0.0%)
ⓘ Screening estimate from a state-policy table — verify with the county assessor before closing.
Climate risk First Street
- Flood 3/10 Moderate FEMA zone X (unshaded) · 10% chance over 30 yrs
- Wildfire 1/10 Low
- Heat 6/10 Major 7 d/yr ≥103°F today · 17 d/yr by 30 yrs out
- Wind 6/10 Major 27% chance of damaging wind over 30 yrs
- Air quality 3/10 Moderate 3 unhealthy d/yr today · 4 by 30 yrs out
Nearby sold comps map
Loading sold comps map…
Walkable amenities ~0.75 mi
Loading nearby amenities…
Taxation est. · year 1
- Rental income
- $24,990
- − Mortgage interest
- −$7,282
- − Property taxes
- −$1,760
- − Insurance
- −$650
- − Repairs & maintenance
- −$1,999
- − Management
- −$1,999
- − Depreciation
- −$3,782
- Taxable income
- $7,518
- Est. tax owed @ 24.0%
- −$1,804
- After-tax cash flow
- $7,347/yr
For passive investors: Depreciation is non-cash, so a rental often shows a tax loss while cash-flowing — sheltering income. Rental losses are passive: they offset passive income freely, and up to $25,000/yr can offset ordinary (W-2) income if you actively participate and your MAGI is under $100k (phasing out to $0 by $150k); unused losses carry forward. On sale, claimed depreciation is recaptured at up to 25%, and gains may owe capital-gains tax (a 1031 exchange can defer both). Figures are a year-1 estimate at your 24.0% rate — not tax advice; consult a CPA.
Schools (NCES district)
- District
- Charlotte-Mecklenburg Schools
- NCES district ID
- 3702970
- Math proficiency
- 42% ▼ -6.00%
- Reading proficiency
- 46% ▲ 1.00%
- Median HH income
- $57,175
- Composite
- 38.49/100
- National rank
- #4183
- State rank
- #85 of 178 in NC
Livability — Charlotte
- Score
- 78/100
- State rank
- #26
- US rank
- #2502
Category grades
Schools grade is shown separately in the Schools card above.
Census & demographics
- Census place
- Charlotte, NC
- County
- Mecklenburg County · 1,167,319 people
- City population
- 920,422
- Metro
- Charlotte-Concord-Gastonia, NC-SC
- Population (ZIP)
- 57,507
- Household income
- $65,795
- Rent vs Own
- Severe rent burden
- 3184.0
Population outlook (Mecklenburg County) Hauer SSP2
- Today (2025)
- 1,305,740 people
- By 2030
- 1,442,752 · +10.5%
- By 2040
- 1,722,441 · +31.9%
- By 2050
- 1,999,450 · +53.1%
- By 2075
- 2,642,495 · +102.4%
- By 2100
- 3,106,755 · +137.9%
Race, ethnicity, and origin ACS 2023
- Neighborhood character
- Diverse neighborhood (Simpson 0.58)
- Race & ethnicity
- Black 60% White 20% Hispanic / Latino 12% Asian 5% Two or more races 4%
- Hispanic origin (detail)
- Mexican 5%
- Common ancestry
- Romanian 1% Slovak 1% Lithuanian 1%
- Foreign-born
- 13% · Canada, Vietnam, Philippines
- Languages at home
- 82% English-only · Spanish 11% Other Asian/Pacific 2% Other Indo-European 1%
Political lean MEDSL · Mecklenburg
- 2024 margin
- Solid D (+32.9) · D 65.6% · R 32.7% · Other 1.6%
- 2008→2024 swing
- +8.5pp toward D · 2008: 24.4pp · 2024: 32.9pp
- All cycles
- 2024: D+32.9 2020: D+35.1 2016: D+29.9 2012: D+22.5 2008: D+24.4
Not yet ingested
- Civics
- —
Market trends
- HPI YoY
- ▼ -130.17%
- Current HPI
- 278.6861
- Rent YoY
- ▲ 2.08%
- Metro
- Charlotte-Concord-Gastonia, NC-SC
- State GDP YoY
- ▲ 3.28%
- F500 in state
- 26
Industry mix (Fortune 500 HQ in NC)
| Industry | F500 HQs | Revenue |
|---|---|---|
| Financial Services | 2 | $213B |
|
||
| Retail | 2 | $95B |
|
||
| Industrial Conglomerate | 1 | $38B |
|
||
| Metals / Steel | 1 | $35B |
|
||
| Utilities | 1 | $30B |
|
||
| Industrial Machinery | 1 | $19B |
|
||
Price history
+251.4% since first listed2 events — show timeline
- 2026-05-22 Listed $130,000 CANOPYMLS as Distributed by MLS Grid
- 1997-07-21 Sold (Public Records) $37,000 Public Records
Property tax history
+4.7%/yrLatest (2025): $1,760 · +2.4% YoY. Source: county tax records.
Cash-flow waterfall
monthlySold comps — $/sqft
last 12 mo · ≤1 miLoading sold comps…