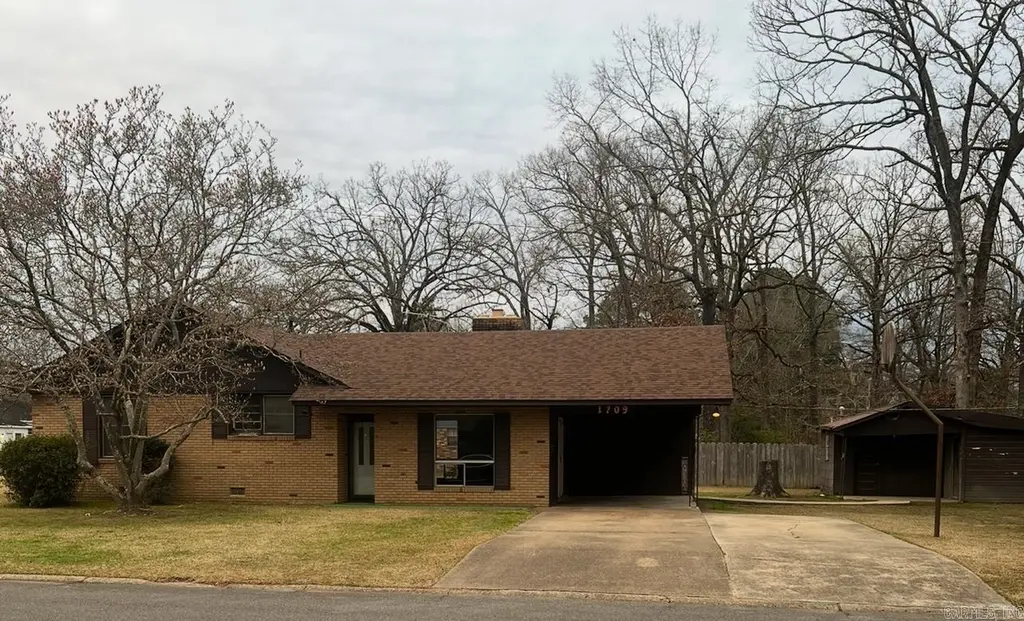
1209 Oak Ave · Crossett, AR
Flood risk 1/10 · Minimal
- FEMA flood zone
- X (unshaded)
- Chance of flooding over 30 yrs
- 0.0%
- Est. flood insurance / yr
- $507 – $1,088
Fire risk 2/10 · Minimal
- Est. fire insurance / yr
- $1,499 – $2,785
Heat risk 6/10 · Moderate
- Hot days now (above 109°F)
- 7 days/yr
- Hot days in 30 yrs
- 20 days/yr
Wind risk 6/10 · Moderate
- Chance of severe wind over 30 yrs
- 57.0%
Air-quality risk 1/10 · Minimal
- Unhealthy air days now
- 0 days/yr
- Unhealthy air days in 30 yrs
- 0 days/yr
Risk factors via First Street. Map © Google.
Why this score? — see what drove the B grade
The composite is a weighted blend of 9 inputs, each scored 0–100. Each bar is that input's sub-score; the figure is the points it added to the 100-point composite (weight × sub-score).
- Cash flow +30.0/30.0
- ARV discount +15.0/15.0
- DSCR +10.0/10.0
- 1% rule +7.7/10.0
- Livability +3.0/5.0
- Rent growth +2.5/5.0
- Condition / age +2.5/5.0
- Schools +1.7/10.0
- Appreciation +0.0/10.0
$82,500
🖨 Deal sheet 📄 Offer letter ✓ Due diligence
Listing remarks MLS
Great starter home or investment property. Home features a grand living room with beautiful fireplace, large eat-in kitchen with dining area, 3 bedrooms, one and a half bathrooms, central heat and air, large yard with a huge storage shed with concrete floors.
Key facts
- Grand living room
- Huge storage shed
- Large eat-in kitchen
Tags
Neighborhood map
What this means for you Summary
Snapshot
- This is a 3-bed/1.5-bath single-family listed at $82k.
Deal economics
- At list price, monthly cash flow is $309 ($4k/yr) — positive.
- The deal already cash-flows at list — no discount required.
- Meets the 1% rule at list price ($1k rent vs $82k).
- Recommended offer: $75k (9.0% below list) — sets the bar for market timing.
- Cap rate 10.8% vs local median 5.4% in Crossett — top-decile yield for the area; either an underpriced asset or a hidden risk that comps aren't pricing in. Stress-test before assuming the spread holds.
Location & tenants
- Location reads 59/100 on livability (#299 in AR) — a working-class tenant base; expect higher turnover. Strengths: cost of living A+, housing A+, health & safety A+; Watch: employment D+, schools D-, crime F.
- Crossett School District (town): math 19% / reading 21% proficiency, ranked #213 of 238 in AR (top 90%) — low school quality limits family demand, transient renter base, plan for 1-2y turnover.
- Market conditions: 56 active listings in the ZIP.
Forward outlook
- Local home prices are declining (-3.0%/yr); year-one equity from $570 of loan paydown is wiped out by about $2k of value loss. Plan a longer hold.
- Ashley County population projected at -30% by 2050 — secular population decline; favor cash flow + early exit over multi-decade hold.
- At projected returns (-3.0% appreciation + 3.0% rent growth), your $23k cash investment doubles in ~8 years — after that, you're playing with house money.
Negotiation context
- It's been on market 116 days — a 9% lower offer ($75k) is reasonable based on typical stale-listing flexibility.
- 3 sale attempts with the ask held roughly flat each time — persistent listings suggest the price (not the market) is what's stuck; bring a comps-based counter.
Risks & watch-outs
- Watch-outs: built in 1951 — expect roof / HVAC / electrical / plumbing capex.
- Climate carrying-cost: major wind risk, 57% chance of damaging wind over 30y; extreme-heat days projected 7→20/yr by 2055 (HVAC capex compounding) — expect insurance premiums to compound above CPI over the hold.
Questions for the listing agent
- It's been on market 116 days. Have you received any prior offers? Is the seller open to a 9% concession, seller financing, or rate buy-down credit?
- Built in 1951 — when were the roof, HVAC, electrical panel, plumbing, and water heater last replaced?
- Why hasn't it sold? Are there any deal-killer items the seller is aware of (foundation, flood, title, zoning, code violations)?
- Is there a deadline driving the sale (1031 exchange, divorce, estate, relocation)? That informs how much negotiation room exists.
- Schools are D-rated, which usually means shorter tenancies and higher turnover. Who's the typical renter profile here, and what's been the actual vacancy rate?
- Crime grade is F in this area — have there been break-ins, vandalism, or insurance claims at this property in the last 3 years? What carrier currently insures it and at what premium?
- What's the average days-on-market for RENTAL listings here right now (not sales)? A rising rental-DOM trend means longer vacancies and softer asking-rent achievability than the comps imply.
- What's the recent tenant-quality profile in this submarket — average credit score on applications, eviction rate, late-payment / NSF rate, and stable-employment percentage? A property-management company in the area should have these aggregated.
- How much new for-sale + rental construction is in the pipeline within 1–3 miles? Heavy new supply typically softens prices + rents 12–24 months out; constrained supply supports both.
Investment metrics
- 1% rule
- 1.27% ✓
- Cap rate
- 10.79%
- Cash-on-cash
- 16.05%
- DSCR
- 1.71
- GRM
- 6.6
CMA / ARV
- ARV (median comp)
- $132,927
- List price
- $82,500
- Delta
- -37.94%
- Verdict
- UNDERPRICED
- Comps
- 20 within 1.0 mi
Show comp detail 10 sales within ~0.75 mi
| Address | Dist | Beds/Ba | Sqft | Sold | Price | $/sf | Match |
|---|---|---|---|---|---|---|---|
| 1412 Chestnut St | 0.47mi | 3/2.0 | 1,408 (+5%) | 2mo | $165,000 | $117 | 65 |
| 1107 Oak | 0.11mi | 2/1.0 (-1) | 1,192 (-11%) | 8mo | $72,000 | $60 | 62 |
| 803 Walnut St | 0.63mi | 2/1.0 (-1) | 1,296 (-3%) | 4mo | $60,000 | $46 | 54 |
| 1306 Cypress St | 0.36mi | 3/2.0 | 1,471 (+10%) | 14mo | $129,000 | $88 | 53 |
| 1205 Hickory St | 0.33mi | 3/2.0 | 1,530 (+14%) | 10mo | $160,000 | $105 | 51 |
| 1004 Cedar St | 0.31mi | 3/2.0 | 1,196 (-11%) | 21mo | $62,000 | $52 | 48 |
| 107 Williams | 0.68mi | 3/2.0 | 1,230 (-8%) | 9mo | $95,000 | $77 | 45 |
| 1104 Parkway | 0.61mi | 3/1.0 | 1,215 (-9%) | 12mo | $40,000 | $33 | 44 |
| 708 Walnut | 0.65mi | 3/2.0 | 1,470 (+10%) | 11mo | $43,000 | $29 | 42 |
| 204 Williams St | 0.72mi | 2/2.0 (-1) | 1,430 (+7%) | 8mo | $80,000 | $56 | 42 |
Match score weights: distance 35% · size 25% · config 20% · recency 20%. Top-matched comps best support the ARV.
Projected returns pro-forma
-3.0% appreciation · 3.0% rent growth · sell at horizon
- IRR
- 7.0%
- Equity multiple
- 1.27×
- Total profit
- $6,295
- Equity at exit
- $12,301
- IRR
- 16.3%
- Equity multiple
- 2.33×
- Total profit
- $30,753
- Equity at exit
- $7,133
Cash invested: $23,100 (down + closing). Projections, not guarantees.
Landlord ↔ Tenant lean methodology
- Overall (STATE)
- 92 Strongly Landlord-Friendly
- State Arkansas
- 92 Strongly Landlord-Friendly · R+14
- County
- — inherits STATE
- City
- — inherits STATE
ZIP-level market 71635
- Home prices YoY
- -30.4%
- Active inventory
- 56
- Price-to-rent
- 6.6×
Monthly cashflow live
- Estimated rent
- $1,045 medium interval (Pro) →
- Mortgage (P&I)
- −$433
- Tax from tax record
- −$49 /mo · $592/yr
- Insurance
- −$34
- HOA
- −$0
- Vacancy / Maint / Mgmt
- −$219
- Net cashflow
- $309
Break-even live
UW: 25.0% down · 7.5% · 30yr · 1.5% tax · 5.0% vac · 8.0% maint · 8.0% mgmt
Financing live
Cash to close
- Down payment
- $20,625
- Closing costs
- $2,475
- Reserves months
- —
- Total cash needed
- —
Loan-product check · same deal, 3 products live
Conventional
25% down · 7.5% · 30yr
- Down + closing
- —
- Monthly P&I
- —
- Monthly cashflow
- —
- DSCR
- —
- Eligible?
- —
Personal DTI + credit; lowest rate.
DSCR
20% down · 8.5% · 30yr
- Down + closing
- —
- Monthly P&I
- —
- Monthly cashflow
- —
- DSCR
- —
- Eligible?
- —
No personal income docs; deal must DSCR.
Hard money
10% down · 12.0% · 12mo
- Down + closing
- —
- Monthly P&I
- —
- Monthly cashflow
- —
- DSCR
- —
- Eligible?
- —
Short-term bridge; refi at stabilization.
Listing history 22 events
-
2026-06-19days on market $82,500 Active 116 DOM
-
2026-06-18days on market $82,500 Active 115 DOM
-
2026-06-17days on market $82,500 Active 114 DOM
-
2026-06-16days on market $82,500 Active 113 DOM
-
2026-06-15days on market $82,500 Active 112 DOM
-
2026-06-14days on market $82,500 Active 110 DOM
-
2026-06-12days on market $82,500 Active 109 DOM
-
2026-06-09days on market $82,500 Active 106 DOM
-
2026-06-08days on market $82,500 Active 105 DOM
-
2026-06-07days on market $82,500 Active 104 DOM
-
2026-06-05days on market $82,500 Active 102 DOM
-
2026-06-04days on market $82,500 Active 100 DOM
-
2026-06-02days on market $82,500 Active 99 DOM
-
2026-06-01days on market $82,500 Active 98 DOM
-
2026-05-31days on market $82,500 Active 97 DOM
-
2026-05-31days on market $82,500 Active 96 DOM
-
2026-02-23$82,500 New Listing 259-char remark
Show marketing remark (259 chars)
Great starter home or investment property. Home features a grand living room with beautiful fireplace, large eat-in kitchen with dining area, 3 bedrooms, one and a half bathrooms, central heat and air, large yard with a huge storage shed with concrete floors.
-
2026-02-12historical
-
2025-08-27price $82,500
-
2025-08-26status Price Change
-
2025-08-25historical
-
2025-02-24$85,000 New Listing
ⓘ Source: listings_history table (triggers on properties + properties_extension) + one-shot
backfill from property_details.listing_events for pre-trigger history.
Tax reassessment forecast AR · Resets to sale price
- Current annual tax
- $592 · $49/mo
- Projected year-2 tax
- $592 · $49/mo
- Expected delta
- $0/yr ($0/mo · 0.0%)
ⓘ Screening estimate from a state-policy table — verify with the county assessor before closing.
Climate risk First Street
- Flood 1/10 Low FEMA zone X (unshaded) · 0% chance over 30 yrs
- Wildfire 2/10 Low
- Heat 6/10 Major 7 d/yr ≥109°F today · 20 d/yr by 30 yrs out
- Wind 6/10 Major 57% chance of damaging wind over 30 yrs
- Air quality 1/10 Low 0 unhealthy d/yr today · 0 by 30 yrs out
Nearby sold comps map
Loading sold comps map…
Walkable amenities ~0.75 mi
Loading nearby amenities…
Taxation est. · year 1
- Rental income
- $12,537
- − Mortgage interest
- −$4,621
- − Property taxes
- −$592
- − Insurance
- −$412
- − Repairs & maintenance
- −$1,003
- − Management
- −$1,003
- − Depreciation
- −$2,400
- Taxable income
- $2,505
- Est. tax owed @ 24.0%
- −$601
- After-tax cash flow
- $3,107/yr
For passive investors: Depreciation is non-cash, so a rental often shows a tax loss while cash-flowing — sheltering income. Rental losses are passive: they offset passive income freely, and up to $25,000/yr can offset ordinary (W-2) income if you actively participate and your MAGI is under $100k (phasing out to $0 by $150k); unused losses carry forward. On sale, claimed depreciation is recaptured at up to 25%, and gains may owe capital-gains tax (a 1031 exchange can defer both). Figures are a year-1 estimate at your 24.0% rate — not tax advice; consult a CPA.
Schools (NCES district)
- District
- Crossett School District
- NCES district ID
- 0504800
- Math proficiency
- 19% ▼ -16.00%
- Reading proficiency
- 21% ▼ -10.00%
- Median HH income
- $37,682
- Composite
- 16.73/100
- National rank
- #9162
- State rank
- #213 of 238 in AR
Livability — Crossett
- Score
- 59/100
- State rank
- #299
- US rank
- #20393
Category grades
Schools grade is shown separately in the Schools card above.
Census & demographics
- Census place
- Crossett, AR
- Population (ZIP)
- 10,368
Population outlook (Ashley County) Hauer SSP2
- Today (2025)
- 18,757 people
- By 2030
- 17,541 · -6.5%
- By 2040
- 15,243 · -18.7%
- By 2050
- 13,136 · -30.0%
- By 2075
- 8,901 · -52.5%
- By 2100
- 5,626 · -70.0%
Race, ethnicity, and origin ACS 2023
- Neighborhood character
- Predominantly White (67%)
- Race & ethnicity
- White 67% Black 28% Hispanic / Latino 2% Two or more races 2%
- Common ancestry
- Slovak 1% Italian 1% Lithuanian 1%
- Foreign-born
- 0% · Canada
- Languages at home
- 98% English-only · Spanish 1%
Political lean MEDSL · Ashley
- 2024 margin
- Solid R (+48.0) · D 25.2% · R 73.2% · Other 1.6%
- 2008→2024 swing
- -19.9pp toward R · 2008: -28.1pp · 2024: -48.0pp
- All cycles
- 2024: R+48.0 2020: R+43.2 2016: R+36.5 2012: R+25.4 2008: R+28.1
Not yet ingested
- Civics
- —
Market trends
- HPI YoY
- ▼ -54.73%
- Current HPI
- 125.616
- Rent YoY
- —
- Metro
- —
- State GDP YoY
- ▲ 3.80%
- F500 in state
- 10
Industry mix (Fortune 500 HQ in AR)
| Industry | F500 HQs | Revenue |
|---|---|---|
| Retail | 1 | $681B |
|
||
| Food / Agriculture | 1 | $53B |
|
||
| Retail / Energy | 1 | $22B |
|
||
| Transportation / Logistics | 1 | $12B |
|
||
| Energy | 1 | $4B |
|
||
Price history
-2.9% since first listed6 events — show timeline
- 2026-02-23 Listed $82,500 CARMLS
- 2026-02-12 Listing Removed — CARMLS
- 2025-08-27 Price Changed $82,500 CARMLS
- 2025-08-26 Relisted — CARMLS
- 2025-08-25 Listing Removed — CARMLS
- 2025-02-24 Listed $85,000 CARMLS
Property tax history
+0.4%/yrLatest (2025): $592 · +8.3% YoY. Source: county tax records.
Cash-flow waterfall
monthlySold comps — $/sqft
last 12 mo · ≤1 miLoading sold comps…