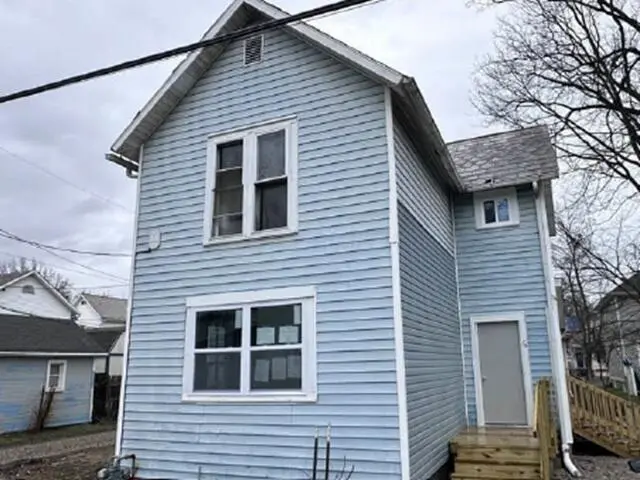
6 Elliott St · Mount Vernon, OH
Flood risk 3/10 · Minor
- FEMA flood zone
- X (unshaded)
- Chance of flooding over 30 yrs
- 0.1%
- Est. flood insurance / yr
- $473 – $860
Fire risk 1/10 · Minimal
- Est. fire insurance / yr
- $713 – $1,323
Heat risk 3/10 · Minor
- Hot days now (above 98°F)
- 7 days/yr
- Hot days in 30 yrs
- 17 days/yr
Wind risk 2/10 · Minimal
- Chance of severe wind over 30 yrs
- —
Air-quality risk 2/10 · Minimal
- Unhealthy air days now
- 1 days/yr
- Unhealthy air days in 30 yrs
- 3 days/yr
Risk factors via First Street. Map © Google.
Why this score? — see what drove the B grade
The composite is a weighted blend of 9 inputs, each scored 0–100. Each bar is that input's sub-score; the figure is the points it added to the 100-point composite (weight × sub-score).
- Cash flow +30.0/30.0
- 1% rule +10.0/10.0
- DSCR +10.0/10.0
- ARV discount +7.5/15.0
- Schools +4.9/10.0
- Livability +3.8/5.0
- Rent growth +2.5/5.0
- Condition / age +2.5/5.0
- Appreciation +0.0/10.0
$59,400
🖨 Deal sheet 📄 Offer letter ✓ Due diligence
Listing remarks
Great opportunity to buy this two story fixer upper located in Mount Vernon, OH and sitting on a 58x75 lot. The interior has 1264 sq. ft. with 3 bedrooms and 1 bathroom. This home is in need of complete renovation.
Key facts
- Complete renovation
- Two story
- 3,920 sq ft lot
Tags
Neighborhood map
What this means for you Summary
Snapshot
- This is a 3-bed/1.0-bath single-family listed at $59k.
Deal economics
- At list price, monthly cash flow is $856 ($10k/yr) — positive.
- The deal already cash-flows at list — no discount required.
- Meets the 1% rule at list price ($2k rent vs $59k).
- Recommended offer: $59k (1.5% below list) — sets the bar for market timing.
- Cap rate 23.6% vs local median 3.0% in Mount Vernon — top-decile yield for the area; either an underpriced asset or a hidden risk that comps aren't pricing in. Stress-test before assuming the spread holds.
Location & tenants
- Location reads 76/100 on livability (#227 in OH, #3,542 nationally) — a middle-class / working-renter tenant base. Strengths: cost of living A+, housing A+, health & safety A+; Watch: crime C-, amenities F, commute F.
- Mount Vernon City (town): math 55% / reading 62% proficiency, ranked #321 of 656 in OH (top 49%) — acceptable for families but not a draw, mixed tenant base, ~2y average lease.
- Market conditions: 161 active listings in the ZIP; 4 comparable units currently listed for rent nearby; rentals leasing fast (median 8d on market — plan ~1-2 weeks tenant-placement turnaround); 195 units permitted in Knox County in 2024 (0 in 5+ unit buildings).
Forward outlook
- Local home prices are declining (-3.0%/yr); year-one equity from $411 of loan paydown is wiped out by about $2k of value loss. Plan a longer hold.
- Knox County population projected at -14% by 2050 — secular population decline; favor cash flow + early exit over multi-decade hold.
- At projected returns (-3.0% appreciation + 3.0% rent growth), your $17k cash investment doubles in ~2 years — after that, you're playing with house money.
Negotiation context
- It's been on market 17 days — a 2% lower offer ($59k) is reasonable based on typical stale-listing flexibility.
- Current owner paid $17k; list at $59k implies a 256% gain — meaningful room to come down on a strong offer.
Risks & watch-outs
- Watch-outs: built in 1910 — expect roof / HVAC / electrical / plumbing capex.
Questions for the listing agent
- Built in 1910 — when were the roof, HVAC, electrical panel, plumbing, and water heater last replaced?
- Is there a deadline driving the sale (1031 exchange, divorce, estate, relocation)? That informs how much negotiation room exists.
- Schools are A-rated — typically a magnet for longer-tenancy family renters. What's the average tenant stay here, and is there a school-zone premium baked into asking?
- What's the average days-on-market for RENTAL listings here right now (not sales)? A rising rental-DOM trend means longer vacancies and softer asking-rent achievability than the comps imply.
- What's the recent tenant-quality profile in this submarket — average credit score on applications, eviction rate, late-payment / NSF rate, and stable-employment percentage? A property-management company in the area should have these aggregated.
- How much new for-sale + rental construction is in the pipeline within 1–3 miles? Heavy new supply typically softens prices + rents 12–24 months out; constrained supply supports both.
Investment metrics
- 1% rule
- 2.73% ✓
- Cap rate
- 23.59%
- Cash-on-cash
- 61.77%
- DSCR
- 3.75
- GRM
- 3.1
CMA / ARV
- ARV (on-the-fly)
- $194,656
- Comps found
- 12
Show comp detail 12 sales within ~0.75 mi
| Address | Dist | Beds/Ba | Sqft | Sold | Price | $/sf | Match |
|---|---|---|---|---|---|---|---|
| 608 N Gay St | 0.26mi | 3/2.0 | 1,262 (-0%) | 2mo | $248,000 | $197 | 82 |
| 203 N Park St | 0.19mi | 3/2.0 | 1,344 (+6%) | 7mo | $258,000 | $192 | 71 |
| 220 E Sugar St | 0.20mi | 3/1.5 | 1,378 (+9%) | 4mo | $212,000 | $154 | 70 |
| 208 E Burgess St | 0.15mi | 2/1.5 (-1) | 1,440 (+14%) | 2mo | $193,000 | $134 | 61 |
| 702 W Chestnut St | 0.64mi | 3/1.0 | 1,314 (+4%) | 6mo | $197,000 | $150 | 58 |
| 612 N Clinton St | 0.45mi | 3/1.0 | 1,104 (-13%) | 2mo | $190,000 | $172 | 56 |
| 200 1/2 W Walnut St | 0.73mi | 3/1.0 | 1,200 (-5%) | 2mo | $115,000 | $96 | 55 |
| 812 N Gay St | 0.44mi | 3/1.0 | 1,430 (+13%) | 6mo | $200,000 | $140 | 52 |
| 111 Potwin St | 0.50mi | 3/1.5 | 1,416 (+12%) | 4mo | $226,900 | $160 | 52 |
| 10 Yoakam Dr | 0.69mi | 3/1.0 | 1,120 (-11%) | 7mo | $215,000 | $192 | 43 |
| 61 Mansfield Ave | 0.71mi | 3/2.0 | 1,440 (+14%) | 1mo | $217,500 | $151 | 39 |
| 105 N Center St | 0.69mi | 3/2.0 | 1,441 (+14%) | 6mo | $181,500 | $126 | 35 |
Match score weights: distance 35% · size 25% · config 20% · recency 20%. Top-matched comps best support the ARV.
Projected returns pro-forma
-3.0% appreciation · 3.0% rent growth · sell at horizon
- IRR
- 60.7%
- Equity multiple
- 3.70×
- Total profit
- $44,937
- Equity at exit
- $8,857
- IRR
- 65.3%
- Equity multiple
- 7.58×
- Total profit
- $109,481
- Equity at exit
- $5,136
Cash invested: $16,632 (down + closing). Projections, not guarantees.
Landlord ↔ Tenant lean methodology
- Overall (STATE)
- 73 Landlord-Friendly
- State Ohio
- 73 Landlord-Friendly · R+6
- County
- — inherits STATE
- City
- — inherits STATE
ZIP-level market 43050
- Active inventory
- 161
- Price-to-rent
- 3.1×
Monthly cashflow live
- Estimated rent
- $1,622 medium interval (Pro) →
- Mortgage (P&I)
- −$312
- Tax from tax record
- −$89 /mo · $1,066/yr
- Insurance
- −$25
- HOA
- −$0
- Vacancy / Maint / Mgmt
- −$341
- Net cashflow
- $856
Break-even live
UW: 25.0% down · 7.5% · 30yr · 1.5% tax · 5.0% vac · 8.0% maint · 8.0% mgmt
Financing live
Cash to close
- Down payment
- $14,850
- Closing costs
- $1,782
- Reserves months
- —
- Total cash needed
- —
Loan-product check · same deal, 3 products live
Conventional
25% down · 7.5% · 30yr
- Down + closing
- —
- Monthly P&I
- —
- Monthly cashflow
- —
- DSCR
- —
- Eligible?
- —
Personal DTI + credit; lowest rate.
DSCR
20% down · 8.5% · 30yr
- Down + closing
- —
- Monthly P&I
- —
- Monthly cashflow
- —
- DSCR
- —
- Eligible?
- —
No personal income docs; deal must DSCR.
Hard money
10% down · 12.0% · 12mo
- Down + closing
- —
- Monthly P&I
- —
- Monthly cashflow
- —
- DSCR
- —
- Eligible?
- —
Short-term bridge; refi at stabilization.
Rent comps 4 comps
| Address | Beds | Baths | Sqft | Rent | $/sqft | DOM | Units | Dist |
|---|---|---|---|---|---|---|---|---|
| 407 E Burgess St Mount Vernon, OH | 4.0 | 2.0 | 1668 | $1,950 | $1.17 | 1d | 1 | 0.36mi |
| 713 Howard St Mount Vernon, OH | 3.0 | 2.0 | 1200 | $1,700 | $1.42 | 43d | 1 | 0.71mi |
| Vernedale Dr MT Vernon, OH | 2.0 | 2.0 | 938 | $1,025 | $1.09 | 1d | 1 | 1.23mi |
| 29 Plaza Dr Unit 29A Mt Vernon, OH | 2.0 | 1.0 | 973 | $900 | $0.92 | 7d | 1 | 1.25mi |
Listing history 3 events
-
2026-03-30status Pending
-
2026-03-13$59,400 Active
-
1988-07-21soldstatus $16,700
ⓘ Source: listings_history table (triggers on properties + properties_extension) + one-shot
backfill from property_details.listing_events for pre-trigger history.
Tax reassessment forecast OH · Partial reset (capped growth)
- Current annual tax
- $1,066 · $89/mo
- Projected year-2 tax
- $1,066 · $89/mo
- Expected delta
- $0/yr ($0/mo · 0.0%)
ⓘ Screening estimate from a state-policy table — verify with the county assessor before closing.
Climate risk First Street
- Flood 3/10 Moderate FEMA zone X (unshaded) · 10% chance over 30 yrs
- Wildfire 1/10 Low
- Heat 3/10 Moderate 7 d/yr ≥98°F today · 17 d/yr by 30 yrs out
- Wind 2/10 Low
- Air quality 2/10 Low 1 unhealthy d/yr today · 3 by 30 yrs out
Nearby sold comps map
Loading sold comps map…
Walkable amenities ~0.75 mi
Loading nearby amenities…
Taxation est. · year 1
- Rental income
- $19,461
- − Mortgage interest
- −$3,327
- − Property taxes
- −$1,066
- − Insurance
- −$297
- − Repairs & maintenance
- −$1,557
- − Management
- −$1,557
- − Depreciation
- −$1,728
- Taxable income
- $9,930
- Est. tax owed @ 24.0%
- −$2,383
- After-tax cash flow
- $7,891/yr
For passive investors: Depreciation is non-cash, so a rental often shows a tax loss while cash-flowing — sheltering income. Rental losses are passive: they offset passive income freely, and up to $25,000/yr can offset ordinary (W-2) income if you actively participate and your MAGI is under $100k (phasing out to $0 by $150k); unused losses carry forward. On sale, claimed depreciation is recaptured at up to 25%, and gains may owe capital-gains tax (a 1031 exchange can defer both). Figures are a year-1 estimate at your 24.0% rate — not tax advice; consult a CPA.
Schools (NCES district)
- District
- Mount Vernon City
- NCES district ID
- 3910012
- Math proficiency
- 55% ▼ -15.00%
- Reading proficiency
- 62% ▼ -6.00%
- Median HH income
- $44,253
- Composite
- 49.26/100
- National rank
- #2029
- State rank
- #321 of 656 in OH
Livability — Mount Vernon
- Score
- 76/100
- State rank
- #227
- US rank
- #3542
Category grades
Schools grade is shown separately in the Schools card above.
Census & demographics
- Census place
- Mount Vernon, OH
- County
- Knox · 63,297 people
- City population
- 30,360
- Population (ZIP)
- 30,360
- Household income
- $65,044
- Rent vs Own
- Severe rent burden
- 12.7
Population outlook (Knox County) Hauer SSP2
- Today (2025)
- 60,036 people
- By 2030
- 58,670 · -2.3%
- By 2040
- 54,963 · -8.4%
- By 2050
- 51,353 · -14.5%
- By 2075
- 43,196 · -28.0%
- By 2100
- 34,514 · -42.5%
Race, ethnicity, and origin ACS 2023
- Neighborhood character
- Predominantly White (91%)
- Race & ethnicity
- White 91% Two or more races 4% Hispanic / Latino 3% Black 1%
- Common ancestry
- Slovak 2% Romanian 2% Lithuanian 1%
- Foreign-born
- 2% · Canada
- Languages at home
- 98% English-only · Spanish 1%
Political lean MEDSL · Knox
- 2024 margin
- Solid R (+44.9) · D 27.1% · R 72.0%
- 2008→2024 swing
- -25.0pp toward R · 2008: -19.9pp · 2024: -44.9pp
- All cycles
- 2024: R+44.9 2020: R+43.8 2016: R+38.2 2012: R+24.3 2008: R+19.9
Not yet ingested
- Civics
- —
Market trends
- HPI YoY
- ▼ -260.50%
- Current HPI
- 304.4254
- Rent YoY
- —
- Metro
- —
- State GDP YoY
- ▲ 1.98%
- F500 in state
- 48
Industry mix (Fortune 500 HQ in OH)
| Industry | F500 HQs | Revenue |
|---|---|---|
| Insurance | 3 | $145B |
|
||
| Industrial Machinery | 3 | $49B |
|
||
| Financial Services | 3 | $24B |
|
||
| Consumer Goods | 2 | $93B |
|
||
| Aerospace / Defense | 2 | $47B |
|
||
| Utilities | 2 | $33B |
|
||
Price history
+255.7% since first listed3 events — show timeline
- 2026-03-30 Pending — CBRMLS
- 2026-03-13 Listed $59,400 CBRMLS
- 1988-07-21 Sold (Public Records) $16,700 Public Records
Property tax history
+1.8%/yrLatest (2025): $1,066 · -2.2% YoY. Source: county tax records.
Cash-flow waterfall
monthlySold comps — $/sqft
last 12 mo · ≤1 miLoading sold comps…