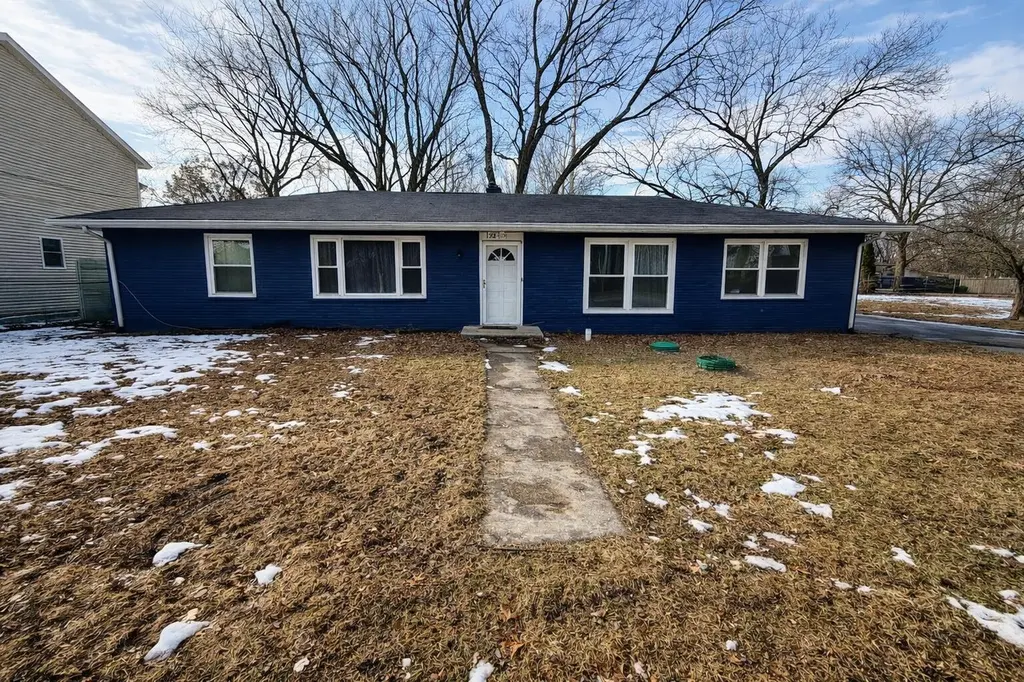
 Triplex
132-136 S Elgin St · Griffith, IN
Flood risk 1/10 · Minimal
- FEMA flood zone
- X (unshaded)
- Chance of flooding over 30 yrs
- 0.0%
- Est. flood insurance / yr
- $507 – $1,088
Fire risk 1/10 · Minimal
- Est. fire insurance / yr
- $717 – $1,331
Heat risk 2/10 · Minimal
- Hot days now (above 101°F)
- 6 days/yr
- Hot days in 30 yrs
- 13 days/yr
Wind risk 2/10 · Minimal
- Chance of severe wind over 30 yrs
- 0.0%
Air-quality risk 3/10 · Minor
- Unhealthy air days now
- 2 days/yr
- Unhealthy air days in 30 yrs
- 3 days/yr
Risk factors via First Street. Map © Google.
Why this score? — see what drove the B- grade
The composite is a weighted blend of 9 inputs, each scored 0–100. Each bar is that input's sub-score; the figure is the points it added to the 100-point composite (weight × sub-score).
- Cash flow +27.9/30.0
- ARV discount +11.0/15.0
- DSCR +9.9/10.0
- 1% rule +7.6/10.0
- Livability +3.5/5.0
- Schools +3.0/10.0
- Rent growth +2.5/5.0
- Condition / age +2.5/5.0
- Appreciation +0.0/10.0
$319,900
🖨 Deal sheet 📄 Offer letter ✓ Due diligence
Multi-family units
County records classify this as Multi-Family (2-4 Unit). Listing-text estimate: 3 units. confirmed
Listing remarks MLS
Investor-ready duplex with immediate cash flow and upside potential! This updated duplex is currently fully occupied with two tenants, generating strong monthly rental income. One unit rents for 1,387/month and the second for 1,295/month. Both units feature updated interiors with durable luxury vinyl plank flooring, offering a modern look with low maintenance--ideal for long-term investment performance. A major bonus: the sale includes an adjacent lot, creating added value and future potential. Whether you're looking to expand, hold for appreciation, or add flexibility to your portfolio, this extra parcel sets the property apart. A solid opportunity for investors seeking immediate income, updates already in place, and additional land value--all in one purchase.
Key facts
- Updated interiors
- 9,365 sq ft lot
- 2 garage spots
Tags
Neighborhood map
What this means for you Summary
Snapshot
- This is a 3 × 2-bed/1.0-bath units multifamily listed at $320k.
Deal economics
- At list price, monthly cash flow is $990 ($12k/yr) — positive. Per door: $330/mo.
- The deal already cash-flows at list — no discount required.
- Meets the 1% rule at list price ($4k rent vs $320k).
- Recommended offer: $282k (12.0% below list) — sets the bar for market timing.
- Cap rate 10.0% vs local median 4.9% in Griffith — top-decile yield for the area; either an underpriced asset or a hidden risk that comps aren't pricing in. Stress-test before assuming the spread holds.
Location & tenants
- Location reads 70/100 on livability (#146 in IN) — a middle-class / working-renter tenant base. Strengths: cost of living A+, housing A+, crime A; Watch: amenities F, commute F, health & safety F.
- Griffith Public Schools (suburban): math 31% / reading 38% proficiency, ranked #189 of 301 in IN (top 63%) — families likely to look elsewhere, expect single-tenant / working-renter base with shorter leases.
- Market conditions: 66 active listings in the ZIP; 1 comparable units currently listed for rent nearby; 1,642 units permitted in Lake County in 2024 (14 in 5+ unit buildings).
- At $4,033/mo this rent would consume 65% of the median local household income ($75k/yr) (locally 504% of renters already pay >50% of income on rent) — very limited rent-growth headroom before tenants either downsize or default.
Forward outlook
- Local home prices are declining (-3.0%/yr); year-one equity from $2k of loan paydown is wiped out by about $10k of value loss. Plan a longer hold.
- Lake County population projected to shrink 7% by 2050 — rents likely to lag national; underwrite the cash flow, not the appreciation.
- At projected returns (-3.0% appreciation + 3.0% rent growth), your $90k cash investment doubles in ~9 years — after that, you're playing with house money.
Negotiation context
- It's been on market 125 days — a 12% lower offer ($282k) is reasonable based on typical stale-listing flexibility.
- 5 sale attempts since 6y ago with the ask held roughly flat each time — persistent listings suggest the price (not the market) is what's stuck; bring a comps-based counter.
Questions for the listing agent
- It's been on market 125 days. Have you received any prior offers? Is the seller open to a 12% concession, seller financing, or rate buy-down credit?
- Can we see the unit-by-unit rent roll, current vacancy, and any below-market leases? What's the average tenancy length?
- What capital expenditures (roof, boiler, parking lot, exteriors) have been made in the last 5 years, and what's planned in the next 2?
- Built in 1963 — when were the roof, HVAC, electrical panel, plumbing, and water heater last replaced?
- Why hasn't it sold? Are there any deal-killer items the seller is aware of (foundation, flood, title, zoning, code violations)?
- Is there a deadline driving the sale (1031 exchange, divorce, estate, relocation)? That informs how much negotiation room exists.
- What's the average days-on-market for RENTAL listings here right now (not sales)? A rising rental-DOM trend means longer vacancies and softer asking-rent achievability than the comps imply.
- What's the recent tenant-quality profile in this submarket — average credit score on applications, eviction rate, late-payment / NSF rate, and stable-employment percentage? A property-management company in the area should have these aggregated.
- How much new apartment / multifamily construction is in the pipeline within 1–3 miles? Heavy new supply (>2% of stock underway) typically softens rents 12–24 months out; light construction supports rent growth.
Investment metrics
- 1% rule
- 1.26% ✓
- Cap rate
- 10.01%
- Cash-on-cash
- 13.26%
- DSCR
- 1.59
- GRM
- 6.6
CMA / ARV
- ARV (median comp)
- $346,971
- List price
- $319,900
- Delta
- -7.80%
- Verdict
- FAIR
- Comps
- 2 within 1.0 mi
Projected returns pro-forma
-3.0% appreciation · 3.0% rent growth · sell at horizon
- IRR
- 3.3%
- Equity multiple
- 1.13×
- Total profit
- $11,272
- Equity at exit
- $47,698
- IRR
- 12.8%
- Equity multiple
- 2.02×
- Total profit
- $91,222
- Equity at exit
- $27,659
Cash invested: $89,572 (down + closing). Projections, not guarantees.
Landlord ↔ Tenant lean methodology
- Overall (STATE)
- 90 Strongly Landlord-Friendly
- State Indiana
- 90 Strongly Landlord-Friendly · R+11
- County
- — inherits STATE
- City
- — inherits STATE
ZIP-level market 46319
- Home prices YoY
- -25.5%
- Active inventory
- 66
- Price-to-rent
- 19.8×
Monthly cashflow live
- Estimated rent
- $4,033 medium interval (Pro) →
- Mortgage (P&I)
- −$1,678
- Tax from tax record
- −$385 /mo · $4,622/yr
- Insurance
- −$133
- HOA
- −$0
- Vacancy / Maint / Mgmt
- −$847
- Net cashflow
- $990
Break-even live
3-unit breakdown (identical units grouped — click to expand)
| Units | Beds | Baths | Est. rent |
|---|---|---|---|
| 3× units | 2 | 1 | $4,032 |
| #1 | 2 | 1 | $1,344 |
| #2 | 2 | 1 | $1,344 |
| #3 | 2 | 1 | $1,344 |
| Total (3 units) | $4,033 | ||
UW: 25.0% down · 7.5% · 30yr · 1.5% tax · 5.0% vac · 8.0% maint · 8.0% mgmt
Financing live
Cash to close
- Down payment
- $79,975
- Closing costs
- $9,597
- Reserves months
- —
- Total cash needed
- —
Loan-product check · same deal, 3 products live
Conventional
25% down · 7.5% · 30yr
- Down + closing
- —
- Monthly P&I
- —
- Monthly cashflow
- —
- DSCR
- —
- Eligible?
- —
Personal DTI + credit; lowest rate.
DSCR
20% down · 8.5% · 30yr
- Down + closing
- —
- Monthly P&I
- —
- Monthly cashflow
- —
- DSCR
- —
- Eligible?
- —
No personal income docs; deal must DSCR.
Hard money
10% down · 12.0% · 12mo
- Down + closing
- —
- Monthly P&I
- —
- Monthly cashflow
- —
- DSCR
- —
- Eligible?
- —
Short-term bridge; refi at stabilization.
Rent comps 1 comps
| Address | Beds | Baths | Sqft | Rent | $/sqft | DOM | Units | Dist |
|---|---|---|---|---|---|---|---|---|
| 422 N Dwiggins St Griffith, IN | 2.0 | 1.0 | 1135 | $1,650 | $1.45 | 24d | 1 | 1.24mi |
Listing history 24 events
-
2026-06-18days on market $319,900 Active 125 DOM
-
2026-06-17days on market $319,900 Active 124 DOM
-
2026-06-16days on market $319,900 Active 123 DOM
-
2026-06-15days on market $319,900 Active 122 DOM
-
2026-06-13days on market $319,900 Active 120 DOM
-
2026-06-13days on market $319,900 Active 119 DOM
-
2026-06-09days on market $319,900 Active 116 DOM
-
2026-06-08days on market $319,900 Active 115 DOM
-
2026-06-07days on market $319,900 Active 114 DOM
-
2026-06-04days on market $319,900 Active 111 DOM
-
2026-06-03days on market $319,900 Active 110 DOM
-
2026-06-02days on market $319,900 Active 109 DOM
-
2026-06-01days on market $319,900 Active 108 DOM
-
2026-05-31days on market $319,900 Active 107 DOM
-
2026-02-13$319,900 Active 771-char remark
Show marketing remark (771 chars)
Investor-ready duplex with immediate cash flow and upside potential! This updated duplex is currently fully occupied with two tenants, generating strong monthly rental income. One unit rents for 1,387/month and the second for 1,295/month. Both units feature updated interiors with durable luxury vinyl plank flooring, offering a modern look with low maintenance--ideal for long-term investment performance. A major bonus: the sale includes an adjacent lot, creating added value and future potential. Whether you're looking to expand, hold for appreciation, or add flexibility to your portfolio, this extra parcel sets the property apart. A solid opportunity for investors seeking immediate income, updates already in place, and additional land value--all in one purchase.
-
2023-10-10soldstatus $285,000 Closed 458-char remark
Show marketing remark (458 chars)
Homeower it would be Great to Live in 1 unit and Rent the other. Well that's one option for this solid brick 2 unit. Or Investors Rent both units. Either way half the job has already been done for you. 1 unit is occupied with a leased tenant paying $1,350 per month. The property has been recently remodeled and waiting for a new owner. To add more value the property comes with an adjacent buildable lot. This is a must see!! Schedule an appointment today!!
-
2023-09-09status Pending 458-char remark
Show marketing remark (458 chars)
Homeower it would be Great to Live in 1 unit and Rent the other. Well that's one option for this solid brick 2 unit. Or Investors Rent both units. Either way half the job has already been done for you. 1 unit is occupied with a leased tenant paying $1,350 per month. The property has been recently remodeled and waiting for a new owner. To add more value the property comes with an adjacent buildable lot. This is a must see!! Schedule an appointment today!!
-
2023-08-25status Active 458-char remark
Show marketing remark (458 chars)
Homeower it would be Great to Live in 1 unit and Rent the other. Well that's one option for this solid brick 2 unit. Or Investors Rent both units. Either way half the job has already been done for you. 1 unit is occupied with a leased tenant paying $1,350 per month. The property has been recently remodeled and waiting for a new owner. To add more value the property comes with an adjacent buildable lot. This is a must see!! Schedule an appointment today!!
-
2023-08-04historical Active Under Contract 458-char remark
Show marketing remark (458 chars)
Homeower it would be Great to Live in 1 unit and Rent the other. Well that's one option for this solid brick 2 unit. Or Investors Rent both units. Either way half the job has already been done for you. 1 unit is occupied with a leased tenant paying $1,350 per month. The property has been recently remodeled and waiting for a new owner. To add more value the property comes with an adjacent buildable lot. This is a must see!! Schedule an appointment today!!
-
2023-07-19$295,000 Active 458-char remark
Show marketing remark (458 chars)
Homeower it would be Great to Live in 1 unit and Rent the other. Well that's one option for this solid brick 2 unit. Or Investors Rent both units. Either way half the job has already been done for you. 1 unit is occupied with a leased tenant paying $1,350 per month. The property has been recently remodeled and waiting for a new owner. To add more value the property comes with an adjacent buildable lot. This is a must see!! Schedule an appointment today!!
-
2020-12-24soldstatus $200,000
-
2020-12-24soldstatus $200,000
-
2020-10-10$219,000
-
2020-10-08$219,000
ⓘ Source: listings_history table (triggers on properties + properties_extension) + one-shot
backfill from property_details.listing_events for pre-trigger history.
Tax reassessment forecast IN · Partial reset (capped growth)
- Current annual tax
- $4,622 · $385/mo
- Projected year-2 tax
- $4,622 · $385/mo
- Expected delta
- $0/yr ($0/mo · 0.0%)
ⓘ Screening estimate from a state-policy table — verify with the county assessor before closing.
Climate risk First Street
- Flood 1/10 Low FEMA zone X (unshaded) · 0% chance over 30 yrs
- Wildfire 1/10 Low
- Heat 2/10 Low 6 d/yr ≥101°F today · 13 d/yr by 30 yrs out
- Wind 2/10 Low 0% chance of damaging wind over 30 yrs
- Air quality 3/10 Moderate 2 unhealthy d/yr today · 3 by 30 yrs out
Nearby sold comps map
Loading sold comps map…
Walkable amenities ~0.75 mi
Loading nearby amenities…
Taxation est. · year 1
- Rental income
- $48,396
- − Mortgage interest
- −$17,919
- − Property taxes
- −$4,622
- − Insurance
- −$1,600
- − Repairs & maintenance
- −$3,872
- − Management
- −$3,872
- − Depreciation
- −$9,306
- Taxable income
- $7,206
- Est. tax owed @ 24.0%
- −$1,729
- After-tax cash flow
- $10,151/yr
For passive investors: Depreciation is non-cash, so a rental often shows a tax loss while cash-flowing — sheltering income. Rental losses are passive: they offset passive income freely, and up to $25,000/yr can offset ordinary (W-2) income if you actively participate and your MAGI is under $100k (phasing out to $0 by $150k); unused losses carry forward. On sale, claimed depreciation is recaptured at up to 25%, and gains may owe capital-gains tax (a 1031 exchange can defer both). Figures are a year-1 estimate at your 24.0% rate — not tax advice; consult a CPA.
Schools (NCES district)
- District
- Griffith Public Schools
- NCES district ID
- 1804170
- Math proficiency
- 31% ▼ -15.00%
- Reading proficiency
- 38% ▼ -5.00%
- Median HH income
- $54,808
- Composite
- 30.37/100
- National rank
- #6254
- State rank
- #189 of 301 in IN
Livability — Griffith
- Score
- 70/100
- State rank
- #146
- US rank
- #7400
Category grades
Schools grade is shown separately in the Schools card above.
Census & demographics
- Census place
- Griffith, IN
- County
- Lake County · 422,878 people
- City population
- 17,847
- Metro
- Chicago-Naperville-Elgin, IL-IN-WI
- Population (ZIP)
- 17,847
- Household income
- $74,662
- Rent vs Own
- Severe rent burden
- 504.0
Population outlook (Lake County) Hauer SSP2
- Today (2025)
- 484,026 people
- By 2030
- 478,091 · -1.2%
- By 2040
- 462,974 · -4.3%
- By 2050
- 449,894 · -7.1%
- By 2075
- 436,169 · -9.9%
- By 2100
- 426,607 · -11.9%
Race, ethnicity, and origin ACS 2023
- Neighborhood character
- Majority White (64%)
- Race & ethnicity
- White 64% Hispanic / Latino 17% Black 13% Two or more races 12% Asian 2%
- Hispanic origin (detail)
- Mexican 14% Puerto Rican 1%
- Common ancestry
- Romanian 14% Iranian 4% Lithuanian 2%
- Foreign-born
- 6% · Canada, Philippines, China
- Languages at home
- 88% English-only · Spanish 9% Russian/Polish/Slavic 1% Other Asian/Pacific 1%
Political lean MEDSL · Lake
- 2024 margin
- Lean D (+5.6) · D 52.1% · R 46.5% · Other 1.5%
- 2008→2024 swing
- -28.6pp toward R · 2008: 34.3pp · 2024: 5.6pp
- All cycles
- 2024: D+5.6 2020: D+15.1 2016: D+20.6 2012: D+31.0 2008: D+34.3
Not yet ingested
- Civics
- —
Market trends
- HPI YoY
- ▼ -95.17%
- Current HPI
- 278.3139
- Rent YoY
- —
- Metro
- Chicago-Naperville-Elgin, IL-IN-WI
- State GDP YoY
- ▲ 2.90%
- F500 in state
- 18
Industry mix (Fortune 500 HQ in IN)
| Industry | F500 HQs | Revenue |
|---|---|---|
| Industrial Machinery | 2 | $37B |
|
||
| Healthcare | 1 | $177B |
|
||
| Pharmaceuticals | 1 | $45B |
|
||
| Metals / Steel | 1 | $18B |
|
||
| Agriculture | 1 | $17B |
|
||
| Packaging | 1 | $12B |
|
||
Price history
+46.1% since first listed10 events — show timeline
- 2026-02-13 Listed $319,900 NIRA MLS as Distributed by MLS Grid
- 2023-10-10 Sold (MLS) $285,000 NIRA MLS as Distributed by MLS Grid
- 2023-09-09 Pending — NIRA MLS as Distributed by MLS Grid
- 2023-08-25 Relisted — NIRA MLS as Distributed by MLS Grid
- 2023-08-04 Contingent — NIRA MLS as Distributed by MLS Grid
- 2023-07-19 Listed $295,000 NIRA MLS as Distributed by MLS Grid
- 2020-12-24 Sold (MLS) $200,000 NIRA MLS as Distributed by MLS Grid
- 2020-12-24 Sold (MLS) $200,000 NIRA MLS as Distributed by MLS Grid
- 2020-10-10 Listed $219,000 NIRA MLS as Distributed by MLS Grid
- 2020-10-08 Listed $219,000 NIRA MLS as Distributed by MLS Grid
Property tax history
+10.5%/yrLatest (2024): $4,622 · +81.6% YoY. Source: county tax records.
Cash-flow waterfall
monthlySold comps — $/sqft
last 12 mo · ≤1 miLoading sold comps…