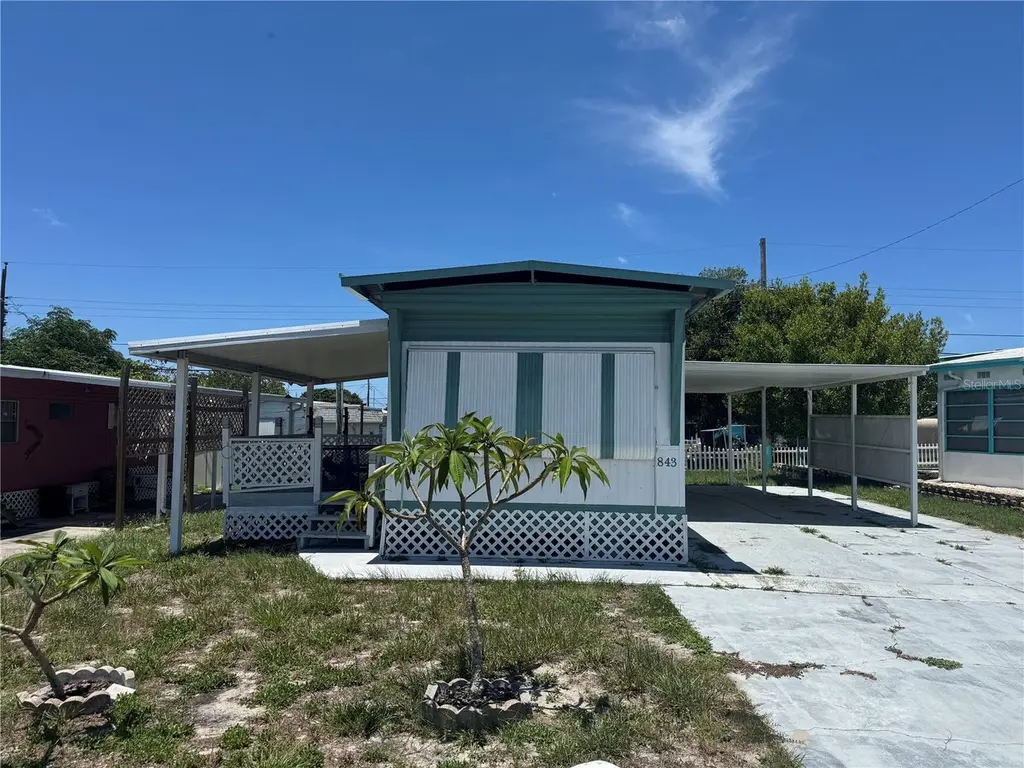
1843 Shady Cove Dr · Holiday, FL
Flood risk 5/10 · Moderate
- FEMA flood zone
- X (shaded)
- Chance of flooding over 30 yrs
- 0.43%
- Est. flood insurance / yr
- $507 – $1,088
Fire risk 2/10 · Minimal
- Est. fire insurance / yr
- $947 – $1,759
Heat risk 10/10 · Severe
- Hot days now (above 109°F)
- 7 days/yr
- Hot days in 30 yrs
- 27 days/yr
Wind risk 10/10 · Severe
- Chance of severe wind over 30 yrs
- 99.0%
Air-quality risk 2/10 · Minimal
- Unhealthy air days now
- 1 days/yr
- Unhealthy air days in 30 yrs
- 1 days/yr
Risk factors via First Street. Map © Google.
Why this score? — see what drove the B- grade
The composite is a weighted blend of 9 inputs, each scored 0–100. Each bar is that input's sub-score; the figure is the points it added to the 100-point composite (weight × sub-score).
- Cash flow +29.6/30.0
- DSCR +10.0/10.0
- 1% rule +8.6/10.0
- ARV discount +7.5/15.0
- Schools +4.3/10.0
- Livability +3.3/5.0
- Rent growth +3.0/5.0
- Condition / age +2.5/5.0
- Appreciation +0.0/10.0
$92,900
🖨 Deal sheet (PDF) 📄 Offer letter ✓ Due diligence
Listing remarks MLS
Welcome Home to highly sought after Buena Vista MHP where you own your land and enjoy low quarterly HOA fees of $80.43 that includes 2x a week trash pick up and street lights!!! You will love all the extras this beautiful spacious, incredibly clean, 1 bedroom, 1 bathroom mobile home has to offer including, inside laundry closet with stacking washer and dryer, high ceilings, beautiful laminate flooring throughout the home, energy saving roof over, beautiful deck to enjoy your morning coffee! You will enjoy the many amenities this wonderful community offers such as 2 club houses, weekly bingo, cards, pickle ball, pool tables, a library and Saturday morning breakfasts to catch up with your neighbors! Buena Vista is located near shopping, restaurants and a short drive to beaches, airports and theme parks! Live where you always feel like you are on vacation! This low maintenance home is perfect for snow birds or year round living. This property is being sold furnished and AS-IS for the convenience of the Sellers. All you will need to pack is your toothbrush! All information is believed to be true and accurate however, Buyer(s)/ Buyer's agent to verify all information.
Key facts
- Covered porch
- Metal roof
- Built in closets
Tags
Property features AI
Finance
- Other: Lot approximately 0.09 acres (about 362 sq meters)
- Financial info: Total annual fees approximately $436; Lease restrictions apply
- HOA & community: HOA required (Elyse; Buena Vista); Monthly HOA approximately $36.33; Quarterly association fee of $109; Association approval required; Pets allowed: cats and dogs
Exterior
- Parking: Carport with 2 spaces
- Utilities: Public water; Septic tank; Cable available
- Home design: Residential mobile home (single wide); One story; Faces east; Entry on one level
- Construction: Metal siding; Roof over; Pillar/post/pier foundation; Built as single-wide mobile home
- Exterior features: Awning(s); Asphalt road access
Interior
- Kitchen: Microwave; Range; Refrigerator
- Bedrooms: 1 bedroom
- Flooring: Laminate
- Bathrooms: 1 full bathroom
- Heating & cooling: Central heating (electric); Central air conditioning
- Interior features: Eat-in kitchen; High ceilings
- Laundry & utility: Laundry inside
Neighborhood map
What this means for you Summary
Snapshot
- This is a 1-bed/1.0-bath manufactured listed at $93k.
Deal economics
- At list price, monthly cash flow is $336 ($4k/yr) — positive.
- The deal already cash-flows at list — no discount required.
- Meets the 1% rule at list price ($1k rent vs $93k).
- Recommended offer: $92k (1.5% below list) — sets the bar for market timing.
- Cap rate 10.6% vs local median 4.5% in Holiday — top-decile yield for the area; either an underpriced asset or a hidden risk that comps aren't pricing in. Stress-test before assuming the spread holds.
Location & tenants
- Location reads 66/100 on livability (#623 in FL) — a middle-class / working-renter tenant base. Strengths: cost of living A+, housing A+, health & safety B; Watch: crime D+, amenities F, commute F.
- Pasco (suburban): math 50% / reading 52% proficiency, ranked #32 of 73 in FL (top 44%) — acceptable for families but not a draw, mixed tenant base, ~2y average lease.
- Zoned schools: Gulfside Elementary School (math 27% / reading 37%, grade F, #1,797 of 2,144 statewide, top 86%, 389 students, 90% FRL); Paul R. Smith Middle School (math 32% / reading 38%, grade F, #416 of 571 statewide, top 74%, 994 students, 82% FRL); Anclote High School (math 28% / reading 38%, grade F, #406 of 667 statewide, top 61%, 1,205 students, 77% FRL) — zoned schools average 83% FRL vs 48% district-wide (34 pts higher); higher-poverty schools than district average — tighter screening recommended.
- Zoned-school proficiency averages 33% at this address vs 51% district-wide (-18 pts) — the specific schools serving this property underperform the Pasco average; the district grade overstates school quality for this exact location.
- Market conditions: Rents rising (+2.0%/yr); 329 active listings in the ZIP; 13 comparable units currently listed for rent nearby; rentals at typical pace (median 17d on market — plan ~3-4 weeks tenant-placement turnaround); 6,765 units permitted in Pasco County in 2024 (1,250 in 5+ unit buildings).
- This rent runs 30% of the median local income ($50k/yr) — at the standard rent-burdened threshold; future hikes will face affordability resistance.
Forward outlook
- Local home prices are declining (-3.0%/yr); year-one equity from $642 of loan paydown is wiped out by about $3k of value loss. Plan a longer hold.
- Pasco County population projected at +29% by 2050 — long-run rental-demand tailwind backs the buy-and-hold thesis.
- At projected returns (-3.0% appreciation + 2.0% rent growth), your $26k cash investment doubles in ~9 years — after that, you're playing with house money.
Negotiation context
- It's been on market 15 days — a 2% lower offer ($92k) is reasonable based on typical stale-listing flexibility.
- 3 sale attempts since 12y ago with the ask held roughly flat each time — persistent listings suggest the price (not the market) is what's stuck; bring a comps-based counter.
Risks & watch-outs
- Climate carrying-cost: moderate flood risk; severe wind risk, 99% chance of damaging wind over 30y; extreme-heat days projected 7→27/yr by 2055 (HVAC capex compounding) — expect insurance premiums to compound above CPI over the hold.
Questions for the listing agent
- Built in 1971 — when were the roof, HVAC, electrical panel, plumbing, and water heater last replaced?
- What does the HOA fee cover, when was the last increase, and are there any pending special assessments or reserve-fund shortfalls?
- Is there a deadline driving the sale (1031 exchange, divorce, estate, relocation)? That informs how much negotiation room exists.
- Schools are D-rated, which usually means shorter tenancies and higher turnover. Who's the typical renter profile here, and what's been the actual vacancy rate?
- Crime grade is D in this area — have there been break-ins, vandalism, or insurance claims at this property in the last 3 years? What carrier currently insures it and at what premium?
- What's the average days-on-market for RENTAL listings here right now (not sales)? A rising rental-DOM trend means longer vacancies and softer asking-rent achievability than the comps imply.
- What's the recent tenant-quality profile in this submarket — average credit score on applications, eviction rate, late-payment / NSF rate, and stable-employment percentage? A property-management company in the area should have these aggregated.
- How much new for-sale + rental construction is in the pipeline within 1–3 miles? Heavy new supply typically softens prices + rents 12–24 months out; constrained supply supports both.
Investment metrics
- 1% rule
- 1.36% ✓
- Cap rate
- 10.63%
- Cash-on-cash
- 15.50%
- DSCR
- 1.69
- GRM
- 6.1
CMA / ARV
- ARV (on-the-fly)
- $61,776
- Comps found
- 9
Show comp detail 9 sales within ~0.75 mi
| Address | Dist | Beds/Ba | Sqft | Sold | Price | $/sf | Match |
|---|---|---|---|---|---|---|---|
| 1810 Speck Dr | 0.08mi | 1/1.0 | 672 (+8%) | 9mo | $91,500 | $136 | 76 |
| 1852 Hoyle Dr | 0.02mi | 2/1.0 (+1) | 576 (-8%) | 7mo | $55,000 | $95 | 75 |
| 1702 Holiday Dr | 0.34mi | 2/1.5 (+1) | 624 (0%) | 3mo | $51,000 | $82 | 74 |
| 2045 Melody Dr | 0.28mi | 2/1.5 (+1) | 624 (0%) | 9mo | $61,500 | $99 | 72 |
| 1843 Hoyle Dr | 0.04mi | 2/1.0 (+1) | 692 (+11%) | 9mo | $50,000 | $72 | 67 |
| 2025 Melody Dr | 0.26mi | 2/1.5 (+1) | 576 (-8%) | 3mo | $87,500 | $152 | 66 |
| 4244 Buena Vista Ln | 0.20mi | 2/1.0 (+1) | 700 (+12%) | 6mo | $50,000 | $71 | 60 |
| 2050 Lullaby Dr | 0.24mi | 2/1.0 (+1) | 672 (+8%) | 14mo | $70,000 | $104 | 60 |
| 2020 Roselawn Dr | 0.19mi | 2/1.5 (+1) | 672 (+8%) | 18mo | $89,000 | $132 | 57 |
Match score weights: distance 35% · size 25% · config 20% · recency 20%. Top-matched comps best support the ARV.
Projected returns pro-forma
-3.0% appreciation · 2.05% rent growth · sell at horizon
- IRR
- 5.2%
- Equity multiple
- 1.20×
- Total profit
- $5,183
- Equity at exit
- $13,852
- IRR
- 13.7%
- Equity multiple
- 2.05×
- Total profit
- $27,383
- Equity at exit
- $8,032
Cash invested: $26,012 (down + closing). Projections, not guarantees.
Landlord ↔ Tenant lean methodology
- Overall (STATE)
- 87 Strongly Landlord-Friendly
- State Florida
- 87 Strongly Landlord-Friendly · R+3
- County
- — inherits STATE
- City
- — inherits STATE
ZIP-level market 34691
- Home prices YoY
- -23.9%
- Rents YoY
- 2.0%
- Active inventory
- 329
- Price-to-rent
- 6.1×
Monthly cashflow live
- Estimated rent
- $1,264 high interval (Pro) →
- Mortgage (P&I)
- −$487
- Tax from tax record
- −$101 /mo · $1,208/yr
- Insurance
- −$39
- HOA
- −$36
- Vacancy / Maint / Mgmt
- −$265
- Net cashflow
- $336
Break-even live
Sensitivity live
| Price | -10% $389 | -5% $362 | +0% $336 | +5% $310 | +10% $283 |
|---|---|---|---|---|---|
| Rent | -10% $236 | -5% $286 | +0% $336 | +5% $386 | +10% $436 |
| Rate | -1.0pp $383 | -0.5pp $360 | base $336 | +0.5pp $312 | +1.0pp $287 |
UW: 25.0% down · 7.5% · 30yr · 1.5% tax · 5.0% vac · 8.0% maint · 8.0% mgmt
Financing live
Cash to close
- Down payment
- $23,225
- Closing costs
- $2,787
- Reserves months
- —
- Total cash needed
- —
Loan-product check · same deal, 3 products live
Conventional
25% down · 7.5% · 30yr
- Down + closing
- —
- Monthly P&I
- —
- Monthly cashflow
- —
- DSCR
- —
- Eligible?
- —
Personal DTI + credit; lowest rate.
DSCR
20% down · 8.5% · 30yr
- Down + closing
- —
- Monthly P&I
- —
- Monthly cashflow
- —
- DSCR
- —
- Eligible?
- —
No personal income docs; deal must DSCR.
Hard money
10% down · 12.0% · 12mo
- Down + closing
- —
- Monthly P&I
- —
- Monthly cashflow
- —
- DSCR
- —
- Eligible?
- —
Short-term bridge; refi at stabilization.
Rent comps 13 comps
| Address | Beds | Baths | Sqft | Rent | $/sqft | DOM | Units | Dist |
|---|---|---|---|---|---|---|---|---|
| 2051 Pleasure Dr Holiday, FL | 2.0 | 1.0 | 720 | $1,200 | $1.67 | 26d | 1 | 0.22mi |
| 2133 Melody Dr Holiday, FL | 2.0 | 1.0 | 510 | $1,078 | $2.11 | 16d | 1 | 0.33mi |
| 2117 Calusa Trl Unit B Holiday, FL | 1.0 | 1.0 | 708 | $1,195 | $1.69 | 0d | 1 | 0.54mi |
| 4318 Tahitian Gardens Cir Unit B Holiday, FL | 1.0 | 1.0 | 576 | $1,200 | $2.08 | 26d | 1 | 0.54mi |
| 2122 Ranchita Trl Holiday, FL | 2.0 | 1.0 | 648 | $1,399 | $2.16 | 26d | 1 | 0.60mi |
| 4358 Tahitian Gardens Cir Unit G Holiday, FL | 1.0 | 1.0 | 600 | $1,350 | $2.25 | 26d | 1 | 0.63mi |
| 4358 Tahitian Gardens Cir Holiday, FL | 1.0 | 1.0 | 600 | $1,350 | $2.25 | 16d | 1 | 0.63mi |
| 4205 Jordana Way Holiday, FL | 1.0–3.0 | 1.0–2.0 | 1027 | $1,176 | $1.14 | 4d | 13 | 0.93mi |
| 4348 Plaza Dr Holiday, FL | 1.0–2.0 | 1.0–2.0 | 860 | $1,099 | $1.28 | 1d | 7 | 1.00mi |
| 623 Beckett Way Unit B Tarpon Springs, FL | 1.0 | 1.0 | 600 | $1,250 | $2.08 | 5d | 1 | 1.28mi |
| 5409 Oceanic Rd Holiday, FL | 1.0 | 1.0 | 624 | $1,225 | $1.96 | 26d | 1 | 1.29mi |
| 5419 Oceanic Rd Holiday, FL | 1.0 | 1.0 | 624 | $1,200 | $1.92 | 14d | 1 | 1.31mi |
| 5441 Oceanic Rd Holiday, FL | 1.0 | 1.0 | 600 | $1,100 | $1.83 | 26d | 1 | 1.35mi |
HOA detail
- Monthly dues
- $36 · $432/yr
- Likely covers
- trashpool
Listing history 11 events
-
2026-06-22remarks 383-char remark
-
2026-06-22days on market $92,900 Active 15 DOM
-
2026-06-18days on market $92,900 Active 12 DOM
-
2026-06-17days on market $92,900 Active 11 DOM
-
2026-06-16days on market $92,900 Active 10 DOM
-
2026-06-15days on market $92,900 Active 9 DOM
-
2026-06-13days on market $92,900 Active 7 DOM
-
2026-06-09days on market $92,900 Active 3 DOM
-
2026-06-08days on market $92,900 Active 2 DOM
-
2026-06-07remarks 322-char remark
-
2026-06-07$92,900 Active 1 DOM
ⓘ Source: listings_history table (triggers on properties + properties_extension) + one-shot
backfill from property_details.listing_events for pre-trigger history.
Tax reassessment forecast FL · Resets to sale price
- Current annual tax
- $1,208 · $101/mo
- Projected year-2 tax
- $1,208 · $101/mo
- Expected delta
- $0/yr ($0/mo · 0.0%)
ⓘ Screening estimate from a state-policy table — verify with the county assessor before closing.
Climate risk First Street
- Flood 5/10 Major FEMA zone X (shaded) · 43% chance over 30 yrs
- Wildfire 2/10 Low
- Heat 10/10 Extreme 7 d/yr ≥109°F today · 27 d/yr by 30 yrs out
- Wind 10/10 Extreme 99% chance of damaging wind over 30 yrs
- Air quality 2/10 Low 1 unhealthy d/yr today · 1 by 30 yrs out
Nearby sold comps map
Loading sold comps map…
Walkable amenities ~0.75 mi
Loading nearby amenities…
Taxation est. · year 1
- Rental income
- $15,168
- − Mortgage interest
- −$5,204
- − Property taxes
- −$1,208
- − Insurance
- −$464
- − Repairs & maintenance
- −$1,213
- − Management
- −$1,213
- − HOA
- −$432
- − Depreciation
- −$2,703
- Taxable income
- $2,731
- Est. tax owed @ 24.0%
- −$655
- After-tax cash flow
- $3,377/yr
For passive investors: Depreciation is non-cash, so a rental often shows a tax loss while cash-flowing — sheltering income. Rental losses are passive: they offset passive income freely, and up to $25,000/yr can offset ordinary (W-2) income if you actively participate and your MAGI is under $100k (phasing out to $0 by $150k); unused losses carry forward. On sale, claimed depreciation is recaptured at up to 25%, and gains may owe capital-gains tax (a 1031 exchange can defer both). Figures are a year-1 estimate at your 24.0% rate — not tax advice; consult a CPA.
Schools (NCES district)
- District
- Pasco
- NCES district ID
- 1201530
- Math proficiency
- 50% ▼ -10.00%
- Reading proficiency
- 52% ▼ -5.00%
- Median HH income
- $45,039
- Composite
- 43.14/100
- National rank
- #3074
- State rank
- #32 of 73 in FL
Livability — Holiday
- Score
- 66/100
- State rank
- #623
- US rank
- #12124
Category grades
Schools grade is shown separately in the Schools card above.
Census & demographics
- Census place
- Holiday, FL
- County
- Pasco County · 524,098 people
- City population
- 33,730
- Metro
- Tampa-St. Petersburg-Clearwater, FL
- Population (ZIP)
- 21,232
- Household income
- $50,288
- Rent vs Own
- Severe rent burden
- 1031.0
Population outlook (Pasco County) Hauer SSP2
- Today (2025)
- 570,045 people
- By 2030
- 605,844 · +6.3%
- By 2040
- 674,806 · +18.4%
- By 2050
- 736,022 · +29.1%
- By 2075
- 862,900 · +51.4%
- By 2100
- 906,364 · +59.0%
Race, ethnicity, and origin ACS 2023
- Neighborhood character
- Predominantly White (73%)
- Race & ethnicity
- White 73% Hispanic / Latino 15% Two or more races 11% Black 7% Asian 2%
- Hispanic origin (detail)
- Mexican 2% Puerto Rican 6% Cuban 2% Dominican 2%
- Common ancestry
- Romanian 3% Iranian 2% Lithuanian 2%
- Foreign-born
- 10% · Canada, Vietnam
- Languages at home
- 82% English-only · Spanish 8% Other Indo-European 5% Other Asian/Pacific 1%
Political lean MEDSL · Pasco
- 2024 margin
- Strong R (+25.2) · D 36.9% · R 62.1% · Other 1.0%
- 2008→2024 swing
- -21.6pp toward R · 2008: -3.6pp · 2024: -25.2pp
- All cycles
- 2024: R+25.2 2020: R+20.1 2016: R+21.6 2012: R+6.7 2008: R+3.6
Not yet ingested
- Civics
- —
Market trends
- HPI YoY
- ▼ -102.84%
- Current HPI
- 326.9843
- Rent YoY
- ▲ 2.05%
- Metro
- Tampa-St. Petersburg-Clearwater, FL
- State GDP YoY
- ▲ 3.28%
- F500 in state
- 36
Industry mix (Fortune 500 HQ in FL)
| Industry | F500 HQs | Revenue |
|---|---|---|
| Industrial Technology | 2 | $29B |
|
||
| Insurance | 2 | $17B |
|
||
| Retail | 1 | $60B |
|
||
| Technology Distribution | 1 | $58B |
|
||
| Homebuilding | 1 | $35B |
|
||
| Technology Manufacturing | 1 | $35B |
|
||
Price history
+776.4% since first listed10 events — show timeline
- 2026-06-06 Listed $92,900 Stellar MLS as Distributed by MLS Grid
- 2022-11-08 Sold (Public Records) $90,000 Public Records
- 2022-11-04 Sold (MLS) $90,000 Stellar MLS as Distributed by MLS Grid
- 2022-10-21 Pending — Stellar MLS as Distributed by MLS Grid
- 2022-10-06 Price Changed $91,900 Stellar MLS as Distributed by MLS Grid
- 2022-07-14 Price Changed $97,900 Stellar MLS as Distributed by MLS Grid
- 2022-05-31 Listed $99,900 Stellar MLS as Distributed by MLS Grid
- 2014-03-26 Sold (MLS) $25,900 Stellar MLS as Distributed by MLS Grid
- 2014-03-05 Listed $26,900 Stellar MLS as Distributed by MLS Grid
- 1999-03-01 Sold (Public Records) $10,600 Public Records
Property tax history
+9.5%/yrLatest (2025): $1,208 · +8.6% YoY. Source: county tax records.
Cash-flow waterfall
monthlySold comps — $/sqft
last 12 mo · ≤1 miLoading sold comps…