 🏗️ New Construction
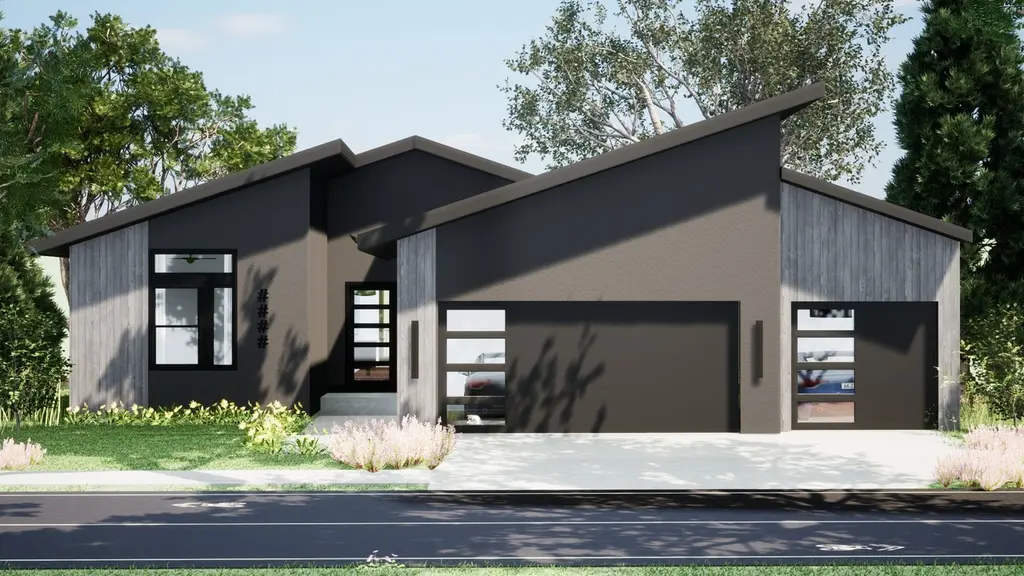
The Greystone Plan · Kansas City, MO
Flood risk 1/10 · Minimal
- FEMA flood zone
- X (unshaded)
- Chance of flooding over 30 yrs
- 0.0%
- Est. flood insurance / yr
- $507 – $1,088
Fire risk 1/10 · Minimal
- Est. fire insurance / yr
- $1,054 – $1,958
Heat risk 3/10 · Minor
- Hot days now (above 107°F)
- 7 days/yr
- Hot days in 30 yrs
- 16 days/yr
Wind risk 2/10 · Minimal
- Chance of severe wind over 30 yrs
- —
Air-quality risk 3/10 · Minor
- Unhealthy air days now
- 2 days/yr
- Unhealthy air days in 30 yrs
- 3 days/yr
Risk factors via First Street. Map © Google.
Why this score? — see what drove the F grade
The composite is a weighted blend of 9 inputs, each scored 0–100. Each bar is that input's sub-score; the figure is the points it added to the 100-point composite (weight × sub-score).
- Appreciation +10.0/10.0
- ARV discount +7.5/15.0
- Schools +4.5/10.0
- Rent growth +4.3/5.0
- Livability +3.9/5.0
- Condition / age +2.5/5.0
- Cash flow +1.1/30.0
- 1% rule +0.0/10.0
- DSCR +0.0/10.0
$525,000
🖨 Deal sheet (PDF) 📄 Offer letter ✓ Due diligence
Listing remarks MLS
Welcome to the Greystone reverse 1.5 story plan-a modern design that blends timeless style with functional living. This home features a bright, open layout and elegant finishes throughout. The main level showcases a gourmet-inspired kitchen with a spacious walk-in pantry, a cozy fireplace, and a covered rear deck ideal for relaxing or entertaining. You'll also find both the primary suite and a secondary bedroom conveniently located on the main floor. The finished lower level expands your living space with two additional bedrooms, a full bath, and a generous rec room-perfect for game nights, movie marathons, or entertaining guests.
Key facts
- Covered rear deck
- Cozy fireplace
- Generous rec room
Tags
Neighborhood map
What this means for you Summary
Snapshot
- This is a 4-bed/3.0-bath single-family listed at $525k.
Deal economics
- At list price, monthly cash flow is $-3k ($-31k/yr) — negative.
- To cash-flow at today's rent, offer at most $263k (49.9% below list).
- To meet the 1% rule (rent ≥ 1% of price), the offer needs to be $236k (55.0% below list).
- Recommended offer: $236k (55.0% below list) — sets the bar for 1% rule.
- Cap rate 1.4% vs local median 3.9% in Kansas City — below-typical yield; the buyer is paying a premium for something (appreciation thesis, condition, location) that the cap rate doesn't capture.
Location & tenants
- Location reads 78/100 on livability (#28 in MO, #2,671 nationally) — a middle-class / working-renter tenant base. Strengths: amenities A+, commute A+, cost of living A+; Watch: crime F.
- Park Hill (urban): math 47% / reading 54% proficiency, ranked #26 of 324 in MO (top 8%) — acceptable for families but not a draw, mixed tenant base, ~2y average lease.
- Zoned schools: Alfred L. Renner Elem. (math 31% / reading 43%, grade F, #611 of 1,115 statewide, top 59%, 427 students, 36% FRL); Plaza Middle (math 37% / reading 51%, grade D, #121 of 391 statewide, top 32%, 715 students, 30% FRL); Park Hill High (math 70% / reading 71%, grade B+, #9 of 521 statewide, top 2%, 1,857 students, 25% FRL).
- Market conditions: Rents rising fast (+7.0%/yr); 268 active listings in the ZIP; 4 comparable units currently listed for rent nearby; rentals at typical pace (median 19d on market — plan ~3-4 weeks tenant-placement turnaround); high-income renter base; 234 units permitted in Platte County in 2024 (0 in 5+ unit buildings).
Forward outlook
- In year one you build about $69k of equity ($4k loan paydown + $64k appreciation (10.0% local appreciation)).
- Platte County population projected at +31% by 2050 — long-run rental-demand tailwind backs the buy-and-hold thesis.
- By year 2, paydown + projected appreciation supports a ~$110k cash-out refi (75% LTV) — recoverable capital for the next deal without selling this one.
Negotiation context
- It's been on market 284 days — a 12% lower offer ($462k) is reasonable based on typical stale-listing flexibility.
Questions for the listing agent
- What do current leases actually rent for vs. the listed asking? Can we see a recent rent roll and the last 12 months of T-12 income?
- It's been on market 284 days. Have you received any prior offers? Is the seller open to a 55% concession, seller financing, or rate buy-down credit?
- What does the HOA fee cover, when was the last increase, and are there any pending special assessments or reserve-fund shortfalls?
- Why hasn't it sold? Are there any deal-killer items the seller is aware of (foundation, flood, title, zoning, code violations)?
- Is there a deadline driving the sale (1031 exchange, divorce, estate, relocation)? That informs how much negotiation room exists.
- Crime grade is F in this area — have there been break-ins, vandalism, or insurance claims at this property in the last 3 years? What carrier currently insures it and at what premium?
- The area grade is low — what's the realistic commute time and amenity access for the typical tenant pool here? Any planned neighborhood developments (good or bad) we should know about?
- What's the average days-on-market for RENTAL listings here right now (not sales)? A rising rental-DOM trend means longer vacancies and softer asking-rent achievability than the comps imply.
- What's the recent tenant-quality profile in this submarket — average credit score on applications, eviction rate, late-payment / NSF rate, and stable-employment percentage? A property-management company in the area should have these aggregated.
- How much new for-sale + rental construction is in the pipeline within 1–3 miles? Heavy new supply typically softens prices + rents 12–24 months out; constrained supply supports both.
Investment metrics
- 1% rule
- 0.37% ✗
- Cap rate
- 1.40%
- Cash-on-cash
- -17.47%
- DSCR
- 0.22
- GRM
- 22.7
CMA / ARV
- ARV (median comp)
- $641,775
- List price
- $525,000
- Delta
- -18.20%
- Verdict
- UNDERPRICED
- Comps
- 20 within 1.0 mi
Show comp detail 12 sales within ~0.75 mi
| Address | Dist | Beds/Ba | Sqft | Sold | Price | $/sf | Match |
|---|---|---|---|---|---|---|---|
| 8316 NW 89th Ter | 0.03mi | 4/3.0 | 2,126 (-8%) | 4mo | $537,386 | $253 | 81 |
| 8809 N Clarion Ave | 0.04mi | 4/3.0 | 2,496 (+8%) | 6mo | $529,000 | $212 | 80 |
| 8312 NW 89th Ter | 0.04mi | 4/3.0 | 2,126 (-8%) | 6mo | $515,200 | $242 | 79 |
| 8400 NW 90th St | 0.05mi | 4/3.0 | 2,126 (-8%) | 8mo | $517,785 | $244 | 77 |
| 8401 NW 90th St | 0.05mi | 4/3.5 | 2,601 (+12%) | 7mo | $569,900 | $219 | 70 |
| 8606 N Utica Ct | 0.46mi | 4/3.0 | 2,164 (-7%) | 1mo | $469,900 | $217 | 67 |
| 8309 NW 90th St | 0.12mi | 4/3.0 | 2,635 (+14%) | 8mo | $629,000 | $239 | 65 |
| 8118 NW 90th Ter | 0.33mi | 4/3.0 | 2,588 (+12%) | 3mo | $550,000 | $213 | 63 |
| 8624 NW Utica Ave | 0.43mi | 5/3.0 (+1) | 2,405 (+4%) | 10mo | $465,000 | $193 | 60 |
| 7905 NW 85th Ter | 0.55mi | 4/3.0 | 2,258 (-3%) | 12mo | $280,000 | $124 | 60 |
| 8519 N Conran Ct | 0.42mi | 4/3.5 | 2,565 (+11%) | 12mo | $435,000 | $170 | 51 |
| 8905 NW 86th St | 0.39mi | 4/3.5 | 2,582 (+11%) | 19mo | $480,000 | $186 | 46 |
Match score weights: distance 35% · size 25% · config 20% · recency 20%. Top-matched comps best support the ARV.
Projected returns pro-forma
10.0% appreciation · 7.03% rent growth · sell at horizon
- IRR
- 12.8%
- Equity multiple
- 2.07×
- Total profit
- $192,884
- Equity at exit
- $578,162
- IRR
- 13.7%
- Equity multiple
- 5.02×
- Total profit
- $722,952
- Equity at exit
- $1,246,827
Cash invested: $179,697 (down + closing). Projections, not guarantees.
Landlord ↔ Tenant lean methodology
- Overall (STATE)
- 81 Strongly Landlord-Friendly
- State Missouri
- 81 Strongly Landlord-Friendly · R+10
- County
- — inherits STATE
- City
- — inherits STATE
ZIP-level market 64152
- Home prices YoY
- 4.7%
- Rents YoY
- 7.0%
- Active inventory
- 268
- Price-to-rent
- 18.5×
Monthly cashflow live
- Estimated rent
- $2,360 medium interval (Pro) →
- Mortgage (P&I)
- −$3,366
- Tax est. 1.5%
- −$802 /mo · $9,627/yr
- Insurance
- −$267
- HOA
- −$46
- Vacancy / Maint / Mgmt
- −$496
- Net cashflow
- $-2,617
Break-even live
Sensitivity live
| Price | -10% $-2,173 | -5% $-2,395 | +0% $-2,617 | +5% $-2,839 | +10% $-3,060 |
|---|---|---|---|---|---|
| Rent | -10% $-2,803 | -5% $-2,710 | +0% $-2,617 | +5% $-2,524 | +10% $-2,430 |
| Rate | -1.0pp $-2,294 | -0.5pp $-2,454 | base $-2,617 | +0.5pp $-2,783 | +1.0pp $-2,952 |
UW: 25.0% down · 7.5% · 30yr · 1.5% tax · 5.0% vac · 8.0% maint · 8.0% mgmt
Financing live
Cash to close
- Down payment
- $160,444
- Closing costs
- $19,253
- Reserves months
- —
- Total cash needed
- —
Loan-product check · same deal, 3 products live
Conventional
25% down · 7.5% · 30yr
- Down + closing
- —
- Monthly P&I
- —
- Monthly cashflow
- —
- DSCR
- —
- Eligible?
- —
Personal DTI + credit; lowest rate.
DSCR
20% down · 8.5% · 30yr
- Down + closing
- —
- Monthly P&I
- —
- Monthly cashflow
- —
- DSCR
- —
- Eligible?
- —
No personal income docs; deal must DSCR.
Hard money
10% down · 12.0% · 12mo
- Down + closing
- —
- Monthly P&I
- —
- Monthly cashflow
- —
- DSCR
- —
- Eligible?
- —
Short-term bridge; refi at stabilization.
Rent comps 4 comps
| Address | Beds | Baths | Sqft | Rent | $/sqft | DOM | Units | Dist |
|---|---|---|---|---|---|---|---|---|
| 8320 N Nodaway Ave Kansas City, MO | 3.0 | 2.5 | 1600 | $1,995 | $1.25 | 45d | 1 | 0.60mi |
| 8199 NW Milrey Dr Kansas City, MO | 3.0 | 2.5 | 1458 | $2,070 | $1.42 | 19d | 8 | 1.23mi |
| 9641 N Ambassador Dr Kansas City, MO | 1.0–3.0 | 1.0–2.0 | 1224 | $2,565 | $2.10 | 3d | 21 | 1.26mi |
| 8310 NW 77th Ter Kansas City, MO | 4.0 | 2.5 | 1792 | $2,399 | $1.34 | 5d | 1 | 1.27mi |
HOA detail
- Monthly dues
- $46 · $552/yr
Listing history 16 events
-
2026-06-21days on market $525,000 Active 284 DOM
-
2026-06-18days on market $525,000 Active 281 DOM
-
2026-06-17days on market $525,000 Active 280 DOM
-
2026-06-16days on market $525,000 Active 279 DOM
-
2026-06-15days on market $525,000 Active 278 DOM
-
2026-06-13days on market $525,000 Active 276 DOM
-
2026-06-13days on market $525,000 Active 275 DOM
-
2026-06-09days on market $525,000 Active 272 DOM
-
2026-06-08days on market $525,000 Active 271 DOM
-
2026-06-07days on market $525,000 Active 270 DOM
-
2026-06-03days on market $525,000 Active 266 DOM
-
2026-06-02days on market $525,000 Active 265 DOM
-
2026-06-01days on market $525,000 Active 264 DOM
-
2026-05-31days on market $525,000 Active 263 DOM
-
2025-12-16price $525,000 638-char remark
Show marketing remark (638 chars)
Welcome to the Greystone reverse 1.5 story plan-a modern design that blends timeless style with functional living. This home features a bright, open layout and elegant finishes throughout. The main level showcases a gourmet-inspired kitchen with a spacious walk-in pantry, a cozy fireplace, and a covered rear deck ideal for relaxing or entertaining. You'll also find both the primary suite and a secondary bedroom conveniently located on the main floor. The finished lower level expands your living space with two additional bedrooms, a full bath, and a generous rec room-perfect for game nights, movie marathons, or entertaining guests.
-
2025-09-10$450,000 Active 638-char remark
Show marketing remark (638 chars)
Welcome to the Greystone reverse 1.5 story plan-a modern design that blends timeless style with functional living. This home features a bright, open layout and elegant finishes throughout. The main level showcases a gourmet-inspired kitchen with a spacious walk-in pantry, a cozy fireplace, and a covered rear deck ideal for relaxing or entertaining. You'll also find both the primary suite and a secondary bedroom conveniently located on the main floor. The finished lower level expands your living space with two additional bedrooms, a full bath, and a generous rec room-perfect for game nights, movie marathons, or entertaining guests.
ⓘ Source: listings_history table (triggers on properties + properties_extension) + one-shot
backfill from property_details.listing_events for pre-trigger history.
Climate risk First Street
- Flood 1/10 Low FEMA zone X (unshaded) · 0% chance over 30 yrs
- Wildfire 1/10 Low
- Heat 3/10 Moderate 7 d/yr ≥107°F today · 16 d/yr by 30 yrs out
- Wind 2/10 Low
- Air quality 3/10 Moderate 2 unhealthy d/yr today · 3 by 30 yrs out
Nearby sold comps map
Loading sold comps map…
Walkable amenities ~0.75 mi
Loading nearby amenities…
Taxation est. · year 1
- Rental income
- $28,320
- − Mortgage interest
- −$35,949
- − Property taxes
- −$9,627
- − Insurance
- −$3,209
- − Repairs & maintenance
- −$2,266
- − Management
- −$2,266
- − HOA
- −$552
- − Depreciation
- −$18,670
- Taxable loss
- −$44,218
- Est. tax savings @ 24.0%
- +$10,612
- After-tax cash flow
- $-20,789/yr
For passive investors: Depreciation is non-cash, so a rental often shows a tax loss while cash-flowing — sheltering income. Rental losses are passive: they offset passive income freely, and up to $25,000/yr can offset ordinary (W-2) income if you actively participate and your MAGI is under $100k (phasing out to $0 by $150k); unused losses carry forward. On sale, claimed depreciation is recaptured at up to 25%, and gains may owe capital-gains tax (a 1031 exchange can defer both). Figures are a year-1 estimate at your 24.0% rate — not tax advice; consult a CPA.
Schools (NCES district)
- District
- Park Hill
- NCES district ID
- 2923550
- Math proficiency
- 47% ▼ -3.00%
- Reading proficiency
- 54% ▼ -3.00%
- Median HH income
- $67,616
- Composite
- 44.86/100
- National rank
- #2723
- State rank
- #26 of 324 in MO
Livability — Kansas City
- Score
- 78/100
- State rank
- #28
- US rank
- #2671
Category grades
Schools grade is shown separately in the Schools card above.
Census & demographics
- Census place
- Kansas City, MO
- County
- Platte County · 100,198 people
- City population
- 439,467
- Metro
- Kansas City, MO-KS
- Population (ZIP)
- 31,545
- Household income
- $114,688
- Rent vs Own
- Severe rent burden
- 234.0
Population outlook (Platte County) Hauer SSP2
- Today (2025)
- 111,772 people
- By 2030
- 119,173 · +6.6%
- By 2040
- 133,326 · +19.3%
- By 2050
- 146,617 · +31.2%
- By 2075
- 178,626 · +59.8%
- By 2100
- 195,638 · +75.0%
Race, ethnicity, and origin ACS 2023
- Neighborhood character
- Predominantly White (82%)
- Race & ethnicity
- White 82% Hispanic / Latino 7% Two or more races 6% Black 3% Asian 2%
- Hispanic origin (detail)
- Mexican 5% Puerto Rican 1%
- Common ancestry
- Romanian 4% Italian 4% Slovak 4%
- Foreign-born
- 4% · Canada, China
- Languages at home
- 93% English-only · Spanish 3% Other Indo-European 1% German/W. Germanic 1%
Political lean MEDSL · Platte
- 2024 margin
- Toss-up / Even · D 47.7% · R 50.8% · Other 1.4%
- 2008→2024 swing
- +3.2pp toward D · 2008: -6.4pp · 2024: -3.1pp
- All cycles
- 2024: R+3.1 2020: R+3.0 2016: R+13.0 2012: R+14.2 2008: R+6.4
Not yet ingested
- Civics
- —
Market trends
- HPI YoY
- ▲ 33.10%
- Current HPI
- 739.89
- Rent YoY
- ▲ 7.03%
- Metro
- Kansas City, MO-KS
- State GDP YoY
- ▲ 1.84%
- F500 in state
- 20
Industry mix (Fortune 500 HQ in MO)
| Industry | F500 HQs | Revenue |
|---|---|---|
| Healthcare | 1 | $163B |
|
||
| Insurance | 1 | $21B |
|
||
| Industrial Technology | 1 | $17B |
|
||
| Retail | 1 | $16B |
|
||
| Industrial Distribution | 1 | $10B |
|
||
| Utilities | 1 | $9B |
|
||
Price history
+16.7% since first listed2 events — show timeline
- 2025-12-16 Price Changed $525,000 Zillow
- 2025-09-10 Listed $450,000 Zillow
Cash-flow waterfall
monthlySold comps — $/sqft
last 12 mo · ≤1 miLoading sold comps…