 Duplex
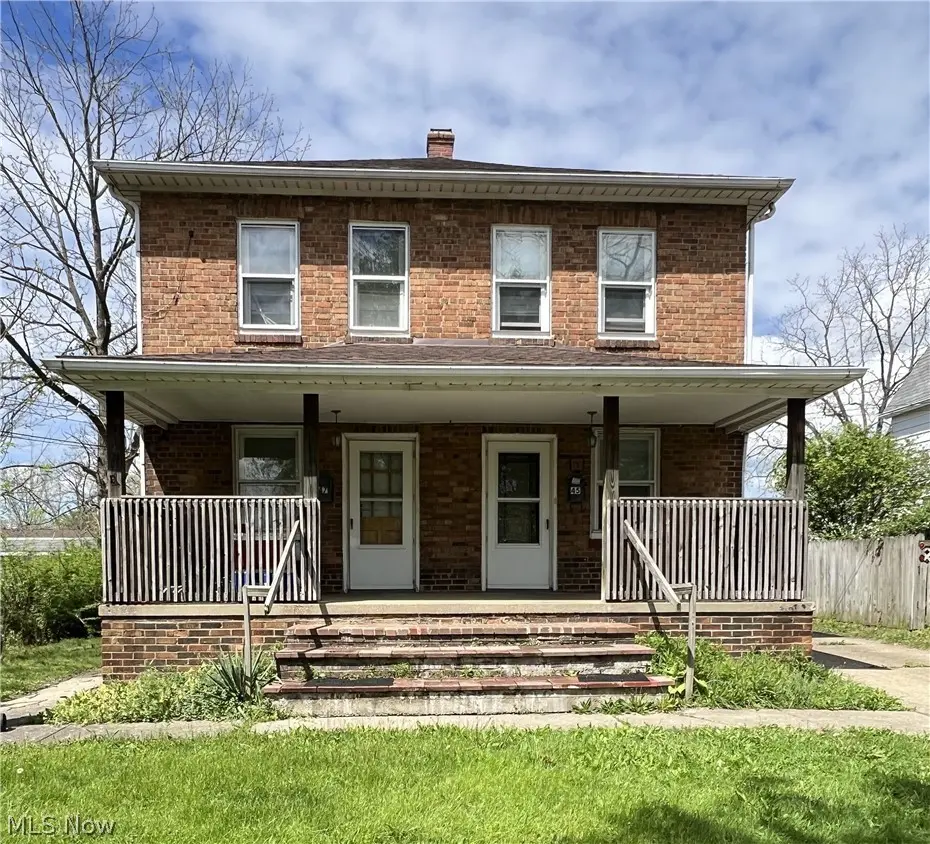
45 1st Ave · Bedford, OH
Flood risk 1/10 · Minimal
- FEMA flood zone
- X (unshaded)
- Chance of flooding over 30 yrs
- 0.0%
- Est. flood insurance / yr
- $473 – $860
Fire risk 1/10 · Minimal
- Est. fire insurance / yr
- $713 – $1,323
Heat risk 3/10 · Minor
- Hot days now (above 94°F)
- 7 days/yr
- Hot days in 30 yrs
- 18 days/yr
Wind risk 1/10 · Minimal
- Chance of severe wind over 30 yrs
- —
Air-quality risk 3/10 · Minor
- Unhealthy air days now
- 2 days/yr
- Unhealthy air days in 30 yrs
- 4 days/yr
Risk factors via First Street. Map © Google.
Why this score? — see what drove the D+ grade
The composite is a weighted blend of 9 inputs, each scored 0–100. Each bar is that input's sub-score; the figure is the points it added to the 100-point composite (weight × sub-score).
- Cash flow +21.3/30.0
- DSCR +6.8/10.0
- 1% rule +6.2/10.0
- Rent growth +4.0/5.0
- Livability +3.7/5.0
- ARV discount +2.7/15.0
- Condition / age +2.5/5.0
- Schools +2.2/10.0
- Appreciation +0.0/10.0
$219,000
🖨 Deal sheet 📄 Offer letter ✓ Due diligence
Multi-family units
County records classify this as Multi-Family (2-4 Unit). Listing-text estimate: 2 units. confirmed
Listing remarks
Welcome to 45 1st Ave, a classic brick side-by-side duplex nestled in the heart of Bedford. Blending timeless character with strong income potential, this well-maintained property is a standout opportunity for both seasoned investors and those looking to start building their portfolio. Each unit offers 2 spacious bedrooms and 1 full bath, complete with separate entrances and utilities—ideal for tenant privacy and simplified management. The property is already tenant-occupied, providing immediate and consistent cash flow from day one. With approximately 1,932 sq ft of total living space, this duplex delivers comfortable layouts and enduring construction. Recent updates—including
Key facts
- Immediate cash flow
- Newer water heaters
- Separate entrances
Tags
Property features AI
Finance
- Financial info: Gross monthly income reported as $2,022; Owner pays water, sewer and trash collection; tenants pay electricity and gas; Two rented units with actual rents listed approximately $983 and $1,039
Exterior
- Parking: Detached 2-car garage; Private paved driveway and parking lot
- Utilities: Public water; Public sewer
- Home design: Two-story building; 1 building
- Construction: Aluminum siding and brick exterior; Asphalt/fiberglass flat roof; Built according to public records
- Exterior features: Concrete and paved driveway; Detached garage and private parking lot; Parking includes driveway, detached garage, paved areas and private parking
Interior
- Kitchen: Range included
- Bedrooms: Two 2-bedroom units (each unit is 2 bedrooms)
- Bathrooms: Two full bathrooms (one in each unit)
- Heating & cooling: Forced-air gas heating; Central air conditioning
- Interior features: Common unfinished basement with interior entry and storage space; 10 total rooms
- Laundry & utility: Washer and dryer provided in basement
Neighborhood map
What this means for you Summary
Snapshot
- This is a 2 × 2-bed/1-bath units multifamily listed at $219k.
Deal economics
- At list price, monthly cash flow is $321 ($4k/yr) — positive. Per door: $161/mo.
- The deal already cash-flows at list — no discount required.
- Meets the 1% rule at list price ($2k rent vs $219k).
- Recommended offer: $212k (3.0% below list) — sets the bar for market timing.
- Cap rate 8.1% vs local median 5.4% in Bedford — top-decile yield for the area; either an underpriced asset or a hidden risk that comps aren't pricing in. Stress-test before assuming the spread holds.
Location & tenants
- Location reads 73/100 on livability (#324 in OH) — a middle-class / working-renter tenant base. Strengths: crime A+, cost of living A+, housing A+; Watch: amenities F, commute F, employment D-.
- Bedford City (suburban): math 19% / reading 32% proficiency, ranked #597 of 656 in OH (top 91%) — low school quality limits family demand, transient renter base, plan for 1-2y turnover.
- Market conditions: Rents rising fast (+5.8%/yr); 105 active listings in the ZIP; 4 comparable units currently listed for rent nearby; rentals at typical pace (median 16d on market — plan ~3-4 weeks tenant-placement turnaround); 1,441 units permitted in Cuyahoga County in 2024 (700 in 5+ unit buildings).
- At $2,462/mo this rent would consume 54% of the median local household income ($55k/yr) (locally 1314% of renters already pay >50% of income on rent) — very limited rent-growth headroom before tenants either downsize or default.
Forward outlook
- Local home prices are declining (-3.0%/yr); year-one equity from $2k of loan paydown is wiped out by about $7k of value loss. Plan a longer hold.
- Cuyahoga County population projected to shrink 8% by 2050 — rents likely to lag national; underwrite the cash flow, not the appreciation.
- At projected returns (-3.0% appreciation + 5.8% rent growth), your $61k cash investment doubles in ~10 years — after that, you're playing with house money.
Negotiation context
- It's been on market 48 days — a 3% lower offer ($212k) is reasonable based on typical stale-listing flexibility.
- 4 sale attempts since 27y ago with the ask held roughly flat each time — persistent listings suggest the price (not the market) is what's stuck; bring a comps-based counter.
- Current owner paid $127k; list at $219k implies a 72% gain — meaningful room to come down on a strong offer.
Risks & watch-outs
- Watch-outs: built in 1904 — expect roof / HVAC / electrical / plumbing capex.
Questions for the listing agent
- It's been on market 48 days. Have you received any prior offers? Is the seller open to a 3% concession, seller financing, or rate buy-down credit?
- Can we see the unit-by-unit rent roll, current vacancy, and any below-market leases? What's the average tenancy length?
- What capital expenditures (roof, boiler, parking lot, exteriors) have been made in the last 5 years, and what's planned in the next 2?
- Built in 1904 — when were the roof, HVAC, electrical panel, plumbing, and water heater last replaced?
- Is there a deadline driving the sale (1031 exchange, divorce, estate, relocation)? That informs how much negotiation room exists.
- The area grade is low — what's the realistic commute time and amenity access for the typical tenant pool here? Any planned neighborhood developments (good or bad) we should know about?
- What's the average days-on-market for RENTAL listings here right now (not sales)? A rising rental-DOM trend means longer vacancies and softer asking-rent achievability than the comps imply.
- What's the recent tenant-quality profile in this submarket — average credit score on applications, eviction rate, late-payment / NSF rate, and stable-employment percentage? A property-management company in the area should have these aggregated.
- How much new apartment / multifamily construction is in the pipeline within 1–3 miles? Heavy new supply (>2% of stock underway) typically softens rents 12–24 months out; light construction supports rent growth.
Investment metrics
- 1% rule
- 1.12% ✓
- Cap rate
- 8.05%
- Cash-on-cash
- 6.29%
- DSCR
- 1.28
- GRM
- 7.4
CMA / ARV
- ARV (median comp)
- $198,014
- List price
- $219,000
- Delta
- 10.60%
- Verdict
- OVERPRICED
- Comps
- 20 within 1.0 mi
Show comp detail 3 sales within ~0.75 mi
| Address | Dist | Beds/Ba | Sqft | Sold | Price | $/sf | Match |
|---|---|---|---|---|---|---|---|
| 80 Egbert Rd | 0.13mi | 4/2.0 | 1,818 (-6%) | 5mo | $80,000 | $44 | 80 |
| 25 Taylor Rd | 0.42mi | 4/2.0 | 2,162 (+12%) | 12mo | $230,000 | $106 | 51 |
| 16 Brown Ln | 0.63mi | 4/2.0 | 1,697 (-12%) | 10mo | $167,500 | $99 | 42 |
Match score weights: distance 35% · size 25% · config 20% · recency 20%. Top-matched comps best support the ARV.
Projected returns pro-forma
-3.0% appreciation · 5.83% rent growth · sell at horizon
- IRR
- -3.2%
- Equity multiple
- 0.87×
- Total profit
- $-7,706
- Equity at exit
- $32,654
- IRR
- 9.6%
- Equity multiple
- 1.84×
- Total profit
- $51,421
- Equity at exit
- $18,935
Cash invested: $61,320 (down + closing). Projections, not guarantees.
Landlord ↔ Tenant lean methodology
- Overall (STATE)
- 73 Landlord-Friendly
- State Ohio
- 73 Landlord-Friendly · R+6
- County
- — inherits STATE
- City
- — inherits STATE
ZIP-level market 44146
- Rents YoY
- 5.8%
- Active inventory
- 105
- Price-to-rent
- 14.8×
Monthly cashflow live
- Estimated rent
- $2,462 high interval (Pro) →
- Mortgage (P&I)
- −$1,148
- Tax from tax record
- −$384 /mo · $4,607/yr
- Insurance
- −$91
- HOA
- −$0
- Vacancy / Maint / Mgmt
- −$517
- Net cashflow
- $321
Break-even live
2-unit breakdown (identical units grouped — click to expand)
| Units | Beds | Baths | Est. rent |
|---|---|---|---|
| 2× units | 2 | 1 | $2,462 |
| #1 | 2 | 1 | $1,231 |
| #2 | 2 | 1 | $1,231 |
| Total (2 units) | $2,462 | ||
UW: 25.0% down · 7.5% · 30yr · 1.5% tax · 5.0% vac · 8.0% maint · 8.0% mgmt
Financing live
Cash to close
- Down payment
- $54,750
- Closing costs
- $6,570
- Reserves months
- —
- Total cash needed
- —
Loan-product check · same deal, 3 products live
Conventional
25% down · 7.5% · 30yr
- Down + closing
- —
- Monthly P&I
- —
- Monthly cashflow
- —
- DSCR
- —
- Eligible?
- —
Personal DTI + credit; lowest rate.
DSCR
20% down · 8.5% · 30yr
- Down + closing
- —
- Monthly P&I
- —
- Monthly cashflow
- —
- DSCR
- —
- Eligible?
- —
No personal income docs; deal must DSCR.
Hard money
10% down · 12.0% · 12mo
- Down + closing
- —
- Monthly P&I
- —
- Monthly cashflow
- —
- DSCR
- —
- Eligible?
- —
Short-term bridge; refi at stabilization.
Rent comps 4 comps
| Address | Beds | Baths | Sqft | Rent | $/sqft | DOM | Units | Dist |
|---|---|---|---|---|---|---|---|---|
| 330 Paul St Bedford, OH | 3.0 | 2.0 | 1891 | $1,600 | $0.85 | 10d | 1 | 0.60mi |
| 7287 Wright Ave Bedford, OH | 3.0 | 1.0 | 1752 | $1,795 | $1.02 | 43d | 1 | 0.97mi |
| 14 Elm St Bedford, OH | 3.0 | 2.0 | 2184 | $1,600 | $0.73 | 2d | 1 | 1.15mi |
| 286 W Grace St Bedford, OH | 3.0 | 1.0 | 1254 | $1,500 | $1.20 | 16d | 1 | 1.25mi |
Listing history 27 events
-
2026-06-18days on market $219,000 Active 48 DOM
-
2026-06-17days on market $219,000 Active 47 DOM
-
2026-06-16days on market $219,000 Active 46 DOM
-
2026-06-15days on market $219,000 Active 45 DOM
-
2026-06-13days on market $219,000 Active 43 DOM
-
2026-06-09days on market $219,000 Active 39 DOM
-
2026-06-08days on market $219,000 Active 38 DOM
-
2026-06-07days on market $219,000 Active 37 DOM
-
2026-06-05days on market $219,000 Active 34 DOM
-
2026-06-03days on market $219,000 Active 33 DOM
-
2026-06-02days on market $219,000 Active 32 DOM
-
2026-06-01days on market $219,000 Active 31 DOM
-
2026-05-31days on market $219,000 Active 30 DOM
-
2026-05-01$219,000 Active 1361-char remark
-
2026-04-30historical
-
2026-02-24price $224,900
-
2025-11-06$229,000 Active
-
2023-06-16historical
-
2023-03-22price $184,900
-
2023-02-23price $189,000
-
2022-08-15$199,000 Active
-
2004-03-31soldstatus $127,000
-
2000-04-28soldstatus $67,500
-
1999-12-10$62,400
-
1996-08-01soldstatus $88,000
-
1978-03-01soldstatus $37,000
-
1978-03-01soldstatus $37,000
ⓘ Source: listings_history table (triggers on properties + properties_extension) + one-shot
backfill from property_details.listing_events for pre-trigger history.
Tax reassessment forecast OH · Partial reset (capped growth)
- Current annual tax
- $4,607 · $384/mo
- Projected year-2 tax
- $4,607 · $384/mo
- Expected delta
- $0/yr ($0/mo · 0.0%)
ⓘ Screening estimate from a state-policy table — verify with the county assessor before closing.
Climate risk First Street
- Flood 1/10 Low FEMA zone X (unshaded) · 0% chance over 30 yrs
- Wildfire 1/10 Low
- Heat 3/10 Moderate 7 d/yr ≥94°F today · 18 d/yr by 30 yrs out
- Wind 1/10 Low
- Air quality 3/10 Moderate 2 unhealthy d/yr today · 4 by 30 yrs out
Nearby sold comps map
Loading sold comps map…
Walkable amenities ~0.75 mi
Loading nearby amenities…
Taxation est. · year 1
- Rental income
- $29,544
- − Mortgage interest
- −$12,267
- − Property taxes
- −$4,607
- − Insurance
- −$1,095
- − Repairs & maintenance
- −$2,364
- − Management
- −$2,364
- − Depreciation
- −$6,371
- Taxable income
- $477
- Est. tax owed @ 24.0%
- −$114
- After-tax cash flow
- $3,742/yr
For passive investors: Depreciation is non-cash, so a rental often shows a tax loss while cash-flowing — sheltering income. Rental losses are passive: they offset passive income freely, and up to $25,000/yr can offset ordinary (W-2) income if you actively participate and your MAGI is under $100k (phasing out to $0 by $150k); unused losses carry forward. On sale, claimed depreciation is recaptured at up to 25%, and gains may owe capital-gains tax (a 1031 exchange can defer both). Figures are a year-1 estimate at your 24.0% rate — not tax advice; consult a CPA.
Schools (NCES district)
- District
- Bedford City
- NCES district ID
- 3910017
- Math proficiency
- 19% ▼ -23.00%
- Reading proficiency
- 32% ▼ -16.00%
- Median HH income
- $42,353
- Composite
- 21.69/100
- National rank
- #8273
- State rank
- #597 of 656 in OH
Livability — Bedford
- Score
- 73/100
- State rank
- #324
- US rank
- #5334
Category grades
Schools grade is shown separately in the Schools card above.
Census & demographics
- Census place
- Bedford, OH
- County
- Cuyahoga County · 1,090,369 people
- City population
- 29,349
- Metro
- Cleveland-Elyria, OH
- Population (ZIP)
- 29,349
- Household income
- $54,925
- Rent vs Own
- Severe rent burden
- 1314.0
Population outlook (Cuyahoga County) Hauer SSP2
- Today (2025)
- 1,244,621 people
- By 2030
- 1,230,093 · -1.2%
- By 2040
- 1,189,108 · -4.5%
- By 2050
- 1,145,706 · -7.9%
- By 2075
- 1,076,557 · -13.5%
- By 2100
- 978,987 · -21.3%
Race, ethnicity, and origin ACS 2023
- Neighborhood character
- Majority Black (59%)
- Race & ethnicity
- Black 59% White 33% Two or more races 6% Hispanic / Latino 3%
- Common ancestry
- Romanian 5% Serbian 1% Armenian 1%
- Foreign-born
- 2% · Canada
- Languages at home
- 96% English-only · Spanish 2% Arabic 1%
Political lean MEDSL · Cuyahoga
- 2024 margin
- Solid D (+31.5) · D 65.4% · R 33.9%
- 2008→2024 swing
- -7.4pp toward R · 2008: 38.9pp · 2024: 31.5pp
- All cycles
- 2024: D+31.5 2020: D+34.1 2016: D+35.0 2012: D+38.7 2008: D+38.9
Not yet ingested
- Civics
- —
Market trends
- HPI YoY
- ▼ -114.08%
- Current HPI
- 172.9421
- Rent YoY
- ▲ 5.83%
- Metro
- Cleveland-Elyria, OH
- State GDP YoY
- ▲ 1.98%
- F500 in state
- 48
Industry mix (Fortune 500 HQ in OH)
| Industry | F500 HQs | Revenue |
|---|---|---|
| Insurance | 3 | $145B |
|
||
| Industrial Machinery | 3 | $49B |
|
||
| Financial Services | 3 | $24B |
|
||
| Consumer Goods | 2 | $93B |
|
||
| Aerospace / Defense | 2 | $47B |
|
||
| Utilities | 2 | $33B |
|
||
Price history
+491.9% since first listed14 events — show timeline
- 2026-05-01 Listed $219,000 MLSNOW
- 2026-04-30 Listing Removed — MLSNOW
- 2026-02-24 Price Changed $224,900 MLSNOW
- 2025-11-06 Listed $229,000 MLSNOW
- 2023-06-16 Listing Removed — MLSNOW
- 2023-03-22 Price Changed $184,900 MLSNOW
- 2023-02-23 Price Changed $189,000 MLSNOW
- 2022-08-15 Listed $199,000 MLSNOW
- 2004-03-31 Sold (Public Records) $127,000 Public Records
- 2000-04-28 Sold (MLS) $67,500 MLSNOW
- 1999-12-10 Listed $62,400 MLSNOW
- 1996-08-01 Sold (Public Records) $88,000 Public Records
- 1978-03-01 Sold (Public Records) $37,000 Public Records
- 1978-03-01 Sold (Public Records) $37,000 Public Records
Property tax history
+5.5%/yrLatest (2025): $4,607 · +1.8% YoY. Source: county tax records.
Cash-flow waterfall
monthlySold comps — $/sqft
last 12 mo · ≤1 miLoading sold comps…