67th St · Overland Park, KS
Flood risk No data
- FEMA flood zone
- —
- Chance of flooding over 30 yrs
- —
- Est. flood insurance / yr
- —
Fire risk No data
- Est. fire insurance / yr
- —
Heat risk No data
- Hot days now (above threshold)
- —
- Hot days in 30 yrs
- —
Wind risk No data
- Chance of severe wind over 30 yrs
- —
Air-quality risk No data
- Unhealthy air days now
- —
- Unhealthy air days in 30 yrs
- —
Risk factors via First Street. Map © Google.
Why this score? — see what drove the C+ grade
The composite is a weighted blend of 9 inputs, each scored 0–100. Each bar is that input's sub-score; the figure is the points it added to the 100-point composite (weight × sub-score).
- Cash flow +26.1/30.0
- DSCR +8.8/10.0
- ARV discount +7.5/15.0
- 1% rule +7.0/10.0
- Livability +4.0/5.0
- Schools +3.8/10.0
- Rent growth +3.7/5.0
- Condition / age +2.5/5.0
- Appreciation +0.0/10.0
$196,000
🖨 Deal sheet (PDF) 📄 Offer letter ✓ Due diligence
Listing remarks MLS
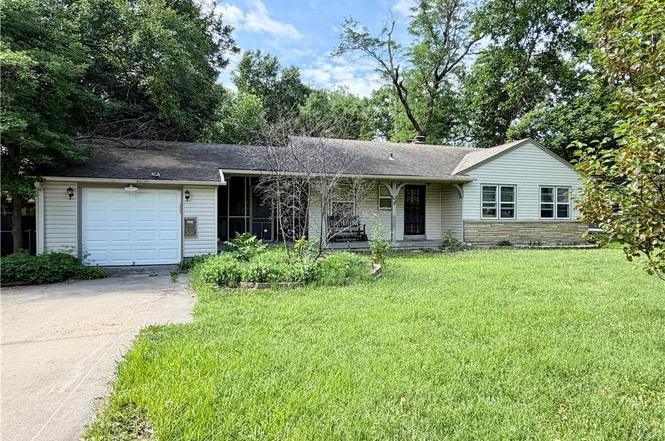
his expansive parcel of land, approximately 18 acres in size, presents an enticing opportunity for development. Nestled amidst a charming backdrop of established neighborhoods, this pristine plot is awaiting a precise survey to confirm its exact dimensions. With an ideal location close to Shawnee Golf and Country Club, this rolling topography provides a picturesque canvas for crafting a residential haven, offering the perfect blend of serene suburban living and convenient access to amenities. Don't miss the chance to transform this blank canvas into a residential neighborhood.
Key facts
- Full basement
- 0.27 acre lot
- Garage
Tags
Property features AI
Exterior
- Parking: Attached 1-car garage
- Utilities: Public water; Public sewer
- Home design: Single-family residence; Ranch floor plan; Residential property
- Construction: Stone and frame with vinyl siding; Composition roof
- Exterior features: Patio; Screened porch; Shed(s)
Interior
- Kitchen: Electric range; Dishwasher; Disposal; Refrigerator
- Bedrooms: Three bedrooms on the main level
- Flooring: Wood floor
- Bathrooms: One full bath and one half bath
- Heating & cooling: Natural gas heating; Electric cooling; Attic fan
- Interior features: Wood flooring throughout main level spaces; Full basement with sump pump; Sauna
- Laundry & utility: Washer and dryer included
Neighborhood map
What this means for you Summary
Snapshot
- This is a 3-bed/1.5-bath land listed at $196k.
Deal economics
- At list price, monthly cash flow is $496 ($6k/yr) — positive.
- The deal already cash-flows at list — no discount required.
- Meets the 1% rule at list price ($2k rent vs $196k).
- Cap rate 9.3% vs local median 3.9% in Overland Park — top-decile yield for the area; either an underpriced asset or a hidden risk that comps aren't pricing in. Stress-test before assuming the spread holds.
Location & tenants
- Location reads 80/100 on livability (#16 in KS, #1,851 nationally) — a professional / high-income tenant draw. Strengths: employment A+, housing A+, crime B; Watch: health & safety C-, commute D+.
- Shawnee Mission Pub Schools (suburban): math 38% / reading 46% proficiency, ranked #22 of 169 in KS (top 13%) — families likely to look elsewhere, expect single-tenant / working-renter base with shorter leases.
- Zoned schools: Santa Fe Trail Elem (math 47% / reading 47%, grade D-, #200 of 684 statewide, top 33%, 313 students, 33% FRL) — zoned schools at 33% FRL track the district average.
- Market conditions: Rents rising fast (+4.8%/yr); 70 active listings in the ZIP; 21 comparable units currently listed for rent nearby; rentals at typical pace (median 22d on market — plan ~3-4 weeks tenant-placement turnaround); solid renter incomes; 2,969 units permitted in Johnson County in 2024 (1,066 in 5+ unit buildings).
- This rent runs 37% of the median local income ($76k/yr) — at the standard rent-burdened threshold; future hikes will face affordability resistance.
Forward outlook
- Local home prices are declining (-3.0%/yr); year-one equity from $1k of loan paydown is wiped out by about $6k of value loss. Plan a longer hold.
- Johnson County population projected at +27% by 2050 — long-run rental-demand tailwind backs the buy-and-hold thesis.
- At projected returns (-3.0% appreciation + 4.8% rent growth), your $55k cash investment doubles in ~9 years — after that, you're playing with house money.
Negotiation context
- Only 1 days on market — expect competitive offers; lowballing is unlikely to land.
- 2 sale attempts since 3y ago; this cycle's ask has dropped $1.04M (84%) from the opening price — seller is motivated, your offer sets the floor, not the list.
Risks & watch-outs
- Watch-outs: built in 1952 — expect roof / HVAC / electrical / plumbing capex.
Questions for the listing agent
- Built in 1952 — when were the roof, HVAC, electrical panel, plumbing, and water heater last replaced?
- Is there a deadline driving the sale (1031 exchange, divorce, estate, relocation)? That informs how much negotiation room exists.
- Schools are B-rated — typically a magnet for longer-tenancy family renters. What's the average tenant stay here, and is there a school-zone premium baked into asking?
- What's the average days-on-market for RENTAL listings here right now (not sales)? A rising rental-DOM trend means longer vacancies and softer asking-rent achievability than the comps imply.
- What's the recent tenant-quality profile in this submarket — average credit score on applications, eviction rate, late-payment / NSF rate, and stable-employment percentage? A property-management company in the area should have these aggregated.
- How much new for-sale + rental construction is in the pipeline within 1–3 miles? Heavy new supply typically softens prices + rents 12–24 months out; constrained supply supports both.
Investment metrics
- 1% rule
- 1.20% ✓
- Cap rate
- 9.33%
- Cash-on-cash
- 10.85%
- DSCR
- 1.48
- GRM
- 7.0
CMA / ARV
No comps found within radius.
Projected returns pro-forma
-3.0% appreciation · 4.79% rent growth · sell at horizon
- IRR
- 1.9%
- Equity multiple
- 1.08×
- Total profit
- $4,159
- Equity at exit
- $29,224
- IRR
- 13.2%
- Equity multiple
- 2.14×
- Total profit
- $62,720
- Equity at exit
- $16,946
Cash invested: $54,880 (down + closing). Projections, not guarantees.
Landlord ↔ Tenant lean methodology
- Overall (STATE)
- 83 Strongly Landlord-Friendly
- State Kansas
- 83 Strongly Landlord-Friendly · R+10
- County
- — inherits STATE
- City
- — inherits STATE
ZIP-level market 66204
- Rents YoY
- 4.8%
- Active inventory
- 70
- Price-to-rent
- 7.0×
Monthly cashflow live
- Estimated rent
- $2,342 high interval (Pro) →
- Mortgage (P&I)
- −$1,028
- Tax est. 1.5%
- −$245 /mo · $2,940/yr
- Insurance
- −$82
- HOA
- −$0
- Vacancy / Maint / Mgmt
- −$492
- Net cashflow
- $496
Break-even live
Sensitivity live
| Price | -10% $631 | -5% $564 | +0% $496 | +5% $428 | +10% $361 |
|---|---|---|---|---|---|
| Rent | -10% $311 | -5% $403 | +0% $496 | +5% $589 | +10% $681 |
| Rate | -1.0pp $595 | -0.5pp $546 | base $496 | +0.5pp $445 | +1.0pp $394 |
UW: 25.0% down · 7.5% · 30yr · 1.5% tax · 5.0% vac · 8.0% maint · 8.0% mgmt
Financing live
Cash to close
- Down payment
- $49,000
- Closing costs
- $5,880
- Reserves months
- —
- Total cash needed
- —
Loan-product check · same deal, 3 products live
Conventional
25% down · 7.5% · 30yr
- Down + closing
- —
- Monthly P&I
- —
- Monthly cashflow
- —
- DSCR
- —
- Eligible?
- —
Personal DTI + credit; lowest rate.
DSCR
20% down · 8.5% · 30yr
- Down + closing
- —
- Monthly P&I
- —
- Monthly cashflow
- —
- DSCR
- —
- Eligible?
- —
No personal income docs; deal must DSCR.
Hard money
10% down · 12.0% · 12mo
- Down + closing
- —
- Monthly P&I
- —
- Monthly cashflow
- —
- DSCR
- —
- Eligible?
- —
Short-term bridge; refi at stabilization.
Rent comps 21 comps
| Address | Beds | Baths | Sqft | Rent | $/sqft | DOM | Units | Dist |
|---|---|---|---|---|---|---|---|---|
| 7108 W 67th St Mission, KS | 3.0 | 1.5 | 1176 | $1,650 | $1.40 | 17d | 1 | 0.61mi |
| 6645 Floyd St Overland Park, KS | 3.0 | 1.0 | 1025 | $1,695 | $1.65 | 11d | 1 | 0.63mi |
| 5309 W 71st St Prairie Village, KS | 3.0 | 2.0 | 987 | $2,800 | $2.84 | 8d | 1 | 0.70mi |
| 6115 Glenwood Ave Mission, KS | 3.0 | 2.0 | 988 | $850 | $0.86 | 24d | 1 | 0.81mi |
| 7335 Nall Ave Prairie Village, KS | 4.0 | 2.0 | 1486 | $2,695 | $1.81 | 13d | 1 | 0.92mi |
| 7329 Ash St Prairie Village, KS | 3.0 | 2.0 | 1400 | $4,750 | $3.39 | 24d | 1 | 0.95mi |
| 7434 Maple Ln Overland Park, KS | 3.0 | 1.0 | 900 | $1,975 | $2.19 | 24d | 1 | 0.97mi |
| 6313 W 75th St Overland Park, KS | 1.0–2.0 | 1.0 | 950 | $3,586 | $3.77 | 11d | 1 | 1.00mi |
| 7109 Conser St Overland Park, KS | 4.0 | 2.0 | 1706 | $2,600 | $1.52 | 8d | 1 | 1.00mi |
| 5717 W 75th St Prairie Village, KS | 3.0 | 1.0 | 950 | $1,950 | $2.05 | 24d | 1 | 1.01mi |
| 6201 Johnson Dr Mission, KS | 2.0 | 1.0–2.0 | 884 | $2,695 | $3.05 | 2d | 15 | 1.02mi |
| 4631 W 62nd Ter Fairway, KS | 3.0 | 2.0 | 1380 | $2,165 | $1.57 | 24d | 1 | 1.12mi |
| 5399 Martway St Unit 535 Mission, KS | 2.0 | 2.0 | 1355 | $2,645 | $1.95 | 24d | 1 | 1.14mi |
| 6801 W 76th St Overland Park, KS | 2.0 | 1.0–2.0 | 1300 | $1,972 | $1.52 | 24d | 2 | 1.15mi |
| 6410 Lowell Ave Mission, KS | 3.0 | 2.0 | 1152 | $1,995 | $1.73 | 15d | 1 | 1.16mi |
| 5808 Nall Ave Unit 5555231 Mission, KS | 2.0 | 2.0 | 1150 | $2,475 | $2.15 | 24d | 1 | 1.21mi |
| 5739 Beverly Ln Mission, KS | 2.0 | 1.0 | 1000 | $2,100 | $2.10 | 8d | 1 | 1.22mi |
| 7818 W 61st Ter Mission, KS | 3.0 | 2.5 | 1426 | $1,700 | $1.19 | 22d | 1 | 1.26mi |
| 4300 W 71st Ter Prairie Village, KS | 4.0 | 2.0 | 1492 | $3,200 | $2.14 | 8d | 1 | 1.27mi |
| 7512 Newton St Overland Park, KS | 3.0 | 2.0 | 1295 | $2,095 | $1.62 | 24d | 1 | 1.40mi |
| 7821 Birch St Prairie Village, KS | 3.0 | 1.0 | 930 | $1,950 | $2.10 | 24d | 1 | 1.48mi |
Listing history 2 events
-
2026-06-19remarks 454-char remark
-
2026-06-19$196,000 Coming Soon 1 DOM
ⓘ Source: listings_history table (triggers on properties + properties_extension) + one-shot
backfill from property_details.listing_events for pre-trigger history.
Nearby sold comps map
Loading sold comps map…
Walkable amenities ~0.75 mi
Loading nearby amenities…
Taxation est. · year 1
- Rental income
- $28,109
- − Mortgage interest
- −$10,979
- − Property taxes
- −$2,940
- − Insurance
- −$980
- − Repairs & maintenance
- −$2,249
- − Management
- −$2,249
- − Depreciation
- −$5,702
- Taxable income
- $3,011
- Est. tax owed @ 24.0%
- −$723
- After-tax cash flow
- $5,229/yr
For passive investors: Depreciation is non-cash, so a rental often shows a tax loss while cash-flowing — sheltering income. Rental losses are passive: they offset passive income freely, and up to $25,000/yr can offset ordinary (W-2) income if you actively participate and your MAGI is under $100k (phasing out to $0 by $150k); unused losses carry forward. On sale, claimed depreciation is recaptured at up to 25%, and gains may owe capital-gains tax (a 1031 exchange can defer both). Figures are a year-1 estimate at your 24.0% rate — not tax advice; consult a CPA.
Schools (NCES district)
- District
- Shawnee Mission Pub Schools
- NCES district ID
- 2011640
- Math proficiency
- 38% ▼ -6.00%
- Reading proficiency
- 46% ▼ -2.00%
- Median HH income
- $64,923
- Composite
- 37.55/100
- National rank
- #4391
- State rank
- #22 of 169 in KS
Livability — Overland Park
- Score
- 80/100
- State rank
- #16
- US rank
- #1851
Category grades
Schools grade is shown separately in the Schools card above.
Census & demographics
- Census place
- Overland Park, KS
- County
- Johnson County · 574,662 people
- City population
- 180,138
- Metro
- Kansas City, MO-KS
- Population (ZIP)
- 17,948
- Household income
- $75,889
- Rent vs Own
- Severe rent burden
- 935.0
Population outlook (Johnson County) Hauer SSP2
- Today (2025)
- 663,396 people
- By 2030
- 702,585 · +5.9%
- By 2040
- 775,386 · +16.9%
- By 2050
- 841,772 · +26.9%
- By 2075
- 994,137 · +49.9%
- By 2100
- 1,073,036 · +61.7%
Race, ethnicity, and origin ACS 2023
- Neighborhood character
- Predominantly White (71%)
- Race & ethnicity
- White 71% Hispanic / Latino 17% Two or more races 10% Black 7% Asian 1%
- Hispanic origin (detail)
- Mexican 10%
- Common ancestry
- Romanian 2% Serbian 2% Slovak 2%
- Foreign-born
- 9% · Canada
- Languages at home
- 85% English-only · Spanish 11% Other Indo-European 1% Arabic 1%
Political lean MEDSL · Johnson
- 2024 margin
- Lean D (+8.5) · D 53.4% · R 44.9% · Other 1.8%
- 2008→2024 swing
- +17.5pp toward D · 2008: -9.0pp · 2024: 8.5pp
- All cycles
- 2024: D+8.5 2020: D+8.2 2016: R+2.7 2012: R+17.8 2008: R+9.0
Not yet ingested
- Civics
- —
Market trends
- HPI YoY
- ▼ -355.92%
- Current HPI
- 266.5058
- Rent YoY
- ▲ 4.79%
- Metro
- Kansas City, MO-KS
- State GDP YoY
- —
- F500 in state
- 0
Price history
-80.2% since first listed6 events — show timeline
- 2026-06-18 Coming Soon $196,000 Heartland MLS as Distributed by MLS Grid
- 2024-12-17 Sold (MLS) — Heartland MLS as Distributed by MLS Grid
- 2024-09-20 Pending — Heartland MLS as Distributed by MLS Grid
- 2024-08-16 Listing Removed — Heartland MLS as Distributed by MLS Grid
- 2024-08-16 Listed $1,238,050 Heartland MLS as Distributed by MLS Grid
- 2023-09-13 Listed $990,000 Heartland MLS as Distributed by MLS Grid
Cash-flow waterfall
monthlySold comps — $/sqft
last 12 mo · ≤1 miLoading sold comps…