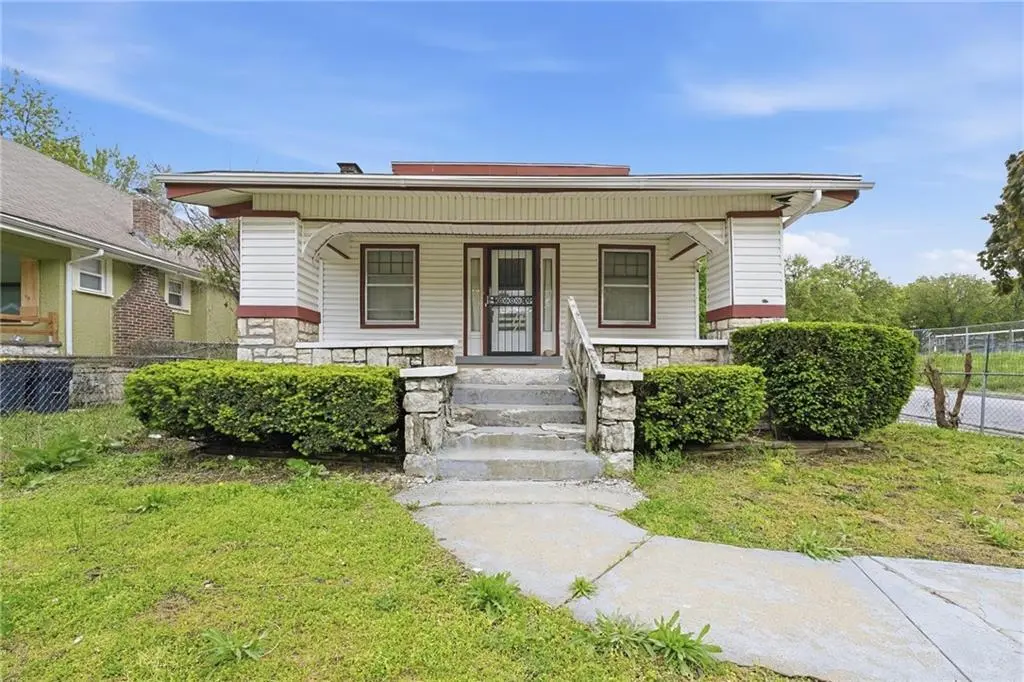
3547 Bellefontaine Ave · Kansas City, MO
Flood risk 1/10 · Minimal
- FEMA flood zone
- X (unshaded)
- Chance of flooding over 30 yrs
- 0.0%
- Est. flood insurance / yr
- $473 – $860
Fire risk 1/10 · Minimal
- Est. fire insurance / yr
- $1,054 – $1,958
Heat risk 4/10 · Minor
- Hot days now (above 107°F)
- 7 days/yr
- Hot days in 30 yrs
- 17 days/yr
Wind risk 2/10 · Minimal
- Chance of severe wind over 30 yrs
- —
Air-quality risk 3/10 · Minor
- Unhealthy air days now
- 2 days/yr
- Unhealthy air days in 30 yrs
- 3 days/yr
Risk factors via First Street. Map © Google.
Why this score? — see what drove the A grade
The composite is a weighted blend of 9 inputs, each scored 0–100. Each bar is that input's sub-score; the figure is the points it added to the 100-point composite (weight × sub-score).
- Cash flow +30.0/30.0
- ARV discount +15.0/15.0
- 1% rule +10.0/10.0
- DSCR +10.0/10.0
- Appreciation +10.0/10.0
- Livability +3.9/5.0
- Rent growth +3.7/5.0
- Condition / age +2.5/5.0
- Schools +1.5/10.0
$95,000
🖨 Deal sheet (PDF) 📄 Offer letter ✓ Due diligence
Listing remarks MLS
This 3-bedroom, 1-bath home presents a strong investment opportunity with solid potential for value-add improvements. With a practical layout and appealing footprint, it offers flexibility for rental income or future resale. Ideal for investors seeking their next project in a promising setting.
Key facts
- 5,227 sq ft lot
- Built 1921
- Listed 13 days
Neighborhood map
What this means for you Summary
Snapshot
- This is a 4-bed/1.0-bath single-family listed at $95k.
Deal economics
- At list price, monthly cash flow is $629 ($8k/yr) — positive.
- The deal already cash-flows at list — no discount required.
- Meets the 1% rule at list price ($2k rent vs $95k).
- Cap rate 14.2% vs local median 3.9% in Kansas City — top-decile yield for the area; either an underpriced asset or a hidden risk that comps aren't pricing in. Stress-test before assuming the spread holds.
Location & tenants
- Location reads 78/100 on livability (#28 in MO, #2,671 nationally) — a middle-class / working-renter tenant base. Strengths: amenities A+, commute A+, cost of living A+; Watch: crime F.
- Kansas City 33 (urban): math 12% / reading 24% proficiency, ranked #308 of 324 in MO (top 95%) — low school quality limits family demand, transient renter base, plan for 1-2y turnover; 75% free/reduced lunch — lower-income household profile, screen leases tightly.
- Zoned schools: M. L. King Elementary (math 2% / reading 8%, grade F, #1,072 of 1,115 statewide, top 98%, 665 students, 100% FRL); Central Middle School (math 0% / reading 9%, grade F, #388 of 391 statewide, top 99%, 428 students, 99% FRL); Central High School (math 2% / reading 17%, grade F, #507 of 521 statewide, top 98%, 535 students, 99% FRL) — zoned schools average 99% FRL vs 75% district-wide (24 pts higher); higher-poverty schools than district average — tighter screening recommended.
- Market conditions: Rents rising fast (+4.7%/yr); 87 active listings in the ZIP; 36 comparable units currently listed for rent nearby; rentals at typical pace (median 25d on market — plan ~3-4 weeks tenant-placement turnaround); lower-income renter base — watch delinquency; 4,002 units permitted in Jackson County in 2024 (2,271 in 5+ unit buildings).
- At $1,548/mo this rent would consume 51% of the median local household income ($36k/yr) (locally 946% of renters already pay >50% of income on rent) — very limited rent-growth headroom before tenants either downsize or default.
Forward outlook
- In year one you build about $10k of equity ($657 loan paydown + $10k appreciation (10.0% local appreciation)).
- Jackson County population projected at +4% by 2050 — modest demand growth; plan on rents tracking national, not racing it.
- At projected returns (10.0% appreciation + 4.7% rent growth), your $27k cash investment doubles in ~2 years — after that, you're playing with house money.
- By year 4, paydown + projected appreciation supports a ~$36k cash-out refi (75% LTV) — recoverable capital for the next deal without selling this one.
Negotiation context
- Only 13 days on market — expect competitive offers; lowballing is unlikely to land.
- 4 sale attempts since 9y ago with the ask held roughly flat each time — persistent listings suggest the price (not the market) is what's stuck; bring a comps-based counter.
Risks & watch-outs
- Watch-outs: built in 1921 — expect roof / HVAC / electrical / plumbing capex.
Questions for the listing agent
- Built in 1921 — when were the roof, HVAC, electrical panel, plumbing, and water heater last replaced?
- Is there a deadline driving the sale (1031 exchange, divorce, estate, relocation)? That informs how much negotiation room exists.
- Crime grade is F in this area — have there been break-ins, vandalism, or insurance claims at this property in the last 3 years? What carrier currently insures it and at what premium?
- What's the average days-on-market for RENTAL listings here right now (not sales)? A rising rental-DOM trend means longer vacancies and softer asking-rent achievability than the comps imply.
- What's the recent tenant-quality profile in this submarket — average credit score on applications, eviction rate, late-payment / NSF rate, and stable-employment percentage? A property-management company in the area should have these aggregated.
- How much new for-sale + rental construction is in the pipeline within 1–3 miles? Heavy new supply typically softens prices + rents 12–24 months out; constrained supply supports both.
Investment metrics
- 1% rule
- 1.63% ✓
- Cap rate
- 14.24%
- Cash-on-cash
- 28.39%
- DSCR
- 2.26
- GRM
- 5.1
CMA / ARV
- ARV (median comp)
- $151,727
- List price
- $95,000
- Delta
- -37.39%
- Verdict
- UNDERPRICED
- Comps
- 20 within 1.0 mi
Show comp detail 12 sales within ~0.75 mi
| Address | Dist | Beds/Ba | Sqft | Sold | Price | $/sf | Match |
|---|---|---|---|---|---|---|---|
| 3547 Bellefontaine Ave | 0.00mi | 3/1.0 (-1) | 1,748 (-5%) | 0mo | $95,000 | $54 | 86 |
| 3218 Benton Blvd | 0.44mi | 4/2.5 | 1,854 (+1%) | 0mo | $155,000 | $84 | 72 |
| 3715 College Ave | 0.22mi | 3/2.0 (-1) | 1,905 (+3%) | 3mo | $199,900 | $105 | 72 |
| 3428 College Ave | 0.19mi | 4/2.0 | 2,010 (+9%) | 3mo | $204,900 | $102 | 69 |
| 3717 Indiana Ave | 0.26mi | 4/1.5 | 1,644 (-11%) | 2mo | $129,000 | $78 | 66 |
| 3615 College Ave | 0.13mi | 3/1.5 (-1) | 1,598 (-13%) | 5mo | $50,000 | $31 | 60 |
| 3805 Bellefontaine Ave | 0.28mi | 3/1.5 (-1) | 1,624 (-12%) | 5mo | $169,900 | $105 | 56 |
| 3915 Benton Blvd | 0.44mi | 3/2.0 (-1) | 1,672 (-9%) | 4mo | $95,000 | $57 | 52 |
| 4125 Chestnut Ave | 0.72mi | 3/1.0 (-1) | 1,711 (-7%) | 1mo | $60,000 | $35 | 49 |
| 3237 Park Ave | 0.62mi | 3/3.0 (-1) | 1,956 (+6%) | 1mo | $178,000 | $91 | 47 |
| 3029 Askew Ave | 0.74mi | 3/1.0 (-1) | 2,042 (+11%) | 3mo | $55,000 | $27 | 40 |
| 4043 Monroe Ave | 0.72mi | 3/1.5 (-1) | 1,632 (-11%) | 2mo | $142,900 | $88 | 39 |
Match score weights: distance 35% · size 25% · config 20% · recency 20%. Top-matched comps best support the ARV.
Projected returns pro-forma
10.0% appreciation · 4.65% rent growth · sell at horizon
- IRR
- 46.7%
- Equity multiple
- 4.55×
- Total profit
- $94,414
- Equity at exit
- $85,584
- IRR
- 41.2%
- Equity multiple
- 10.48×
- Total profit
- $252,158
- Equity at exit
- $184,564
Cash invested: $26,600 (down + closing). Projections, not guarantees.
Landlord ↔ Tenant lean methodology
- Overall (STATE)
- 81 Strongly Landlord-Friendly
- State Missouri
- 81 Strongly Landlord-Friendly · R+10
- County
- — inherits STATE
- City
- — inherits STATE
ZIP-level market 64128
- Home prices YoY
- 21.6%
- Rents YoY
- 4.7%
- Active inventory
- 87
- Price-to-rent
- 5.1×
Monthly cashflow live
- Estimated rent
- $1,548 high interval (Pro) →
- Mortgage (P&I)
- −$498
- Tax from tax record
- −$56 /mo · $674/yr
- Insurance
- −$40
- HOA
- −$0
- Vacancy / Maint / Mgmt
- −$325
- Net cashflow
- $629
Break-even live
Sensitivity live
| Price | -10% $683 | -5% $656 | +0% $629 | +5% $602 | +10% $575 |
|---|---|---|---|---|---|
| Rent | -10% $507 | -5% $568 | +0% $629 | +5% $690 | +10% $752 |
| Rate | -1.0pp $677 | -0.5pp $653 | base $629 | +0.5pp $605 | +1.0pp $580 |
UW: 25.0% down · 7.5% · 30yr · 1.5% tax · 5.0% vac · 8.0% maint · 8.0% mgmt
Financing live
Cash to close
- Down payment
- $23,750
- Closing costs
- $2,850
- Reserves months
- —
- Total cash needed
- —
Loan-product check · same deal, 3 products live
Conventional
25% down · 7.5% · 30yr
- Down + closing
- —
- Monthly P&I
- —
- Monthly cashflow
- —
- DSCR
- —
- Eligible?
- —
Personal DTI + credit; lowest rate.
DSCR
20% down · 8.5% · 30yr
- Down + closing
- —
- Monthly P&I
- —
- Monthly cashflow
- —
- DSCR
- —
- Eligible?
- —
No personal income docs; deal must DSCR.
Hard money
10% down · 12.0% · 12mo
- Down + closing
- —
- Monthly P&I
- —
- Monthly cashflow
- —
- DSCR
- —
- Eligible?
- —
Short-term bridge; refi at stabilization.
Rent comps 36 comps
| Address | Beds | Baths | Sqft | Rent | $/sqft | DOM | Units | Dist |
|---|---|---|---|---|---|---|---|---|
| 3524 Bellefontaine Ave Kansas City, MO | 3.0 | 1.0 | 1228 | $1,350 | $1.10 | 45d | 1 | 0.05mi |
| 3630 Agnes Ave Kansas City, MO | 3.0 | 2.0 | 1448 | $1,500 | $1.04 | 12d | 1 | 0.16mi |
| 3419 College Ave Kansas City, MO | 4.0 | 1.0 | 1608 | $1,300 | $0.81 | 3d | 1 | 0.21mi |
| 3346 Agnes Ave Kansas City, MO | 3.0 | 1.0 | 1400 | $1,200 | $0.86 | 9d | 1 | 0.25mi |
| 3817 S Benton Ave Kansas City, MO | 4.0 | 1.5 | 1380 | $1,650 | $1.20 | 25d | 1 | 0.35mi |
| 3739 Bales Ave Kansas City, MO | 3.0 | 2.0 | 1400 | $1,575 | $1.12 | 25d | 1 | 0.35mi |
| 3525 Monroe Ave Kansas City, MO | 3.0 | 2.0 | 1569 | $1,500 | $0.96 | 45d | 1 | 0.36mi |
| 3840 Bellefontaine Ave Kansas City, MO | 3.0 | 1.0 | 1500 | $1,500 | $1.00 | 17d | 1 | 0.39mi |
| 3811 E 36th St Kansas City, MO | 3.0 | 1.0 | 2590 | $1,350 | $0.52 | 45d | 1 | 0.44mi |
| 3305 Askew Ave Kansas City, MO | 3.0 | 1.5 | 1428 | $1,450 | $1.02 | 25d | 1 | 0.45mi |
| 3713 Cleveland Ave Kansas City, MO | 4.0 | 1.0 | 1256 | $1,250 | $1.00 | 17d | 1 | 0.46mi |
| 3434 Olive St Kansas City, MO | 3.0 | 2.0 | 2020 | $1,445 | $0.72 | 45d | 1 | 0.49mi |
| 3902 Wabash Ave Kansas City, MO | 4.0 | 2.0 | 1400 | $1,850 | $1.32 | 45d | 1 | 0.58mi |
| 3205 E 31st St Kansas City, MO | 4.0 | 1.0 | 1800 | $1,325 | $0.74 | 25d | 1 | 0.58mi |
| 3332 Norton Ave Kansas City, MO | 3.0 | 1.0 | 1272 | $1,350 | $1.06 | 45d | 1 | 0.63mi |
| 4018 Prospect Ave Kansas City, MO | 4.0 | 1.5 | 1900 | $1,695 | $0.89 | 45d | 1 | 0.67mi |
| 2018 E 35th St Kansas City, MO | 3.0 | 2.0 | 1502 | $1,800 | $1.20 | 4d | 1 | 0.67mi |
| 4116 Bellefontaine Ave Kansas City, MO | 3.0 | 1.0 | 1234 | $1,000 | $0.81 | 25d | 1 | 0.69mi |
| 2002 E 35th St Kansas City, MO | 3.0 | 2.0 | 1426 | $1,295 | $0.91 | 9d | 1 | 0.70mi |
| 4119 S Benton Ave Kansas City, MO | 4.0 | 2.0 | 1700 | $1,800 | $1.06 | 45d | 1 | 0.72mi |
| 4014 Park Ave Kansas City, MO | 3.0 | 2.0 | 1271 | $1,273 | $1.00 | 45d | 1 | 0.78mi |
| 2120 Linwood Blvd Kansas City, MO | 3.0 | 1.0 | 1326 | $1,400 | $1.06 | 45d | 1 | 0.78mi |
| 4107 Olive St Kansas City, MO | 3.0 | 1.5 | 1271 | $1,578 | $1.24 | 9d | 1 | 0.80mi |
| 4112 Park Ave Kansas City, MO | 4.0 | 2.0 | 1700 | $1,800 | $1.06 | 16d | 1 | 0.87mi |
| 3009 Garfield Ave Kansas City, MO | 3.0 | 1.5 | 1334 | $1,425 | $1.07 | 45d | 1 | 0.94mi |
| 2846 Myrtle Ave Kansas City, MO | 3.0 | 2.0 | 1705 | $1,350 | $0.79 | 17d | 1 | 0.99mi |
| 2723 Park Ave Kansas City, MO | 5.0 | 3.0 | 2010 | $1,875 | $0.93 | 22d | 1 | 1.16mi |
| 4211 Woodland Ave Kansas City, MO | 4.0 | 2.5 | 1926 | $2,010 | $1.04 | 17d | 1 | 1.17mi |
| 2708 Olive St Kansas City, MO | 4.0 | 2.0 | 1585 | $1,500 | $0.95 | 18d | 1 | 1.17mi |
| 4219 Woodland Ave Kansas City, MO | 4.0 | 2.0 | 1566 | $1,900 | $1.21 | 3d | 1 | 1.19mi |
| 2724 Brooklyn Ave Kansas City, MO | 3.0 | 2.5 | 1398 | $1,440 | $1.03 | 25d | 1 | 1.20mi |
| 4511 Park Ave Kansas City, MO | 4.0 | 2.5 | 1915 | $1,982 | $1.03 | 25d | 1 | 1.28mi |
| 4900 E 41st Ter Kansas City, MO | 3.0 | 2.0 | 1270 | $1,500 | $1.18 | 17d | 1 | 1.34mi |
| 4653 Benton Blvd Kansas City, MO | 3.0 | 2.0 | 1594 | $1,600 | $1.00 | 9d | 1 | 1.37mi |
| 4232 Virginia Ave Unit 3 Kansas City, MO | 3.0 | 1.0 | 1296 | $1,100 | $0.85 | 14d | 1 | 1.44mi |
| 2729 Grove St Kansas City, MO | 3.0 | 2.0 | 1510 | $1,375 | $0.91 | 45d | 1 | 1.48mi |
Listing history 14 events
-
2026-05-12status Pending 295-char remark
Show marketing remark (295 chars)
This 3-bedroom, 1-bath home presents a strong investment opportunity with solid potential for value-add improvements. With a practical layout and appealing footprint, it offers flexibility for rental income or future resale. Ideal for investors seeking their next project in a promising setting.
-
2026-04-29$95,000 Active 295-char remark
Show marketing remark (295 chars)
This 3-bedroom, 1-bath home presents a strong investment opportunity with solid potential for value-add improvements. With a practical layout and appealing footprint, it offers flexibility for rental income or future resale. Ideal for investors seeking their next project in a promising setting.
-
2026-04-10price $95,000 295-char remark
Show marketing remark (295 chars)
This 3-bedroom, 1-bath home presents a strong investment opportunity with solid potential for value-add improvements. With a practical layout and appealing footprint, it offers flexibility for rental income or future resale. Ideal for investors seeking their next project in a promising setting.
-
2026-03-25historical $115,000 295-char remark
Show marketing remark (295 chars)
This 3-bedroom, 1-bath home presents a strong investment opportunity with solid potential for value-add improvements. With a practical layout and appealing footprint, it offers flexibility for rental income or future resale. Ideal for investors seeking their next project in a promising setting.
-
2025-09-12historical
-
2025-06-03price $120,000
-
2025-05-14price $140,000
-
2025-04-10$150,000 Active
-
2024-03-30historical $1,200
-
2023-11-28$1,200
-
2017-08-24soldstatus Sold
-
2017-07-12status Pending
-
2017-07-11$70,000 Active
-
1990-07-09soldstatus
ⓘ Source: listings_history table (triggers on properties + properties_extension) + one-shot
backfill from property_details.listing_events for pre-trigger history.
Tax reassessment forecast MO · Resets to sale price
- Current annual tax
- $674 · $56/mo
- Projected year-2 tax
- $922 · $77/mo
- Expected delta
- +$247/yr (+$21/mo · 36.6%)
ⓘ Screening estimate from a state-policy table — verify with the county assessor before closing.
Climate risk First Street
- Flood 1/10 Low FEMA zone X (unshaded) · 0% chance over 30 yrs
- Wildfire 1/10 Low
- Heat 4/10 Moderate 7 d/yr ≥107°F today · 17 d/yr by 30 yrs out
- Wind 2/10 Low
- Air quality 3/10 Moderate 2 unhealthy d/yr today · 3 by 30 yrs out
Nearby sold comps map
Loading sold comps map…
Walkable amenities ~0.75 mi
Loading nearby amenities…
Taxation est. · year 1
- Rental income
- $18,581
- − Mortgage interest
- −$5,321
- − Property taxes
- −$674
- − Insurance
- −$475
- − Repairs & maintenance
- −$1,486
- − Management
- −$1,486
- − Depreciation
- −$2,764
- Taxable income
- $6,373
- Est. tax owed @ 24.0%
- −$1,530
- After-tax cash flow
- $6,021/yr
For passive investors: Depreciation is non-cash, so a rental often shows a tax loss while cash-flowing — sheltering income. Rental losses are passive: they offset passive income freely, and up to $25,000/yr can offset ordinary (W-2) income if you actively participate and your MAGI is under $100k (phasing out to $0 by $150k); unused losses carry forward. On sale, claimed depreciation is recaptured at up to 25%, and gains may owe capital-gains tax (a 1031 exchange can defer both). Figures are a year-1 estimate at your 24.0% rate — not tax advice; consult a CPA.
Schools (NCES district)
- District
- Kansas City 33
- NCES district ID
- 2916400
- Math proficiency
- 12% ▼ -8.00%
- Reading proficiency
- 24% ▬ 0.00%
- Median HH income
- $35,227
- Composite
- 14.8/100
- National rank
- #9387
- State rank
- #308 of 324 in MO
Livability — Kansas City
- Score
- 78/100
- State rank
- #28
- US rank
- #2671
Category grades
Schools grade is shown separately in the Schools card above.
Census & demographics
- Census place
- Kansas City, MO
- County
- Jackson County · 687,798 people
- City population
- 439,467
- Metro
- Kansas City, MO-KS
- Population (ZIP)
- 11,912
- Household income
- $36,088
- Rent vs Own
- Severe rent burden
- 946.0
Population outlook (Jackson County) Hauer SSP2
- Today (2025)
- 719,589 people
- By 2030
- 731,456 · +1.6%
- By 2040
- 746,689 · +3.8%
- By 2050
- 749,289 · +4.1%
- By 2075
- 736,227 · +2.3%
- By 2100
- 668,210 · -7.1%
Race, ethnicity, and origin ACS 2023
- Neighborhood character
- Predominantly Black (79%)
- Race & ethnicity
- Black 79% Hispanic / Latino 9% White 8% Two or more races 7%
- Hispanic origin (detail)
- Mexican 6%
- Common ancestry
- Swedish 1% Hispanic 1%
- Foreign-born
- 7% · Canada
- Languages at home
- 88% English-only · Spanish 7% French/Haitian/Cajun 2%
Political lean MEDSL · Jackson
- 2024 margin
- D (+19.3) · D 58.9% · R 39.5% · Other 1.6%
- 2008→2024 swing
- -6.1pp toward R · 2008: 25.4pp · 2024: 19.3pp
- All cycles
- 2024: D+19.3 2020: D+22.0 2016: D+16.6 2012: D+19.0 2008: D+25.4
Not yet ingested
- Civics
- —
Market trends
- HPI YoY
- ▲ 73.41%
- Current HPI
- 412.6862
- Rent YoY
- ▲ 4.65%
- Metro
- Kansas City, MO-KS
- State GDP YoY
- ▲ 1.84%
- F500 in state
- 20
Industry mix (Fortune 500 HQ in MO)
| Industry | F500 HQs | Revenue |
|---|---|---|
| Healthcare | 1 | $163B |
|
||
| Insurance | 1 | $21B |
|
||
| Industrial Technology | 1 | $17B |
|
||
| Retail | 1 | $16B |
|
||
| Industrial Distribution | 1 | $10B |
|
||
| Utilities | 1 | $9B |
|
||
Price history
+35.7% since first listed14 events — show timeline
- 2026-05-12 Pending — Heartland MLS as Distributed by MLS Grid
- 2026-04-29 Listed $95,000 Heartland MLS as Distributed by MLS Grid
- 2026-04-10 Price Changed $95,000 Heartland MLS as Distributed by MLS Grid
- 2026-03-25 Coming Soon $115,000 Heartland MLS as Distributed by MLS Grid
- 2025-09-12 Listing Removed — Heartland MLS as Distributed by MLS Grid
- 2025-06-03 Price Changed $120,000 Heartland MLS as Distributed by MLS Grid
- 2025-05-14 Price Changed $140,000 Heartland MLS as Distributed by MLS Grid
- 2025-04-10 Listed $150,000 Heartland MLS as Distributed by MLS Grid
- 2024-03-30 Rental Removed $1,200 RENTLY
- 2023-11-28 Listed for Rent $1,200 RENTLY
- 2017-08-24 Sold (MLS) — Heartland MLS as Distributed by MLS Grid
- 2017-07-12 Pending — Heartland MLS as Distributed by MLS Grid
- 2017-07-11 Listed $70,000 Heartland MLS as Distributed by MLS Grid
- 1990-07-09 Sold (Public Records) — Public Records
Property tax history
+6.5%/yrLatest (2025): $674 · -32.6% YoY. Source: county tax records.
Cash-flow waterfall
monthlySold comps — $/sqft
last 12 mo · ≤1 miLoading sold comps…