11120 Stratford Dr #429 · Oklahoma City, OK
Flood risk No data
- FEMA flood zone
- —
- Chance of flooding over 30 yrs
- —
- Est. flood insurance / yr
- —
Fire risk No data
- Est. fire insurance / yr
- —
Heat risk No data
- Hot days now (above threshold)
- —
- Hot days in 30 yrs
- —
Wind risk No data
- Chance of severe wind over 30 yrs
- —
Air-quality risk No data
- Unhealthy air days now
- —
- Unhealthy air days in 30 yrs
- —
Risk factors via First Street. Map © Google.
Why this score? — see what drove the C- grade
The composite is a weighted blend of 9 inputs, each scored 0–100. Each bar is that input's sub-score; the figure is the points it added to the 100-point composite (weight × sub-score).
- Cash flow +17.8/30.0
- ARV discount +8.9/15.0
- 1% rule +7.9/10.0
- DSCR +5.6/10.0
- Livability +4.0/5.0
- Rent growth +3.0/5.0
- Condition / age +2.5/5.0
- Schools +0.7/10.0
- Appreciation +0.0/10.0
$89,500
🖨 Deal sheet 📄 Offer letter ✓ Due diligence
Listing remarks MLS
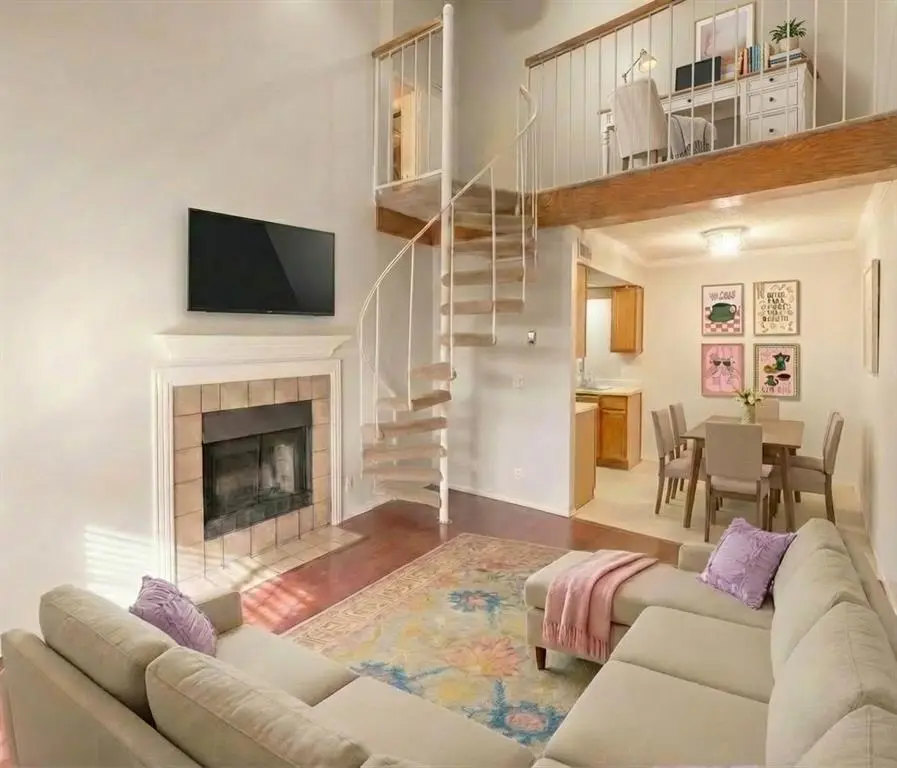
Discover this bright and inviting condo in Northwest Oklahoma City, perfectly situated within the secure, gated community of Stratford Place. The open-concept layout features soaring ceilings and a cozy fireplace in the living area, bathed in an abundance of natural light. A standout feature of this home is the versatile upstairs loft, accessible via a stylish spiral staircase, which can easily serve as a home office, additional bedroom, or a secondary living space to suit your needs. Residents enjoy premium community amenities, including access to two sparkling swimming pools and lush common areas. Located just minutes from Lake Hefner, shopping, and major highways, this condo offers the perfect blend of style and convenience.
Key facts
- Gated community
- Upstairs loft
- Swimming pools
Tags
Neighborhood map
What this means for you Summary
Snapshot
- This is a 2-bed/1.0-bath condo listed at $90k.
Deal economics
- At list price, monthly cash flow is $74 ($894/yr) — positive.
- The deal already cash-flows at list — no discount required.
- Meets the 1% rule at list price ($1k rent vs $90k).
- Recommended offer: $84k (6.0% below list) — sets the bar for market timing.
- Cap rate 7.3% vs local median 3.7% in Oklahoma City — top-decile yield for the area; either an underpriced asset or a hidden risk that comps aren't pricing in. Stress-test before assuming the spread holds.
Location & tenants
- Location reads 80/100 on livability (#3 in OK, #1,635 nationally) — a professional / high-income tenant draw. Strengths: amenities A+, commute A+, cost of living A+; Watch: schools F, crime F.
- Oklahoma City (urban): math 7% / reading 10% proficiency, ranked #254 of 270 in OK (top 94%) — low school quality limits family demand, transient renter base, plan for 1-2y turnover; 82% free/reduced lunch — lower-income household profile, screen leases tightly.
- Market conditions: Rents rising (+2.0%/yr); 333 active listings in the ZIP; 40 comparable units currently listed for rent nearby; rentals at typical pace (median 20d on market — plan ~3-4 weeks tenant-placement turnaround); 5,365 units permitted in Oklahoma County in 2024 (569 in 5+ unit buildings).
Forward outlook
- Local home prices are declining (-3.0%/yr); year-one equity from $619 of loan paydown is wiped out by about $3k of value loss. Plan a longer hold.
- Oklahoma County population projected at +41% by 2050 — long-run rental-demand tailwind backs the buy-and-hold thesis.
Negotiation context
- It's been on market 77 days — a 6% lower offer ($84k) is reasonable based on typical stale-listing flexibility.
- 2 sale attempts with the ask held roughly flat each time — persistent listings suggest the price (not the market) is what's stuck; bring a comps-based counter.
Risks & watch-outs
- Watch-outs: HOA is 20% of rent.
Questions for the listing agent
- It's been on market 77 days. Have you received any prior offers? Is the seller open to a 6% concession, seller financing, or rate buy-down credit?
- What does the HOA fee cover, when was the last increase, and are there any pending special assessments or reserve-fund shortfalls?
- Any open or pending special assessments — roof, HVAC, plumbing, elevator, façade? What's the per-unit balance and payoff schedule, and is the seller paying it off at close or rolling it to the buyer?
- Why hasn't it sold? Are there any deal-killer items the seller is aware of (foundation, flood, title, zoning, code violations)?
- Is there a deadline driving the sale (1031 exchange, divorce, estate, relocation)? That informs how much negotiation room exists.
- Schools are F-rated, which usually means shorter tenancies and higher turnover. Who's the typical renter profile here, and what's been the actual vacancy rate?
- Crime grade is F in this area — have there been break-ins, vandalism, or insurance claims at this property in the last 3 years? What carrier currently insures it and at what premium?
- What's the average days-on-market for RENTAL listings here right now (not sales)? A rising rental-DOM trend means longer vacancies and softer asking-rent achievability than the comps imply.
- What's the recent tenant-quality profile in this submarket — average credit score on applications, eviction rate, late-payment / NSF rate, and stable-employment percentage? A property-management company in the area should have these aggregated.
- How much new apartment / multifamily construction is in the pipeline within 1–3 miles? Heavy new supply (>2% of stock underway) typically softens rents 12–24 months out; light construction supports rent growth.
Investment metrics
- 1% rule
- 1.29% ✓
- Cap rate
- 7.29%
- Cash-on-cash
- 3.57%
- DSCR
- 1.16
- GRM
- 6.4
CMA / ARV
- ARV (median comp)
- $92,346
- List price
- $89,500
- Delta
- -3.08%
- Verdict
- FAIR
- Comps
- 20 within 1.0 mi
Projected returns pro-forma
-3.0% appreciation · 2.05% rent growth · sell at horizon
- IRR
- -11.9%
- Equity multiple
- 0.57×
- Total profit
- $-10,700
- Equity at exit
- $13,345
- IRR
- -4.5%
- Equity multiple
- 0.72×
- Total profit
- $-6,995
- Equity at exit
- $7,738
Cash invested: $25,060 (down + closing). Projections, not guarantees.
Landlord ↔ Tenant lean methodology
- Overall (STATE)
- 83 Strongly Landlord-Friendly
- State Oklahoma
- 83 Strongly Landlord-Friendly · R+20
- County
- — inherits STATE
- City
- — inherits STATE
ZIP-level market 73120
- Rents YoY
- 2.0%
- Active inventory
- 333
- Price-to-rent
- 6.4×
Monthly cashflow live
- Estimated rent
- $1,157 high interval (Pro) →
- Mortgage (P&I)
- −$469
- Tax from tax record
- −$99 /mo · $1,183/yr
- Insurance
- −$37
- HOA
- −$234
- Vacancy / Maint / Mgmt
- −$243
- Net cashflow
- $74
Break-even live
UW: 25.0% down · 7.5% · 30yr · 1.5% tax · 5.0% vac · 8.0% maint · 8.0% mgmt
Financing live
Cash to close
- Down payment
- $22,375
- Closing costs
- $2,685
- Reserves months
- —
- Total cash needed
- —
Loan-product check · same deal, 3 products live
Conventional
25% down · 7.5% · 30yr
- Down + closing
- —
- Monthly P&I
- —
- Monthly cashflow
- —
- DSCR
- —
- Eligible?
- —
Personal DTI + credit; lowest rate.
DSCR
20% down · 8.5% · 30yr
- Down + closing
- —
- Monthly P&I
- —
- Monthly cashflow
- —
- DSCR
- —
- Eligible?
- —
No personal income docs; deal must DSCR.
Hard money
10% down · 12.0% · 12mo
- Down + closing
- —
- Monthly P&I
- —
- Monthly cashflow
- —
- DSCR
- —
- Eligible?
- —
Short-term bridge; refi at stabilization.
Rent comps 40 comps
| Address | Beds | Baths | Sqft | Rent | $/sqft | DOM | Units | Dist |
|---|---|---|---|---|---|---|---|---|
| 11130 Stratford Dr Oklahoma City, OK | 1.0 | 1.0 | 625 | $975 | $1.56 | 43d | 1 | 0.08mi |
| 11239 N Pennsylvania Ave Oklahoma City, OK | 1.0–2.0 | 1.0–2.0 | 850 | $1,155 | $1.36 | 3d | 30 | 0.10mi |
| 1800 NW 115th St Oklahoma City, OK | 1.0–3.0 | 1.0–2.0 | 1019 | $1,705 | $1.67 | 2d | 8 | 0.54mi |
| 1301 W Hefner Rd Oklahoma City, OK | 1.0–2.0 | 1.0–2.0 | 898 | $1,310 | $1.46 | 1d | 14 | 0.79mi |
| 2300 Carlton Way Oklahoma City, OK | 1.0 | 1.0 | 700 | $899 | $1.28 | 16d | 1 | 0.90mi |
| 11004 N May Ave Oklahoma City, OK | 1.0–2.0 | 1.0–2.5 | 1129 | $1,170 | $1.04 | 11d | 1 | 0.90mi |
| 1209 W Hefner Rd Oklahoma City, OK | 1.0–2.0 | 1.0–1.5 | 852 | $1,029 | $1.21 | 23d | 3 | 0.92mi |
| 11550 N May Ave Oklahoma City, OK | 1.0 | 1.0 | 662 | $950 | $1.44 | 19d | 1 | 1.01mi |
| 2301 NW 122nd St Oklahoma City, OK | 1.0 | 1.0 | 723 | $940 | $1.30 | 1d | 28 | 1.06mi |
| 2401 NW 122nd St Oklahoma City, OK | 1.0–2.0 | 1.0–2.0 | 844 | $899 | $1.06 | 23d | 1 | 1.07mi |
| 10735 N Western Ave Oklahoma City, OK | 1.0 | 1.0 | 740 | $799 | $1.08 | 23d | 1 | 1.08mi |
| 10735 N Western Ave Unit 10727H Oklahoma City, OK | 2.0 | 2.0 | 935 | $949 | $1.01 | 23d | 1 | 1.08mi |
| 10735 N Western Ave Unit 10743C Oklahoma City, OK | 2.0 | 2.0 | 935 | $949 | $1.01 | 2d | 1 | 1.08mi |
| 10735 N Western Ave Oklahoma City, OK | 1.0 | 1.0 | 740 | $799 | $1.08 | 19d | 1 | 1.08mi |
| 10735 N Western Ave Oklahoma City, OK | 1.0–3.0 | 1.0–2.5 | 995 | $974 | $0.98 | 43d | 64 | 1.08mi |
| 839 NW 111th St Unit 839 Oklahoma City, OK | 1.0 | 1.5 | 1121 | $1,075 | $0.96 | 23d | 1 | 1.14mi |
| 2700 Indian Creek Blvd Oklahoma City, OK | 1.0–3.0 | 1.0–2.0 | 1261 | $1,164 | $0.92 | 2d | 5 | 1.18mi |
| 1702 W Britton Rd Oklahoma City, OK | 2.0 | 1.0 | 950 | $1,195 | $1.26 | 2d | 1 | 1.18mi |
| 1417 NW 95th St Oklahoma City, OK | 2.0 | 1.0 | 916 | $1,085 | $1.18 | 23d | 1 | 1.20mi |
| 11800 N Western Ave Unit 210 Oklahoma City, OK | 3.0 | 2.0 | 1120 | $1,160 | $1.04 | 3d | 1 | 1.24mi |
| 11800 N Western Ave Unit 302 Oklahoma City, OK | 2.0 | 2.0 | 960 | $1,006 | $1.05 | 3d | 1 | 1.24mi |
| 11800 N Western Ave Apt 601 Oklahoma City, OK | 2.0 | 2.0 | 960 | $1,006 | $1.05 | 43d | 1 | 1.24mi |
| 11800 N Western Ave Oklahoma City, OK | 3.0 | 2.0 | 1120 | $1,160 | $1.04 | 43d | 1 | 1.24mi |
| 11800 N Western Ave Apt 919 Oklahoma City, OK | 3.0 | 2.0 | 1120 | $1,160 | $1.04 | 43d | 1 | 1.24mi |
| 11800 N Western Ave Apt 205 Oklahoma City, OK | 3.0 | 2.0 | 1120 | $1,100 | $0.98 | 43d | 1 | 1.24mi |
| 1425 NW 94th St Oklahoma City, OK | 2.0 | 1.0 | 816 | $795 | $0.97 | 21d | 1 | 1.24mi |
| 12821 Stratford Dr Oklahoma City, OK | 2.0 | 2.0 | 1043 | $1,078 | $1.03 | 1d | 1 | 1.25mi |
| 1913 Downing St Oklahoma City, OK | 2.0 | 1.0 | 940 | $1,245 | $1.32 | 1d | 1 | 1.25mi |
| 1913 Downing St Oklahoma City, OK | 2.0 | 1.0 | 940 | $1,245 | $1.32 | 2d | 1 | 1.25mi |
| 12701 N Pennsylvania Ave Oklahoma City, OK | 3.0 | 1.0–2.0 | 912 | $1,358 | $1.49 | 1d | 15 | 1.31mi |
| 2204 Downing St Oklahoma City, OK | 2.0 | 1.0 | 750 | $1,295 | $1.73 | 19d | 1 | 1.32mi |
| 1618 Oxford Way Oklahoma City, OK | 3.0 | 1.0 | 1039 | $1,350 | $1.30 | 23d | 1 | 1.32mi |
| 910 NW 101st St Oklahoma City, OK | 3.0 | 1.0 | 1100 | $1,400 | $1.27 | 1d | 1 | 1.36mi |
| 1708 Sheffield Rd Oklahoma City, OK | 3.0 | 1.0 | 1057 | $1,400 | $1.32 | 2d | 1 | 1.36mi |
| 1441 NW 92nd St Oklahoma City, OK | 1.0–2.0 | 1.0 | 725 | $850 | $1.17 | 43d | 1 | 1.36mi |
| 12831 Stratford Dr Oklahoma City, OK | 1.0–3.0 | 1.0–2.0 | 1122 | $2,295 | $2.05 | 1d | 22 | 1.39mi |
| 2216 Hasley Dr Oklahoma City, OK | 2.0 | 1.0 | 750 | $1,400 | $1.87 | 43d | 1 | 1.39mi |
| 2216 Hasley Dr Oklahoma City, OK | 2.0 | 1.0 | 750 | $1,400 | $1.87 | 20d | 1 | 1.39mi |
| 1434 NW 92nd St Unit 3 Oklahoma City, OK | 2.0 | 1.5 | 950 | $915 | $0.96 | 43d | 1 | 1.39mi |
| 2801 Croydon Ct Oklahoma City, OK | 2.0 | 1.0 | 1102 | $1,550 | $1.41 | 2d | 1 | 1.42mi |
HOA detail condo
- Monthly dues
- $234 · $2,808/yr
- Likely covers
- poolsecurity
- Assessments
- None detected in remarks — confirm with the listing agent.
Listing history 18 events
-
2026-06-18days on market $89,500 Active 77 DOM
-
2026-06-17days on market $89,500 Active 76 DOM
-
2026-06-16days on market $89,500 Active 75 DOM
-
2026-06-15days on market $89,500 Active 74 DOM
-
2026-06-13days on market $89,500 Active 72 DOM
-
2026-06-09days on market $89,500 Active 68 DOM
-
2026-06-08days on market $89,500 Active 67 DOM
-
2026-06-07days on market $89,500 Active 66 DOM
-
2026-06-05days on market $89,500 Active 63 DOM
-
2026-06-03days on market $89,500 Active 62 DOM
-
2026-06-02days on market $89,500 Active 61 DOM
-
2026-06-01days on market $89,500 Active 60 DOM
-
2026-05-31days on market $89,500 Active 59 DOM
-
2026-04-02historical
Show marketing remark (737 chars)
Discover this bright and inviting condo in Northwest Oklahoma City, perfectly situated within the secure, gated community of Stratford Place. The open-concept layout features soaring ceilings and a cozy fireplace in the living area, bathed in an abundance of natural light. A standout feature of this home is the versatile upstairs loft, accessible via a stylish spiral staircase, which can easily serve as a home office, additional bedroom, or a secondary living space to suit your needs. Residents enjoy premium community amenities, including access to two sparkling swimming pools and lush common areas. Located just minutes from Lake Hefner, shopping, and major highways, this condo offers the perfect blend of style and convenience.
-
2026-04-02$89,500 Active 737-char remark
Show marketing remark (737 chars)
Discover this bright and inviting condo in Northwest Oklahoma City, perfectly situated within the secure, gated community of Stratford Place. The open-concept layout features soaring ceilings and a cozy fireplace in the living area, bathed in an abundance of natural light. A standout feature of this home is the versatile upstairs loft, accessible via a stylish spiral staircase, which can easily serve as a home office, additional bedroom, or a secondary living space to suit your needs. Residents enjoy premium community amenities, including access to two sparkling swimming pools and lush common areas. Located just minutes from Lake Hefner, shopping, and major highways, this condo offers the perfect blend of style and convenience.
-
2026-03-03price $100,000
-
2025-12-22$105,000 Active
-
2023-05-10soldstatus $96,000
ⓘ Source: listings_history table (triggers on properties + properties_extension) + one-shot
backfill from property_details.listing_events for pre-trigger history.
Tax reassessment forecast OK · Resets to sale price
- Current annual tax
- $1,183 · $99/mo
- Projected year-2 tax
- $1,183 · $99/mo
- Expected delta
- $0/yr ($0/mo · 0.0%)
ⓘ Screening estimate from a state-policy table — verify with the county assessor before closing.
Nearby sold comps map
Loading sold comps map…
Walkable amenities ~0.75 mi
Loading nearby amenities…
Taxation est. · year 1
- Rental income
- $13,879
- − Mortgage interest
- −$5,013
- − Property taxes
- −$1,183
- − Insurance
- −$448
- − Repairs & maintenance
- −$1,110
- − Management
- −$1,110
- − HOA
- −$2,808
- − Depreciation
- −$2,604
- Taxable loss
- −$397
- Est. tax savings @ 24.0%
- +$95
- After-tax cash flow
- $989/yr
For passive investors: Depreciation is non-cash, so a rental often shows a tax loss while cash-flowing — sheltering income. Rental losses are passive: they offset passive income freely, and up to $25,000/yr can offset ordinary (W-2) income if you actively participate and your MAGI is under $100k (phasing out to $0 by $150k); unused losses carry forward. On sale, claimed depreciation is recaptured at up to 25%, and gains may owe capital-gains tax (a 1031 exchange can defer both). Figures are a year-1 estimate at your 24.0% rate — not tax advice; consult a CPA.
Schools (NCES district)
- District
- Oklahoma City
- NCES district ID
- 4022770
- Math proficiency
- 7% ▼ -5.00%
- Reading proficiency
- 10% ▼ -6.00%
- Median HH income
- $35,606
- Composite
- 7.0/100
- National rank
- #9970
- State rank
- #254 of 270 in OK
Livability — Oklahoma City
- Score
- 80/100
- State rank
- #3
- US rank
- #1635
Category grades
Schools grade is shown separately in the Schools card above.
Census & demographics
- Census place
- Oklahoma City, OK
- County
- Oklahoma County · 771,644 people
- City population
- 498,656
- Metro
- Oklahoma City, OK
- Population (ZIP)
- 35,559
- Household income
- $64,745
- Rent vs Own
- Severe rent burden
- 2029.0
Population outlook (Oklahoma County) Hauer SSP2
- Today (2025)
- 911,875 people
- By 2030
- 982,413 · +7.7%
- By 2040
- 1,130,468 · +24.0%
- By 2050
- 1,288,422 · +41.3%
- By 2075
- 1,711,482 · +87.7%
- By 2100
- 2,088,448 · +129.0%
Race, ethnicity, and origin ACS 2023
- Neighborhood character
- Diverse neighborhood (Simpson 0.62)
- Race & ethnicity
- White 57% Black 21% Two or more races 11% Hispanic / Latino 7% Native American 3% Asian 2%
- Hispanic origin (detail)
- Mexican 4%
- Common ancestry
- Italian 3% Slovak 2% Lithuanian 2%
- Foreign-born
- 7% · Canada, China, Jamaica
- Languages at home
- 92% English-only · Spanish 4% French/Haitian/Cajun 1% Other Asian/Pacific 1%
Political lean MEDSL · Oklahoma
- 2024 margin
- Toss-up / Even · D 48.0% · R 49.7% · Other 2.3%
- 2008→2024 swing
- +15.1pp toward D · 2008: -16.8pp · 2024: -1.7pp
- All cycles
- 2024: R+1.7 2020: R+1.1 2016: R+10.5 2012: R+16.7 2008: R+16.8
Not yet ingested
- Civics
- —
Market trends
- HPI YoY
- ▼ -279.69%
- Current HPI
- 227.2832
- Rent YoY
- ▲ 2.05%
- Metro
- Oklahoma City, OK
- State GDP YoY
- ▲ 1.55%
- F500 in state
- 6
Industry mix (Fortune 500 HQ in OK)
| Industry | F500 HQs | Revenue |
|---|---|---|
| Energy | 3 | $48B |
|
||
Price history
-6.8% since first listed5 events — show timeline
- 2026-04-02 Listed $89,500 MLSOK
- 2026-04-02 Listing Removed — MLSOK
- 2026-03-03 Price Changed $100,000 MLSOK
- 2025-12-22 Listed $105,000 MLSOK
- 2023-05-10 Sold (Public Records) $96,000 Public Records
Property tax history
+5.6%/yrLatest (2025): $1,183 · -2.5% YoY. Source: county tax records.
Cash-flow waterfall
monthlySold comps — $/sqft
last 12 mo · ≤1 miLoading sold comps…