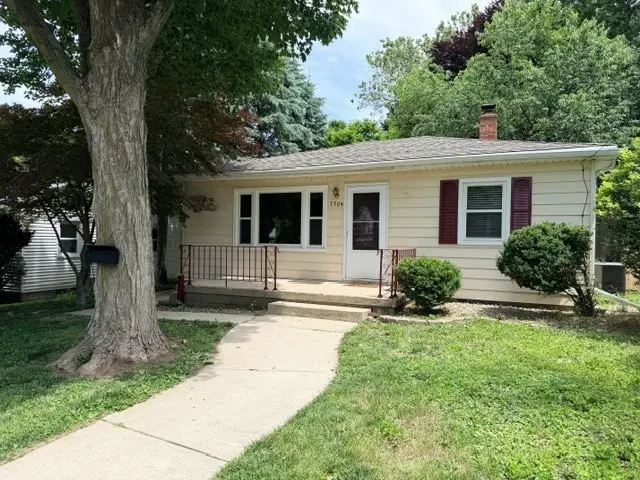
1309 Eastholme Ave · Bloomington, IL
Flood risk 1/10 · Minimal
- FEMA flood zone
- X (unshaded)
- Chance of flooding over 30 yrs
- 0.0%
- Est. flood insurance / yr
- $473 – $860
Fire risk 1/10 · Minimal
- Est. fire insurance / yr
- $804 – $1,492
Heat risk 3/10 · Minor
- Hot days now (above 105°F)
- 7 days/yr
- Hot days in 30 yrs
- 18 days/yr
Wind risk 2/10 · Minimal
- Chance of severe wind over 30 yrs
- 1.0%
Air-quality risk 2/10 · Minimal
- Unhealthy air days now
- 1 days/yr
- Unhealthy air days in 30 yrs
- 2 days/yr
Risk factors via First Street. Map © Google.
Why this score? — see what drove the C- grade
The composite is a weighted blend of 9 inputs, each scored 0–100. Each bar is that input's sub-score; the figure is the points it added to the 100-point composite (weight × sub-score).
- Cash flow +19.4/30.0
- ARV discount +7.5/15.0
- DSCR +6.1/10.0
- 1% rule +5.4/10.0
- Rent growth +3.9/5.0
- Livability +3.9/5.0
- Condition / age +2.5/5.0
- Schools +1.5/10.0
- Appreciation +0.0/10.0
$154,900
🖨 Deal sheet 📄 Offer letter ✓ Due diligence
Listing remarks
So charming and move in ready! This 2 bedroom 1 bath home has so much character! So many updates including refinished wood floors in living room, carpet 2026, all repainted interior, crown molding throughout and a large deck that was just replaced in 2026. The kitchen is updated with beautiful wood cabinets that add to the charm. Windows replaced in 2014, roof 2014 fence 2013. Washer new in 2026 and dryer is newer. Large backyard with mature trees. Shed sold as-is.
Key facts
- 7,650 sq ft lot
- Built 1953
- Listed 15 days
Property features AI
Finance
- Other: Parcel number 1434352002; Lot dimensions approximately 51 x 150 (less than 0.25 acre)
- HOA & community: No master association fees required
Exterior
- Utilities: Public water; Public sewer
- Home design: Detached single-family home; One-story; Built 71–80 years ago; Fee simple ownership; House faces not specified
- Construction: Vinyl siding; Block foundation; Built before 1978
- Exterior features: Deck; Fenced yard; Mature trees
Interior
- Kitchen: Range; Microwave; Dishwasher; Refrigerator; Eating area / table space
- Bedrooms: 2 bedrooms
- Flooring: Hardwood in living room; Ceramic tile in kitchen; Carpet in bedrooms
- Bathrooms: 1 full bathroom
- Heating & cooling: Natural gas heating; Central air conditioning
- Interior features: Unfinished full basement; 4 total rooms; School bus service
- Laundry & utility: Washer; Dryer; Laundry room
Neighborhood map
What this means for you Summary
Snapshot
- This is a 2-bed/2.0-bath other listed at $155k.
Deal economics
- At list price, monthly cash flow is $172 ($2k/yr) — positive.
- The deal already cash-flows at list — no discount required.
- Meets the 1% rule at list price ($2k rent vs $155k).
- Recommended offer: $153k (1.5% below list) — sets the bar for market timing.
- Cap rate 7.6% vs local median 5.4% in Bloomington — top-decile yield for the area; either an underpriced asset or a hidden risk that comps aren't pricing in. Stress-test before assuming the spread holds.
Location & tenants
- Location reads 77/100 on livability (#161 in IL, #2,987 nationally) — a middle-class / working-renter tenant base. Strengths: cost of living A+, housing A+, health & safety A+; Watch: amenities C-, commute F.
- Bloomington SD 87 (urban): math 14% / reading 19% proficiency, ranked #476 of 620 in IL (top 77%) — low school quality limits family demand, transient renter base, plan for 1-2y turnover.
- Zoned schools: Bent Elem School (math 8% / reading 8%, grade F, #1,627 of 2,056 statewide, top 81%, 374 students, 0% FRL); Bloomington Jr High School (math 12% / reading 19%, grade F, #493 of 665 statewide, top 75%, 1,006 students, 0% FRL); Bloomington High School (math 27% / reading 33%, grade F, #179 of 693 statewide, top 27%, 1,503 students, 0% FRL) — zoned schools average 0% FRL vs 51% district-wide (51 pts lower); this property's tenant base skews higher-income than the district average.
- Market conditions: Rents rising fast (+5.6%/yr); 88 active listings in the ZIP; 15 comparable units currently listed for rent nearby; rentals lingering (median 44d on market — plan ~5-8 weeks vacancy on turnover, expect pricing pressure); 67% of comp listings sitting > 30 days — soft ceiling on asking rent; 247 units permitted in McLean County in 2024 (54 in 5+ unit buildings).
- This rent runs 34% of the median local income ($57k/yr) — at the standard rent-burdened threshold; future hikes will face affordability resistance.
Forward outlook
- Local home prices are declining (-3.0%/yr); year-one equity from $1k of loan paydown is wiped out by about $5k of value loss. Plan a longer hold.
Negotiation context
- It's been on market 15 days — a 2% lower offer ($153k) is reasonable based on typical stale-listing flexibility.
- Current owner paid $88k; list at $155k implies a 76% gain — meaningful room to come down on a strong offer.
Risks & watch-outs
- Watch-outs: built in 1953 — expect roof / HVAC / electrical / plumbing capex.
Questions for the listing agent
- Built in 1953 — when were the roof, HVAC, electrical panel, plumbing, and water heater last replaced?
- Is there a deadline driving the sale (1031 exchange, divorce, estate, relocation)? That informs how much negotiation room exists.
- What's the average days-on-market for RENTAL listings here right now (not sales)? A rising rental-DOM trend means longer vacancies and softer asking-rent achievability than the comps imply.
- What's the recent tenant-quality profile in this submarket — average credit score on applications, eviction rate, late-payment / NSF rate, and stable-employment percentage? A property-management company in the area should have these aggregated.
- How much new for-sale + rental construction is in the pipeline within 1–3 miles? Heavy new supply typically softens prices + rents 12–24 months out; constrained supply supports both.
Investment metrics
- 1% rule
- 1.04% ✓
- Cap rate
- 7.63%
- Cash-on-cash
- 4.76%
- DSCR
- 1.21
- GRM
- 8.0
CMA / ARV
No comps found within radius.
Projected returns pro-forma
-3.0% appreciation · 5.6% rent growth · sell at horizon
- IRR
- -5.9%
- Equity multiple
- 0.78×
- Total profit
- $-9,750
- Equity at exit
- $23,096
- IRR
- 6.7%
- Equity multiple
- 1.57×
- Total profit
- $24,590
- Equity at exit
- $13,393
Cash invested: $43,372 (down + closing). Projections, not guarantees.
Landlord ↔ Tenant lean methodology
- Overall (STATE)
- 43 Moderately Tenant-Leaning
- State Illinois
- 43 Moderately Tenant-Leaning · D+7
- County
- — inherits STATE
- City
- — inherits STATE
ZIP-level market 61701
- Rents YoY
- 5.6%
- Active inventory
- 88
- Price-to-rent
- 8.0×
Monthly cashflow live
- Estimated rent
- $1,616 high interval (Pro) →
- Mortgage (P&I)
- −$812
- Tax from tax record
- −$228 /mo · $2,732/yr
- Insurance
- −$65
- HOA
- −$0
- Vacancy / Maint / Mgmt
- −$339
- Net cashflow
- $172
Break-even live
UW: 25.0% down · 7.5% · 30yr · 1.5% tax · 5.0% vac · 8.0% maint · 8.0% mgmt
Financing live
Cash to close
- Down payment
- $38,725
- Closing costs
- $4,647
- Reserves months
- —
- Total cash needed
- —
Loan-product check · same deal, 3 products live
Conventional
25% down · 7.5% · 30yr
- Down + closing
- —
- Monthly P&I
- —
- Monthly cashflow
- —
- DSCR
- —
- Eligible?
- —
Personal DTI + credit; lowest rate.
DSCR
20% down · 8.5% · 30yr
- Down + closing
- —
- Monthly P&I
- —
- Monthly cashflow
- —
- DSCR
- —
- Eligible?
- —
No personal income docs; deal must DSCR.
Hard money
10% down · 12.0% · 12mo
- Down + closing
- —
- Monthly P&I
- —
- Monthly cashflow
- —
- DSCR
- —
- Eligible?
- —
Short-term bridge; refi at stabilization.
Rent comps 15 comps
| Address | Beds | Baths | Sqft | Rent | $/sqft | DOM | Units | Dist |
|---|---|---|---|---|---|---|---|---|
| 507 E Graham St Bloomington, IL | 3.0 | 1.5 | 1300 | $1,900 | $1.46 | 43d | 1 | 0.44mi |
| 3 Stortz Dr Bloomington, IL | 2.0 | 2.0 | 1200 | $1,350 | $1.12 | 43d | 2 | 0.46mi |
| 1234 E Empire St Bloomington, IL | 2.0 | 2.0 | 1240 | $1,999 | $1.61 | 43d | 1 | 0.48mi |
| 503 E Empire St Bloomington, IL | 3.0 | 2.0 | 1000 | $1,795 | $1.79 | 43d | 1 | 0.48mi |
| 318 E Locust St Apt A Bloomington, IL | 3.0 | 2.0 | 1200 | $3,000 | $2.50 | 43d | 1 | 0.65mi |
| 1110 E Jefferson St Unit 16 Bloomington, IL | 3.0 | 1.5 | 1476 | $1,675 | $1.13 | 43d | 1 | 0.72mi |
| 915 N Madison St Unit 4 Bloomington, IL | 2.0 | 1.0 | 900 | $899 | $1.00 | 21d | 1 | 0.85mi |
| 912 N Madison St Apt 2 Bloomington, IL | 1.0 | 1.0 | 850 | $950 | $1.12 | 43d | 1 | 0.89mi |
| 306 Robinhood Ln Apt E Bloomington, IL | 2.0 | 1.5 | 1120 | $1,350 | $1.21 | 21d | 1 | 1.04mi |
| 404 S Mc Clun St Bloomington, IL | 2.0 | 1.0 | 745 | $1,200 | $1.61 | 43d | 1 | 1.04mi |
| 309-311 Robinhood Ln Unit A4 Bloomington, IL | 2.0 | 1.0 | 1000 | $1,000 | $1.00 | 21d | 1 | 1.08mi |
| 507 1/2 S Clayton St Bloomington, IL | 3.0 | 1.0 | 1003 | $1,895 | $1.89 | 21d | 1 | 1.16mi |
| 1 Uptown Cir Normal, IL | 1.0–3.0 | 1.0–2.0 | 1564 | $3,625 | $2.32 | 43d | 4 | 1.28mi |
| 339 Riley Dr Unit B4 Bloomington, IL | 2.0 | 1.0 | 770 | $915 | $1.19 | 43d | 1 | 1.33mi |
| 703 W Olive St Bloomington, IL | 3.0 | 1.0 | 1000 | $1,495 | $1.50 | 21d | 1 | 1.48mi |
Listing history 13 events
-
2026-06-19days on market $154,900 Active 15 DOM
-
2026-06-18price $154,900 Active 14 DOM
-
2026-06-18days on market $159,900 Active 14 DOM
-
2026-06-17days on market $159,900 Active 13 DOM
-
2026-06-16days on market $159,900 Active 12 DOM
-
2026-06-15days on market $159,900 Active 11 DOM
-
2026-06-14pricedays on market $159,900 Active 9 DOM
-
2026-06-13days on market $165,000 Active 8 DOM
-
2026-06-10days on market $165,000 Active 6 DOM
-
2026-06-09days on market $165,000 Active 5 DOM
-
2026-06-08days on market $165,000 Active 4 DOM
-
2026-06-07remarks 473-char remark
-
2026-06-07$165,000 Active 3 DOM
ⓘ Source: listings_history table (triggers on properties + properties_extension) + one-shot
backfill from property_details.listing_events for pre-trigger history.
Tax reassessment forecast IL · Partial reset (capped growth)
- Current annual tax
- $2,732 · $228/mo
- Projected year-2 tax
- $3,124 · $260/mo
- Expected delta
- +$392/yr (+$33/mo · 14.3%)
ⓘ Screening estimate from a state-policy table — verify with the county assessor before closing.
Climate risk First Street
- Flood 1/10 Low FEMA zone X (unshaded) · 0% chance over 30 yrs
- Wildfire 1/10 Low
- Heat 3/10 Moderate 7 d/yr ≥105°F today · 18 d/yr by 30 yrs out
- Wind 2/10 Low 100% chance of damaging wind over 30 yrs
- Air quality 2/10 Low 1 unhealthy d/yr today · 2 by 30 yrs out
Nearby sold comps map
Loading sold comps map…
Walkable amenities ~0.75 mi
Loading nearby amenities…
Taxation est. · year 1
- Rental income
- $19,393
- − Mortgage interest
- −$8,677
- − Property taxes
- −$2,732
- − Insurance
- −$774
- − Repairs & maintenance
- −$1,551
- − Management
- −$1,551
- − Depreciation
- −$4,506
- Taxable loss
- −$399
- Est. tax savings @ 24.0%
- +$96
- After-tax cash flow
- $2,162/yr
For passive investors: Depreciation is non-cash, so a rental often shows a tax loss while cash-flowing — sheltering income. Rental losses are passive: they offset passive income freely, and up to $25,000/yr can offset ordinary (W-2) income if you actively participate and your MAGI is under $100k (phasing out to $0 by $150k); unused losses carry forward. On sale, claimed depreciation is recaptured at up to 25%, and gains may owe capital-gains tax (a 1031 exchange can defer both). Figures are a year-1 estimate at your 24.0% rate — not tax advice; consult a CPA.
Schools (NCES district)
- District
- Bloomington SD 87
- NCES district ID
- 1706480
- Math proficiency
- 14% ▼ -7.00%
- Reading proficiency
- 19% ▼ -7.00%
- Median HH income
- $50,544
- Composite
- 15.05/100
- National rank
- #9351
- State rank
- #476 of 620 in IL
Livability — Bloomington
- Score
- 77/100
- State rank
- #161
- US rank
- #2987
Category grades
Schools grade is shown separately in the Schools card above.
Census & demographics
- Census place
- Bloomington, IL
- County
- McLean County · 126,490 people
- City population
- 72,415
- Metro
- Bloomington, IL
- Population (ZIP)
- 35,136
- Household income
- $57,130
- Rent vs Own
- Severe rent burden
- 1493.0
Population outlook (McLean County) Hauer SSP2
- Today (2025)
- 176,468 people
- By 2030
- 178,002 · +0.9%
- By 2040
- 178,592 · +1.2%
- By 2050
- 177,090 · +0.4%
- By 2075
- 173,224 · -1.8%
- By 2100
- 158,425 · -10.2%
Race, ethnicity, and origin ACS 2023
- Neighborhood character
- Predominantly White (70%)
- Race & ethnicity
- White 70% Black 13% Two or more races 9% Hispanic / Latino 9% Asian 3%
- Hispanic origin (detail)
- Mexican 7%
- Common ancestry
- Romanian 3% Slovak 2% Italian 1%
- Foreign-born
- 6% · Canada, Philippines, Vietnam
- Languages at home
- 91% English-only · Spanish 5% Other Asian/Pacific 1% Other Indo-European 1%
Political lean MEDSL · McLean
- 2024 margin
- Toss-up / Even · D 51.6% · R 46.8% · Other 1.6%
- 2008→2024 swing
- +3.7pp toward D · 2008: 1.2pp · 2024: 4.9pp
- All cycles
- 2024: D+4.9 2020: D+3.9 2016: R+1.5 2012: R+11.1 2008: D+1.2
Not yet ingested
- Civics
- —
Market trends
- HPI YoY
- ▼ -115.13%
- Current HPI
- 172.3659
- Rent YoY
- ▲ 5.60%
- Metro
- Bloomington, IL
- State GDP YoY
- ▲ 1.59%
- F500 in state
- 60
Industry mix (Fortune 500 HQ in IL)
| Industry | F500 HQs | Revenue |
|---|---|---|
| Insurance | 4 | $201B |
|
||
| Consumer Goods | 4 | $87B |
|
||
| Industrial Machinery | 3 | $64B |
|
||
| Healthcare | 2 | $55B |
|
||
| Retail / Pharmacy | 1 | $148B |
|
||
| Agriculture / Food | 1 | $86B |
|
||
Price history
+328.3% since first listed4 events — show timeline
- 2026-06-13 Price Changed $159,900 MRED as Distributed by MLS Grid
- 2012-07-13 Sold (Public Records) $88,000 Public Records
- 2005-10-12 Sold (Public Records) $97,500 Public Records
- 2005-05-13 Sold (Public Records) $37,333 Public Records
Property tax history
+2.2%/yrLatest (2023): $2,732 · +6.8% YoY. Source: county tax records.
Cash-flow waterfall
monthlySold comps — $/sqft
last 12 mo · ≤1 miLoading sold comps…