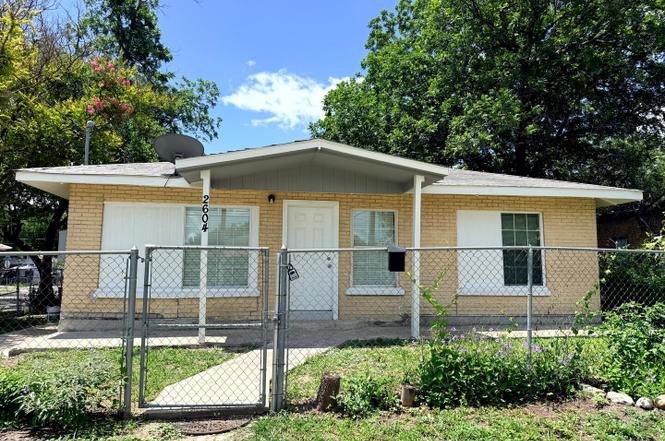
2604 Chihuahua St · San Antonio, TX
Flood risk 1/10 · Minimal
- FEMA flood zone
- X (unshaded)
- Chance of flooding over 30 yrs
- 0.0%
- Est. flood insurance / yr
- $507 – $1,088
Fire risk 1/10 · Minimal
- Est. fire insurance / yr
- $1,222 – $2,270
Heat risk 8/10 · Major
- Hot days now (above 109°F)
- 7 days/yr
- Hot days in 30 yrs
- 22 days/yr
Wind risk 7/10 · Major
- Chance of severe wind over 30 yrs
- 78.0%
Air-quality risk 2/10 · Minimal
- Unhealthy air days now
- 1 days/yr
- Unhealthy air days in 30 yrs
- 2 days/yr
Risk factors via First Street. Map © Google.
Why this score? — see what drove the C+ grade
The composite is a weighted blend of 9 inputs, each scored 0–100. Each bar is that input's sub-score; the figure is the points it added to the 100-point composite (weight × sub-score).
- Cash flow +16.6/30.0
- ARV discount +15.0/15.0
- Appreciation +10.0/10.0
- DSCR +5.1/10.0
- 1% rule +5.0/10.0
- Rent growth +4.4/5.0
- Livability +4.0/5.0
- Condition / age +2.5/5.0
- Schools +1.4/10.0
$139,900
🖨 Deal sheet 📄 Offer letter ✓ Due diligence
Listing remarks MLS
Fixer Upper Opportunity - Westside San Antonio! Minutes From Downtown! Discover a heavily discounted investment property located in the Westside of San Antonio, just a short drive from Downtown, Market Square, hospitals, and major highways. This home needs work but offers massive potential for the right investor.
Key facts
- Tenant occupied unit
- Close to dining
- Shared laundry area
Tags
Property features AI
Finance
- Other: Possession at closing/funding; For sale (not a short sale)
- HOA & community: Located in the CUPPLES/ZARZAMORA subdivision
Exterior
- Parking: 2+ access exits
- Utilities: Electric service by CPS; Water and sewer by SAWS (city water and sewer); City garbage service
- Home design: Pre-owned single-family design; Front faces north
- Construction: Approximately 71 years old; Brick and siding exterior; Composition (shingle) roof
- Exterior features: Chain-link fence; Mature trees; Corner lot; Street paved with sidewalks; Asphalt city street; Level lot; Near bus line
Interior
- Kitchen: Eat-in kitchen (8 x 6)
- Bedrooms: Master bedroom with split layout and full bath (13 x 9); Bedroom 2 (9 x 11); Bedroom 3 (8 x 12); Bedroom 4 (8 x 10); Bedroom 5 (8 x 10)
- Flooring: Linoleum flooring; Laminate flooring
- Bathrooms: Two full bathrooms; Master bath with tub/shower combination (5 x 7)
- Heating & cooling: Central heating (electric); One central air conditioning unit
- Interior features: Two living areas; Eat-in kitchen; Ground level / no steps; All bedrooms on main level; Laundry room on main level; Washer and dryer connections; Cable TV available; High-speed internet available; City garbage service; All window coverings remain; Secondary bedroom on lower level; Accessible / adaptive home; Multiple access exits; Bathroom on first floor; Bedroom on first floor; No carpet
- Laundry & utility: Washer connection; Dryer connection; Laundry room on main level
Neighborhood map
What this means for you Summary
Snapshot
- This is a 3-bed/2.0-bath single-family listed at $140k.
Deal economics
- At list price, monthly cash flow is $84 ($1k/yr) — positive.
- The deal already cash-flows at list — no discount required.
- To meet the 1% rule (rent ≥ 1% of price), the offer needs to be $140k (0.0% below list).
- Recommended offer: $138k (1.5% below list) — sets the bar for market timing.
- Cap rate 7.0% vs local median 3.8% in San Antonio — top-decile yield for the area; either an underpriced asset or a hidden risk that comps aren't pricing in. Stress-test before assuming the spread holds.
Location & tenants
- Location reads 80/100 on livability (#31 in TX, #1,616 nationally) — a professional / high-income tenant draw. Strengths: amenities A+, commute A+, cost of living A+; Watch: crime F.
- San Antonio ISD (urban): math 12% / reading 22% proficiency, ranked #805 of 826 in TX (top 98%) — low school quality limits family demand, transient renter base, plan for 1-2y turnover; 80% free/reduced lunch — lower-income household profile, screen leases tightly.
- Zoned schools: Sarah S King El (math 22% / reading 27%, grade F, #3,052 of 4,322 statewide, top 74%, 564 students, 98% FRL); Lanier H S (math 9% / reading 15%, grade F, #1,554 of 1,632 statewide, top 95%, 1,547 students, 97% FRL) — zoned schools average 97% FRL vs 80% district-wide (17 pts higher); higher-poverty schools than district average — tighter screening recommended.
- Market conditions: Rents rising fast (+7.7%/yr); 154 active listings in the ZIP; 30 comparable units currently listed for rent nearby; rentals at typical pace (median 22d on market — plan ~3-4 weeks tenant-placement turnaround); lower-income renter base — watch delinquency; 8,308 units permitted in Bexar County in 2024 (2,506 in 5+ unit buildings).
Forward outlook
- In year one you build about $15k of equity ($967 loan paydown + $14k appreciation (10.0% local appreciation)).
- Bexar County population projected at +50% by 2050 — long-run rental-demand tailwind backs the buy-and-hold thesis.
- At projected returns (10.0% appreciation + 7.7% rent growth), your $39k cash investment doubles in ~3 years — after that, you're playing with house money.
- By year 3, paydown + projected appreciation supports a ~$38k cash-out refi (75% LTV) — recoverable capital for the next deal without selling this one.
Negotiation context
- It's been on market 15 days — a 2% lower offer ($138k) is reasonable based on typical stale-listing flexibility.
- 4 sale attempts with the ask held roughly flat each time — persistent listings suggest the price (not the market) is what's stuck; bring a comps-based counter.
Risks & watch-outs
- Watch-outs: built in 1955 — expect roof / HVAC / electrical / plumbing capex.
- Climate carrying-cost: major wind risk, 78% chance of damaging wind over 30y; extreme-heat days projected 7→22/yr by 2055 (HVAC capex compounding) — expect insurance premiums to compound above CPI over the hold.
Questions for the listing agent
- Built in 1955 — when were the roof, HVAC, electrical panel, plumbing, and water heater last replaced?
- Is there a deadline driving the sale (1031 exchange, divorce, estate, relocation)? That informs how much negotiation room exists.
- Crime grade is F in this area — have there been break-ins, vandalism, or insurance claims at this property in the last 3 years? What carrier currently insures it and at what premium?
- What's the average days-on-market for RENTAL listings here right now (not sales)? A rising rental-DOM trend means longer vacancies and softer asking-rent achievability than the comps imply.
- What's the recent tenant-quality profile in this submarket — average credit score on applications, eviction rate, late-payment / NSF rate, and stable-employment percentage? A property-management company in the area should have these aggregated.
- How much new for-sale + rental construction is in the pipeline within 1–3 miles? Heavy new supply typically softens prices + rents 12–24 months out; constrained supply supports both.
Investment metrics
- 1% rule
- 1.00% ✗
- Cap rate
- 7.01%
- Cash-on-cash
- 2.57%
- DSCR
- 1.11
- GRM
- 8.3
CMA / ARV
- ARV (on-the-fly)
- $187,136
- Comps found
- 10
Show comp detail 10 sales within ~0.75 mi
| Address | Dist | Beds/Ba | Sqft | Sold | Price | $/sf | Match |
|---|---|---|---|---|---|---|---|
| 2604 Chihuahua | 0.00mi | 4/3.0 (+1) | 1,462 (0%) | 3mo | $84,900 | $58 | 88 |
| 1203 Saltillo | 0.40mi | 3/2.0 | 1,408 (-4%) | 1mo | $179,999 | $128 | 75 |
| 2939 Tampico St | 0.33mi | 3/2.5 | 1,448 (-1%) | 12mo | $230,000 | $159 | 71 |
| 2930 Tampico St | 0.30mi | 3/1.0 | 1,366 (-7%) | 3mo | $80,000 | $59 | 69 |
| 1714 San Patricio | 0.12mi | 3/2.0 | 1,290 (-12%) | 22mo | $189,000 | $147 | 57 |
| 839 Jean St | 0.28mi | 2/2.0 (-1) | 1,344 (-8%) | 21mo | $162,000 | $121 | 51 |
| 1538 Santiago | 0.28mi | 3/2.0 | 1,290 (-12%) | 23mo | $189,000 | $147 | 49 |
| 2015 Vera Cruz | 0.52mi | 3/2.0 | 1,266 (-13%) | 9mo | $229,000 | $181 | 46 |
| 1107 Barclay St | 0.72mi | 3/2.0 | 1,557 (+6%) | 15mo | $125,000 | $80 | 44 |
| 3011 W Cesar E Chavez | 0.55mi | 4/3.0 (+1) | 1,262 (-14%) | 6mo | $149,900 | $119 | 37 |
Match score weights: distance 35% · size 25% · config 20% · recency 20%. Top-matched comps best support the ARV.
Projected returns pro-forma
10.0% appreciation · 7.73% rent growth · sell at horizon
- IRR
- 28.0%
- Equity multiple
- 3.26×
- Total profit
- $88,561
- Equity at exit
- $126,033
- IRR
- 25.9%
- Equity multiple
- 7.99×
- Total profit
- $273,805
- Equity at exit
- $271,795
Cash invested: $39,172 (down + closing). Projections, not guarantees.
Landlord ↔ Tenant lean methodology
- Overall (STATE)
- 87 Strongly Landlord-Friendly
- State Texas
- 87 Strongly Landlord-Friendly · R+5
- County
- — inherits STATE
- City
- — inherits STATE
ZIP-level market 78207
- Home prices YoY
- 15.2%
- Rents YoY
- 7.7%
- Active inventory
- 154
- Price-to-rent
- 8.3×
Monthly cashflow live
- Estimated rent
- $1,399 high interval (Pro) →
- Mortgage (P&I)
- −$734
- Tax from tax record
- −$229 /mo · $2,751/yr
- Insurance
- −$58
- HOA
- −$0
- Vacancy / Maint / Mgmt
- −$294
- Net cashflow
- $84
Break-even live
UW: 25.0% down · 7.5% · 30yr · 1.5% tax · 5.0% vac · 8.0% maint · 8.0% mgmt
Financing live
Cash to close
- Down payment
- $34,975
- Closing costs
- $4,197
- Reserves months
- —
- Total cash needed
- —
Loan-product check · same deal, 3 products live
Conventional
25% down · 7.5% · 30yr
- Down + closing
- —
- Monthly P&I
- —
- Monthly cashflow
- —
- DSCR
- —
- Eligible?
- —
Personal DTI + credit; lowest rate.
DSCR
20% down · 8.5% · 30yr
- Down + closing
- —
- Monthly P&I
- —
- Monthly cashflow
- —
- DSCR
- —
- Eligible?
- —
No personal income docs; deal must DSCR.
Hard money
10% down · 12.0% · 12mo
- Down + closing
- —
- Monthly P&I
- —
- Monthly cashflow
- —
- DSCR
- —
- Eligible?
- —
Short-term bridge; refi at stabilization.
Rent comps 30 comps
| Address | Beds | Baths | Sqft | Rent | $/sqft | DOM | Units | Dist |
|---|---|---|---|---|---|---|---|---|
| 1823 San Carlos St San Antonio, TX | 3.0 | 2.0 | 1090 | $1,099 | $1.01 | 1d | 1 | 0.14mi |
| 1906 Montezuma St San Antonio, TX | 2.0 | 1.5 | 1790 | $1,300 | $0.73 | 43d | 1 | 0.20mi |
| 214 Aztec St San Antonio, TX | 3.0 | 2.0 | 973 | $1,275 | $1.31 | 14d | 1 | 0.53mi |
| 709 S Chupaderas St San Antonio, TX | 3.0 | 2.0 | 1518 | $1,345 | $0.89 | 23d | 1 | 0.63mi |
| 1135 Ceralvo St San Antonio, TX | 3.0 | 2.0 | 1164 | $1,450 | $1.25 | 4d | 1 | 0.73mi |
| 1135 Ceralvo St San Antonio, TX | 3.0 | 2.0 | 1164 | $1,450 | $1.25 | 21d | 1 | 0.73mi |
| 2811 Buena Vista St San Antonio, TX | 4.0 | 2.0 | 1750 | $2,350 | $1.34 | 23d | 1 | 0.77mi |
| 2425 Monterey St San Antonio, TX | 3.0 | 2.0 | 1416 | $2,000 | $1.41 | 43d | 1 | 0.80mi |
| 1938 S Zarzamora St Unit 710 San Antonio, TX | 2.0 | 2.0 | 955 | $1,102 | $1.15 | 2d | 1 | 0.82mi |
| 2003 S Zarzamora St San Antonio, TX | 1.0–4.0 | 1.0–2.0 | 1028 | $1,257 | $1.22 | 23d | 1 | 0.83mi |
| 2406 S Laredo St San Antonio, TX | 3.0 | 1.0 | 944 | $1,200 | $1.27 | 14d | 1 | 0.89mi |
| 319 Noria St San Antonio, TX | 3.0 | 1.0 | 1002 | $1,100 | $1.10 | 23d | 1 | 0.90mi |
| 2120 Monterey St Unit 102 San Antonio, TX | 2.0 | 2.0 | 1220 | $1,490 | $1.22 | 43d | 1 | 0.92mi |
| 2120 Monterey St Unit 102 San Antonio, TX | 2.0 | 2.0 | 1220 | $1,450 | $1.19 | 11d | 1 | 0.92mi |
| 509 S Trinity St San Antonio, TX | 3.0 | 1.0 | 921 | $1,300 | $1.41 | 4d | 1 | 1.00mi |
| 3038 W Salinas Unit 101 San Antonio, TX | 3.0 | 2.5 | 1149 | $1,550 | $1.35 | 4d | 1 | 1.01mi |
| 234 Gould St Unit 102 San Antonio, TX | 2.0 | 1.5 | 948 | $1,195 | $1.26 | 4d | 1 | 1.05mi |
| 3918 W Martin St San Antonio, TX | 3.0 | 1.0 | 1200 | $1,300 | $1.08 | 23d | 1 | 1.11mi |
| 2246 W Houston St San Antonio, TX | 4.0 | 3.0 | 1654 | $2,100 | $1.27 | 10d | 1 | 1.15mi |
| 231 Ceralvo St Unit Na San Antonio, TX | 3.0 | 2.0 | 1160 | $1,695 | $1.46 | 43d | 1 | 1.16mi |
| 333 Frio City Rd Unit 1 San Antonio, TX | 2.0 | 1.0 | 1350 | $1,350 | $1.00 | 10d | 1 | 1.21mi |
| 1209 El Paso St San Antonio, TX | 2.0 | 1.0 | 966 | $975 | $1.01 | 23d | 1 | 1.25mi |
| 614 Chihuahua St San Antonio, TX | 3.0 | 2.0 | 1082 | $1,400 | $1.29 | 43d | 1 | 1.29mi |
| 1102 El Paso St San Antonio, TX | 1.0–3.0 | 1.0–2.0 | 888 | $1,437 | $1.62 | 3d | 1 | 1.32mi |
| 215 S Brazos St San Antonio, TX | 3.0 | 1.0 | 900 | $1,350 | $1.50 | 4d | 1 | 1.35mi |
| 1820 W Houston St San Antonio, TX | 3.0 | 2.0 | 1132 | $2,300 | $2.03 | 43d | 1 | 1.35mi |
| 542 Drake Ave San Antonio, TX | 3.0 | 2.0 | 1368 | $1,875 | $1.37 | 43d | 1 | 1.36mi |
| 614 N Sabinas St San Antonio, TX | 3.0 | 2.0 | 930 | $1,249 | $1.34 | 4d | 1 | 1.41mi |
| 1545 Ruiz St San Antonio, TX | 2.0 | 2.0 | 1020 | $935 | $0.92 | 43d | 1 | 1.42mi |
| 626 Kirk Pl San Antonio, TX | 2.0 | 1.0 | 912 | $1,100 | $1.21 | 19d | 1 | 1.42mi |
Listing history 10 events
-
2026-06-18days on market $139,900 Active 15 DOM
-
2026-06-17days on market $139,900 Active 14 DOM
-
2026-06-16days on market $139,900 Active 13 DOM
-
2026-06-15statusdays on market $139,900 Active 12 DOM
-
2026-06-13days on market $139,900 New 10 DOM
-
2026-06-09days on market $139,900 New 6 DOM
-
2026-06-08days on market $139,900 New 5 DOM
-
2026-06-07days on market $139,900 New 4 DOM
-
2026-06-04remarks 699-char remark
-
2026-06-04$139,900 New 1 DOM
ⓘ Source: listings_history table (triggers on properties + properties_extension) + one-shot
backfill from property_details.listing_events for pre-trigger history.
Tax reassessment forecast TX · Resets to sale price
- Current annual tax
- $2,751 · $229/mo
- Projected year-2 tax
- $2,751 · $229/mo
- Expected delta
- $0/yr ($0/mo · 0.0%)
ⓘ Screening estimate from a state-policy table — verify with the county assessor before closing.
Climate risk First Street
- Flood 1/10 Low FEMA zone X (unshaded) · 0% chance over 30 yrs
- Wildfire 1/10 Low
- Heat 8/10 Severe 7 d/yr ≥109°F today · 22 d/yr by 30 yrs out
- Wind 7/10 Severe 78% chance of damaging wind over 30 yrs
- Air quality 2/10 Low 1 unhealthy d/yr today · 2 by 30 yrs out
Nearby sold comps map
Loading sold comps map…
Walkable amenities ~0.75 mi
Loading nearby amenities…
Taxation est. · year 1
- Rental income
- $16,785
- − Mortgage interest
- −$7,837
- − Property taxes
- −$2,751
- − Insurance
- −$700
- − Repairs & maintenance
- −$1,343
- − Management
- −$1,343
- − Depreciation
- −$4,070
- Taxable loss
- −$1,257
- Est. tax savings @ 24.0%
- +$302
- After-tax cash flow
- $1,308/yr
For passive investors: Depreciation is non-cash, so a rental often shows a tax loss while cash-flowing — sheltering income. Rental losses are passive: they offset passive income freely, and up to $25,000/yr can offset ordinary (W-2) income if you actively participate and your MAGI is under $100k (phasing out to $0 by $150k); unused losses carry forward. On sale, claimed depreciation is recaptured at up to 25%, and gains may owe capital-gains tax (a 1031 exchange can defer both). Figures are a year-1 estimate at your 24.0% rate — not tax advice; consult a CPA.
Schools (NCES district)
- District
- San Antonio ISD
- NCES district ID
- 4838730
- Math proficiency
- 12% ▼ -21.00%
- Reading proficiency
- 22% ▼ -7.00%
- Median HH income
- $30,952
- Composite
- 13.57/100
- National rank
- #9512
- State rank
- #805 of 826 in TX
Livability — San Antonio
- Score
- 80/100
- State rank
- #31
- US rank
- #1616
Category grades
Schools grade is shown separately in the Schools card above.
Census & demographics
- Census place
- San Antonio, TX
- County
- Bexar County · 1,990,555 people
- City population
- 1,806,925
- Metro
- San Antonio-New Braunfels, TX
- Population (ZIP)
- 55,474
- Household income
- $32,472
- Rent vs Own
- Severe rent burden
- 2789.0
Population outlook (Bexar County) Hauer SSP2
- Today (2025)
- 2,336,851 people
- By 2030
- 2,560,728 · +9.6%
- By 2040
- 3,020,569 · +29.3%
- By 2050
- 3,493,522 · +49.5%
- By 2075
- 4,668,459 · +99.8%
- By 2100
- 5,533,242 · +136.8%
Race, ethnicity, and origin ACS 2023
- Neighborhood character
- Predominantly Hispanic (88%)
- Race & ethnicity
- Hispanic / Latino 88% Two or more races 41% White 6% Black 5% Native American 2%
- Hispanic origin (detail)
- Mexican 79%
- Foreign-born
- 19% · Canada
- Languages at home
- 39% English-only · Spanish 60%
Political lean MEDSL · Bexar
- 2024 margin
- Lean D (+9.8) · D 54.3% · R 44.6% · Other 1.1%
- 2008→2024 swing
- +4.2pp toward D · 2008: 5.6pp · 2024: 9.8pp
- All cycles
- 2024: D+9.8 2020: D+18.2 2016: D+13.5 2012: D+4.6 2008: D+5.6
Not yet ingested
- Civics
- —
Market trends
- HPI YoY
- ▲ 34.92%
- Current HPI
- 264.7559
- Rent YoY
- ▲ 7.73%
- Metro
- San Antonio-New Braunfels, TX
- State GDP YoY
- ▲ 3.95%
- F500 in state
- 110
Industry mix (Fortune 500 HQ in TX)
| Industry | F500 HQs | Revenue |
|---|---|---|
| Energy | 16 | $1,198B |
|
||
| Technology | 5 | $198B |
|
||
| Engineering / Construction | 4 | $72B |
|
||
| Energy Services | 3 | $60B |
|
||
| Utilities | 3 | $41B |
|
||
| Healthcare | 2 | $330B |
|
||
Price history
+27.2% since first listed17 events — show timeline
- 2026-06-03 Listed $139,900 LERA
- 2026-03-18 Sold (Public Records) — Public Records
- 2026-03-12 Sold (MLS) — LERA
- 2026-03-07 Pending — LERA
- 2026-03-05 Relisted — LERA
- 2026-02-15 Pending — LERA
- 2026-02-10 Price Changed $84,900 LERA
- 2026-01-26 Price Changed $89,500 LERA
- 2026-01-19 Relisted — LERA
- 2026-01-11 Listing Removed — LERA
- 2025-12-29 Price Changed $99,500 LERA
- 2025-12-11 Listed $110,000 LERA
- 2025-09-25 Sold (Public Records) — Public Records
- 2009-02-26 Sold (Public Records) — Public Records
- 2006-04-10 Sold (Public Records) — Public Records
- 2003-10-21 Sold (Public Records) — Public Records
- 2003-10-21 Sold (Public Records) — Public Records
Property tax history
+5.8%/yrLatest (2025): $2,751 · +10.0% YoY. Source: county tax records.
Cash-flow waterfall
monthlySold comps — $/sqft
last 12 mo · ≤1 miLoading sold comps…