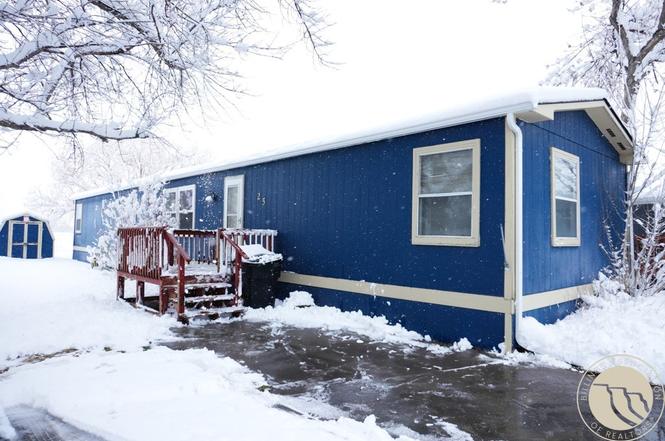
25 Willow Bend Dr S · Billings, MT
Flood risk 1/10 · Minimal
- FEMA flood zone
- X (unshaded)
- Chance of flooding over 30 yrs
- 0.0%
- Est. flood insurance / yr
- $507 – $1,088
Fire risk 1/10 · Minimal
- Est. fire insurance / yr
- $918 – $1,706
Heat risk 3/10 · Minor
- Hot days now (above 95°F)
- 7 days/yr
- Hot days in 30 yrs
- 15 days/yr
Wind risk 1/10 · Minimal
- Chance of severe wind over 30 yrs
- —
Air-quality risk 3/10 · Minor
- Unhealthy air days now
- 2 days/yr
- Unhealthy air days in 30 yrs
- 5 days/yr
Risk factors via First Street. Map © Google.
Why this score? — see what drove the B+ grade
The composite is a weighted blend of 9 inputs, each scored 0–100. Each bar is that input's sub-score; the figure is the points it added to the 100-point composite (weight × sub-score).
- Cash flow +30.0/30.0
- ARV discount +12.8/15.0
- 1% rule +10.0/10.0
- DSCR +10.0/10.0
- Schools +4.5/10.0
- Livability +4.0/5.0
- Rent growth +3.8/5.0
- Condition / age +2.5/5.0
- Appreciation +0.0/10.0
$70,000
🖨 Deal sheet 📄 Offer letter ✓ Due diligence
Key facts
- Backs up to a field
- Split-bedroom layout
- Wood stove
Tags
Property features AI
Exterior
- Parking: Off-street parking
- Utilities: Public water; Public sewer
- Home design: Manufactured home (single family residence); One story
- Construction: Asphalt roof
- Exterior features: Deck; Shed(s); Corner lot; Landscaped yard; Level lot
Interior
- Kitchen: Gas range, oven, range; Dishwasher; Refrigerator
- Bedrooms: 3 main-level bedrooms
- Bathrooms: 2 full bathrooms (both on the main level)
- Heating & cooling: Natural gas forced-air heating; Central air conditioning
- Interior features: Dryer; Dishwasher; Gas range; Oven; Range; Refrigerator; Washer; No basement
- Laundry & utility: Washer and dryer included
Neighborhood map
What this means for you Summary
Snapshot
- This is a 3-bed/2.0-bath manufactured listed at $70k.
Deal economics
- At list price, monthly cash flow is $878 ($11k/yr) — positive.
- The deal already cash-flows at list — no discount required.
- Meets the 1% rule at list price ($2k rent vs $70k).
- Recommended offer: $64k (9.0% below list) — sets the bar for market timing.
- Cap rate 21.3% vs local median 3.0% in Billings — top-decile yield for the area; either an underpriced asset or a hidden risk that comps aren't pricing in. Stress-test before assuming the spread holds.
Location & tenants
- Location reads 80/100 on livability (#10 in MT, #1,830 nationally) — a professional / high-income tenant draw. Strengths: amenities A+, commute A+, housing A+; Watch: crime F.
- Elysian Elementary (rural): math 48% / reading 58% proficiency, ranked #15 of 116 in MT (top 13%) — acceptable for families but not a draw, mixed tenant base, ~2y average lease.
- Zoned schools: Elysian School (math 47% / reading 62%, grade C, #57 of 293 statewide, top 22%, 307 students, 0% FRL); Elysian Middle School (math 47% / reading 52%, grade C, #26 of 146 statewide, top 22%, 144 students, 0% FRL) — zoned schools average 0% FRL vs 29% district-wide (29 pts lower); this property's tenant base skews higher-income than the district average.
- Market conditions: Rents rising fast (+5.0%/yr); 197 active listings in the ZIP; 8 comparable units currently listed for rent nearby; rentals leasing fast (median 14d on market — plan ~1-2 weeks tenant-placement turnaround); solid renter incomes; 1,401 units permitted in Yellowstone County in 2024 (281 in 5+ unit buildings).
Forward outlook
- Local home prices are declining (-3.0%/yr); year-one equity from $484 of loan paydown is wiped out by about $2k of value loss. Plan a longer hold.
- Yellowstone County population projected at +26% by 2050 — long-run rental-demand tailwind backs the buy-and-hold thesis.
- At projected returns (-3.0% appreciation + 5.0% rent growth), your $20k cash investment doubles in ~3 years — after that, you're playing with house money.
Negotiation context
- It's been on market 97 days — a 9% lower offer ($64k) is reasonable based on typical stale-listing flexibility.
Questions for the listing agent
- It's been on market 97 days. Have you received any prior offers? Is the seller open to a 9% concession, seller financing, or rate buy-down credit?
- Why hasn't it sold? Are there any deal-killer items the seller is aware of (foundation, flood, title, zoning, code violations)?
- Is there a deadline driving the sale (1031 exchange, divorce, estate, relocation)? That informs how much negotiation room exists.
- Schools are D-rated, which usually means shorter tenancies and higher turnover. Who's the typical renter profile here, and what's been the actual vacancy rate?
- Crime grade is F in this area — have there been break-ins, vandalism, or insurance claims at this property in the last 3 years? What carrier currently insures it and at what premium?
- What's the average days-on-market for RENTAL listings here right now (not sales)? A rising rental-DOM trend means longer vacancies and softer asking-rent achievability than the comps imply.
- What's the recent tenant-quality profile in this submarket — average credit score on applications, eviction rate, late-payment / NSF rate, and stable-employment percentage? A property-management company in the area should have these aggregated.
- How much new for-sale + rental construction is in the pipeline within 1–3 miles? Heavy new supply typically softens prices + rents 12–24 months out; constrained supply supports both.
Investment metrics
- 1% rule
- 2.46% ✓
- Cap rate
- 21.35%
- Cash-on-cash
- 53.76%
- DSCR
- 3.39
- GRM
- 3.4
CMA / ARV
- ARV (on-the-fly)
- $79,344
- Comps found
- 11
Show comp detail 11 sales within ~0.75 mi
| Address | Dist | Beds/Ba | Sqft | Sold | Price | $/sf | Match |
|---|---|---|---|---|---|---|---|
| 16 Bridlewood Dr | 0.26mi | 3/2.0 | 1,216 (-11%) | 9mo | $30,000 | $25 | 62 |
| 16 Brookpark Dr | 0.31mi | 3/2.0 | 1,226 (-10%) | 7mo | $40,000 | $33 | 62 |
| 31 W Meadow Drive Dr | 0.39mi | 3/2.0 | 1,260 (-8%) | 10mo | $47,500 | $38 | 60 |
| 36 Chestnut Dr | 0.40mi | 3/2.0 | 1,200 (-12%) | 2mo | $55,000 | $46 | 59 |
| 8 Redrock Dr | 0.33mi | 3/2.0 | 1,216 (-11%) | 10mo | $89,900 | $74 | 58 |
| 6 Northglen Dr | 0.46mi | 3/2.0 | 1,216 (-11%) | 3mo | $89,500 | $74 | 57 |
| 13 Willow Bend Dr N | 0.15mi | 3/2.0 | 1,216 (-11%) | 21mo | $79,900 | $66 | 57 |
| 12 Woodgrain Dr | 0.18mi | 3/2.0 | 1,206 (-12%) | 23mo | $32,000 | $27 | 53 |
| 31 Wheatland Dr | 0.25mi | 3/2.0 | 1,216 (-11%) | 21mo | $77,700 | $64 | 52 |
| 14 Walnut Grove Dr | 0.42mi | 3/2.0 | 1,232 (-10%) | 20mo | $125,000 | $101 | 47 |
| 44 Bridlewood Dr Dr | 0.37mi | 2/2.0 (-1) | 1,216 (-11%) | 20mo | $70,000 | $58 | 42 |
Match score weights: distance 35% · size 25% · config 20% · recency 20%. Top-matched comps best support the ARV.
Projected returns pro-forma
-3.0% appreciation · 5.03% rent growth · sell at horizon
- IRR
- 54.2%
- Equity multiple
- 3.46×
- Total profit
- $48,205
- Equity at exit
- $10,437
- IRR
- 60.1%
- Equity multiple
- 7.61×
- Total profit
- $129,467
- Equity at exit
- $6,052
Cash invested: $19,600 (down + closing). Projections, not guarantees.
Landlord ↔ Tenant lean methodology
- Overall (STATE)
- 82 Strongly Landlord-Friendly
- State Montana
- 82 Strongly Landlord-Friendly · R+11
- County
- — inherits STATE
- City
- — inherits STATE
ZIP-level market 59102
- Rents YoY
- 5.0%
- Active inventory
- 197
- Price-to-rent
- 3.4×
Monthly cashflow live
- Estimated rent
- $1,724 high interval (Pro) →
- Mortgage (P&I)
- −$367
- Tax est. 1.5%
- −$88 /mo · $1,050/yr
- Insurance
- −$29
- HOA
- −$0
- Vacancy / Maint / Mgmt
- −$362
- Net cashflow
- $878
Break-even live
UW: 25.0% down · 7.5% · 30yr · 1.5% tax · 5.0% vac · 8.0% maint · 8.0% mgmt
Financing live
Cash to close
- Down payment
- $17,500
- Closing costs
- $2,100
- Reserves months
- —
- Total cash needed
- —
Loan-product check · same deal, 3 products live
Conventional
25% down · 7.5% · 30yr
- Down + closing
- —
- Monthly P&I
- —
- Monthly cashflow
- —
- DSCR
- —
- Eligible?
- —
Personal DTI + credit; lowest rate.
DSCR
20% down · 8.5% · 30yr
- Down + closing
- —
- Monthly P&I
- —
- Monthly cashflow
- —
- DSCR
- —
- Eligible?
- —
No personal income docs; deal must DSCR.
Hard money
10% down · 12.0% · 12mo
- Down + closing
- —
- Monthly P&I
- —
- Monthly cashflow
- —
- DSCR
- —
- Eligible?
- —
Short-term bridge; refi at stabilization.
Rent comps 8 comps
| Address | Beds | Baths | Sqft | Rent | $/sqft | DOM | Units | Dist |
|---|---|---|---|---|---|---|---|---|
| 3900 Olympic Blvd Billings, MT | 2.0–3.0 | 1.0–2.0 | 960 | $1,695 | $1.76 | 13d | 5 | 0.90mi |
| 371 Cape Cod Dr Billings, MT | 2.0 | 1.5 | 1175 | $1,495 | $1.27 | 21d | 1 | 0.98mi |
| 353 Cape Cod Dr Unit 3 Billings, MT | 2.0 | 1.0 | 1056 | $1,295 | $1.23 | 13d | 1 | 0.99mi |
| 3900 Victory Cir Billings, MT | 2.0 | 1.0 | 966 | $1,360 | $1.41 | 13d | 21 | 1.11mi |
| 218 Brookshire Blvd Billings, MT | 2.0 | 2.0 | 1128 | $1,445 | $1.28 | 21d | 1 | 1.38mi |
| 3040 Central Ave Billings, MT | 3.0 | 1.0–2.0 | 887 | $1,867 | $2.10 | 13d | 25 | 1.40mi |
| 501 S 44th St W Billings, MT | 1.0–3.0 | 1.0–2.0 | 1024 | $2,250 | $2.20 | 13d | 7 | 1.48mi |
| 611 S 44th St W Billings, MT | 3.0 | 2.0 | 1370 | $2,150 | $1.57 | 13d | 1 | 1.49mi |
Listing history 18 events
-
2026-06-19days on market $70,000 Active 97 DOM
-
2026-06-18price $70,000 Active 96 DOM
-
2026-06-18days on market $85,000 Active 96 DOM
-
2026-06-17days on market $85,000 Active 95 DOM
-
2026-06-16days on market $85,000 Active 94 DOM
-
2026-06-15days on market $85,000 Active 93 DOM
-
2026-06-14days on market $85,000 Active 91 DOM
-
2026-06-13days on market $85,000 Active 90 DOM
-
2026-06-10days on market $85,000 Active 88 DOM
-
2026-06-09days on market $85,000 Active 87 DOM
-
2026-06-08days on market $85,000 Active 86 DOM
-
2026-06-07days on market $85,000 Active 85 DOM
-
2026-06-05days on market $85,000 Active 82 DOM
-
2026-06-02days on market $85,000 Active 80 DOM
-
2026-06-01days on market $85,000 Active 79 DOM
-
2026-05-31days on market $85,000 Active 78 DOM
-
2026-05-30days on market $85,000 Active 77 DOM
-
2026-03-14$85,000 Active
ⓘ Source: listings_history table (triggers on properties + properties_extension) + one-shot
backfill from property_details.listing_events for pre-trigger history.
Climate risk First Street
- Flood 1/10 Low FEMA zone X (unshaded) · 0% chance over 30 yrs
- Wildfire 1/10 Low
- Heat 3/10 Moderate 7 d/yr ≥95°F today · 15 d/yr by 30 yrs out
- Wind 1/10 Low
- Air quality 3/10 Moderate 2 unhealthy d/yr today · 5 by 30 yrs out
Nearby sold comps map
Loading sold comps map…
Walkable amenities ~0.75 mi
Loading nearby amenities…
Taxation est. · year 1
- Rental income
- $20,687
- − Mortgage interest
- −$3,921
- − Property taxes
- −$1,050
- − Insurance
- −$350
- − Repairs & maintenance
- −$1,655
- − Management
- −$1,655
- − Depreciation
- −$2,036
- Taxable income
- $10,020
- Est. tax owed @ 24.0%
- −$2,405
- After-tax cash flow
- $8,133/yr
For passive investors: Depreciation is non-cash, so a rental often shows a tax loss while cash-flowing — sheltering income. Rental losses are passive: they offset passive income freely, and up to $25,000/yr can offset ordinary (W-2) income if you actively participate and your MAGI is under $100k (phasing out to $0 by $150k); unused losses carry forward. On sale, claimed depreciation is recaptured at up to 25%, and gains may owe capital-gains tax (a 1031 exchange can defer both). Figures are a year-1 estimate at your 24.0% rate — not tax advice; consult a CPA.
Schools (NCES district)
- District
- Elysian Elementary
- NCES district ID
- 3009840
- Math proficiency
- 48% ▼ -4.00%
- Reading proficiency
- 58% ▼ -4.00%
- Median HH income
- $47,094
- Composite
- 44.96/100
- National rank
- #2705
- State rank
- #15 of 116 in MT
Livability — Billings
- Score
- 80/100
- State rank
- #10
- US rank
- #1830
Category grades
Schools grade is shown separately in the Schools card above.
Census & demographics
- Census place
- Billings, MT
- County
- Yellowstone County · 159,426 people
- City population
- 147,124
- Metro
- Billings, MT
- Population (ZIP)
- 47,977
- Household income
- $76,141
- Rent vs Own
- Severe rent burden
- 1584.0
Population outlook (Yellowstone County) Hauer SSP2
- Today (2025)
- 176,227 people
- By 2030
- 185,619 · +5.3%
- By 2040
- 203,543 · +15.5%
- By 2050
- 221,100 · +25.5%
- By 2075
- 266,931 · +51.5%
- By 2100
- 301,141 · +70.9%
Race, ethnicity, and origin ACS 2023
- Neighborhood character
- Predominantly White (88%)
- Race & ethnicity
- White 88% Hispanic / Latino 6% Two or more races 5% Native American 2% Asian 1%
- Hispanic origin (detail)
- Mexican 4%
- Common ancestry
- Portuguese 10% Slovak 3% Lithuanian 3%
- Foreign-born
- 2% · Canada, Vietnam
- Languages at home
- 96% English-only · Spanish 2% Vietnamese 1%
Political lean MEDSL · Yellowstone
- 2024 margin
- Strong R (+27.1) · D 34.9% · R 62.0% · Other 3.1%
- 2008→2024 swing
- -20.8pp toward R · 2008: -6.3pp · 2024: -27.1pp
- All cycles
- 2024: R+27.1 2020: R+24.0 2016: R+27.1 2012: R+20.6 2008: R+6.3
Not yet ingested
- Civics
- —
Market trends
- HPI YoY
- ▼ -364.20%
- Current HPI
- 205.0915
- Rent YoY
- ▲ 5.03%
- Metro
- Billings, MT
- State GDP YoY
- ▲ 3.41%
- F500 in state
- 2
Industry mix (Fortune 500 HQ in MT)
| Industry | F500 HQs | Revenue |
|---|---|---|
| Technology / Analytics | 1 | $2B |
|
||
Price history
1 event — show timeline
- 2026-03-14 Listed $85,000 BMTMLS
Cash-flow waterfall
monthlySold comps — $/sqft
last 12 mo · ≤1 miLoading sold comps…