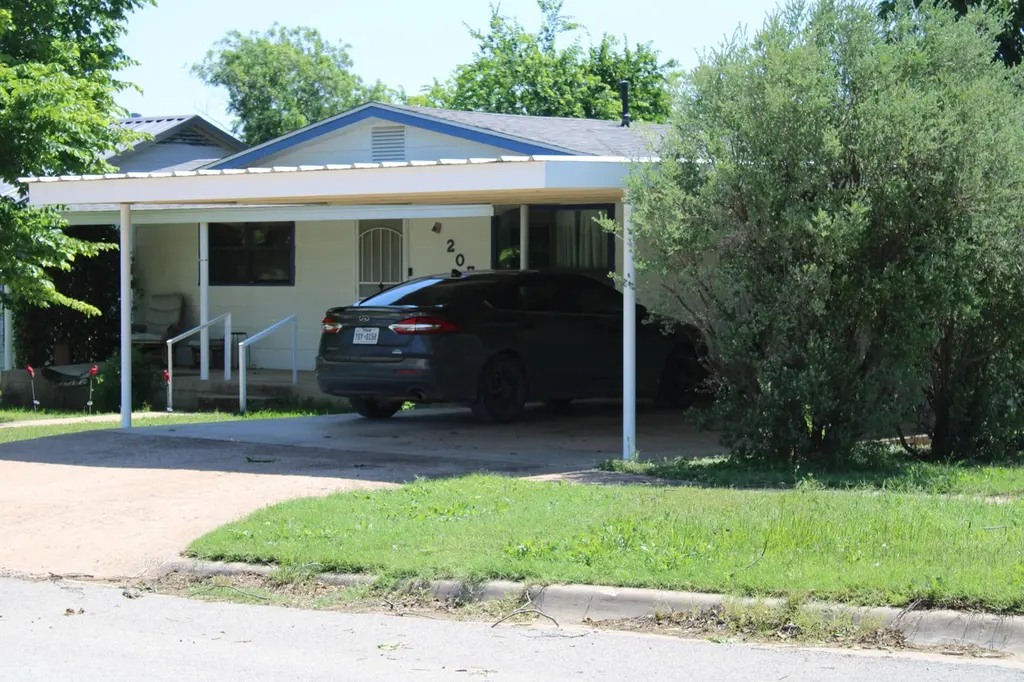
207 Hamilton Ave · Ballinger, TX
Flood risk 1/10 · Minimal
- FEMA flood zone
- X
- Chance of flooding over 30 yrs
- 0.0%
- Est. flood insurance / yr
- $507 – $1,088
Fire risk 5/10 · Moderate
- Est. fire insurance / yr
- $1,222 – $2,270
Heat risk 7/10 · Major
- Hot days now (above 106°F)
- 7 days/yr
- Hot days in 30 yrs
- 21 days/yr
Wind risk 4/10 · Minor
- Chance of severe wind over 30 yrs
- 16.0%
Air-quality risk 1/10 · Minimal
- Unhealthy air days now
- 0 days/yr
- Unhealthy air days in 30 yrs
- 0 days/yr
Risk factors via First Street. Map © Google.
Why this score? — see what drove the D- grade
The composite is a weighted blend of 9 inputs, each scored 0–100. Each bar is that input's sub-score; the figure is the points it added to the 100-point composite (weight × sub-score).
- ARV discount +9.9/15.0
- Cash flow +7.1/30.0
- Appreciation +7.0/10.0
- Livability +3.3/5.0
- Schools +3.1/10.0
- 1% rule +2.5/10.0
- Rent growth +2.5/5.0
- Condition / age +2.5/5.0
- DSCR +1.3/10.0
$157,500
🖨 Deal sheet 📄 Offer letter ✓ Due diligence
Listing remarks MLS
Charming 3bed 2 1/2bath home in quite neighborhood. This house has tons of room for all you family's needs. Two car carport and large shop in the back yard.
Key facts
- Quiet neighborhood
- Large shop
- Two car carport
Tags
Property features AI
Exterior
- Parking: Carport (2 spaces)
- Utilities: Public water; Public sewer
- Home design: Single family residence; One story; Fiber cement exterior
- Construction: Built with fiber cement siding; Composition roof; Pillar/post/pier and slab foundation
- Exterior features: Storage; Outbuilding; Workshop; Chain link fencing; Paved city street frontage; Interior lot
Interior
- Kitchen: Dishwasher; Gas water heater
- Flooring: Carpet; Combination flooring; Vinyl
- Bathrooms: Two full bathrooms; One half bathroom
- Heating & cooling: Central heating (natural gas); Central electric cooling; Ceiling fans
- Interior features: Ceiling fans throughout; Window coverings; Den with fireplace
- Laundry & utility: Laundry room with washer and dryer hookups (electric and gas)
Neighborhood map
What this means for you Summary
Snapshot
- This is a 3-bed/2.5-bath single-family listed at $158k.
Deal economics
- At list price, monthly cash flow is $-226 ($-3k/yr) — negative.
- To cash-flow at today's rent, offer at most $118k (25.4% below list).
- To meet the 1% rule (rent ≥ 1% of price), the offer needs to be $118k (24.9% below list).
- Recommended offer: $118k (25.4% below list) — sets the bar for cash-flow.
Location & tenants
- Location reads 66/100 on livability (#623 in TX) — a middle-class / working-renter tenant base. Strengths: crime A+, cost of living A+, housing A+; Watch: health & safety D+, employment D, amenities F.
- Ballinger ISD (town): math 33% / reading 41% proficiency, ranked #496 of 826 in TX (top 60%) — families likely to look elsewhere, expect single-tenant / working-renter base with shorter leases.
- Zoned schools: Ballinger El (math 32% / reading 42%, grade F, #1,769 of 4,322 statewide, top 44%, 368 students, 68% FRL); Ballinger J H (math 32% / reading 37%, grade F, #858 of 1,662 statewide, top 54%, 179 students, 61% FRL); Ballinger H S (math 42% / reading 52%, grade D-, #591 of 1,632 statewide, top 38%, 266 students, 49% FRL).
- Market conditions: 61 active listings in the ZIP; 2 units permitted in Runnels County in 2024 (0 in 5+ unit buildings).
Forward outlook
- In year one you build about $8k of equity ($1k loan paydown + $6k appreciation (4.1% local appreciation)).
- By year 5, paydown + projected appreciation supports a ~$33k cash-out refi (75% LTV) — recoverable capital for the next deal without selling this one.
Negotiation context
- It's been on market 35 days — a 3% lower offer ($153k) is reasonable based on typical stale-listing flexibility.
- 2 sale attempts since 11y ago with the ask held roughly flat each time — persistent listings suggest the price (not the market) is what's stuck; bring a comps-based counter.
Risks & watch-outs
- Climate carrying-cost: moderate wildfire risk; extreme-heat days projected 7→21/yr by 2055 (HVAC capex compounding) — expect insurance premiums to compound above CPI over the hold.
Questions for the listing agent
- What do current leases actually rent for vs. the listed asking? Can we see a recent rent roll and the last 12 months of T-12 income?
- It's been on market 35 days. Have you received any prior offers? Is the seller open to a 25% concession, seller financing, or rate buy-down credit?
- Built in 1965 — when were the roof, HVAC, electrical panel, plumbing, and water heater last replaced?
- Is there a deadline driving the sale (1031 exchange, divorce, estate, relocation)? That informs how much negotiation room exists.
- Schools are F-rated, which usually means shorter tenancies and higher turnover. Who's the typical renter profile here, and what's been the actual vacancy rate?
- The area grade is low — what's the realistic commute time and amenity access for the typical tenant pool here? Any planned neighborhood developments (good or bad) we should know about?
- What's the average days-on-market for RENTAL listings here right now (not sales)? A rising rental-DOM trend means longer vacancies and softer asking-rent achievability than the comps imply.
- What's the recent tenant-quality profile in this submarket — average credit score on applications, eviction rate, late-payment / NSF rate, and stable-employment percentage? A property-management company in the area should have these aggregated.
- How much new for-sale + rental construction is in the pipeline within 1–3 miles? Heavy new supply typically softens prices + rents 12–24 months out; constrained supply supports both.
Investment metrics
- 1% rule
- 0.75% ✗
- Cap rate
- 4.57%
- Cash-on-cash
- -6.16%
- DSCR
- 0.73
- GRM
- 11.1
CMA / ARV
- ARV (median comp)
- $166,414
- List price
- $157,500
- Delta
- -5.36%
- Verdict
- FAIR
- Comps
- 20 within 1.0 mi
Show comp detail 12 sales within ~0.75 mi
| Address | Dist | Beds/Ba | Sqft | Sold | Price | $/sf | Match |
|---|---|---|---|---|---|---|---|
| 307 Sargent Ave | 0.16mi | 2/2.0 (-1) | 1,593 (+1%) | 6mo | $89,000 | $56 | 79 |
| 407 Largent Ave | 0.16mi | 4/2.0 (+1) | 1,496 (-5%) | 4mo | $54,724 | $37 | 74 |
| 600 Mccarver Dr | 0.55mi | 3/2.0 | 1,575 (-0%) | 11mo | $188,500 | $120 | 63 |
| 1105 N 5th Ave | 0.17mi | 2/1.0 (-1) | 1,424 (-10%) | 7mo | $158,000 | $111 | 59 |
| 909 N 5th St | 0.24mi | 3/2.0 | 1,426 (-10%) | 14mo | $65,000 | $46 | 59 |
| 1200 N 8th St | 0.43mi | 3/2.0 | 1,487 (-6%) | 19mo | $156,500 | $105 | 52 |
| 902 10th St | 0.60mi | 3/2.0 | 1,546 (-2%) | 18mo | $143,500 | $93 | 52 |
| 802 N 11th St | 0.67mi | 3/2.0 | 1,492 (-5%) | 12mo | $164,900 | $111 | 48 |
| 905 Ave D | 0.73mi | 3/2.0 | 1,528 (-3%) | 15mo | $145,000 | $95 | 46 |
| 403 Crosson St | 0.40mi | 3/1.0 | 1,390 (-12%) | 13mo | $85,000 | $61 | 45 |
| 1203 8th St | 0.47mi | 3/1.0 | 1,408 (-11%) | 13mo | $125,000 | $89 | 44 |
| 906 Country Club Dr | 0.73mi | 3/2.0 | 1,790 (+14%) | 11mo | $249,500 | $139 | 32 |
Match score weights: distance 35% · size 25% · config 20% · recency 20%. Top-matched comps best support the ARV.
Projected returns pro-forma
4.09% appreciation · 3.0% rent growth · sell at horizon
- IRR
- 5.1%
- Equity multiple
- 1.31×
- Total profit
- $13,853
- Equity at exit
- $80,645
- IRR
- 7.8%
- Equity multiple
- 2.33×
- Total profit
- $58,744
- Equity at exit
- $132,536
Cash invested: $44,100 (down + closing). Projections, not guarantees.
Landlord ↔ Tenant lean methodology
- Overall (STATE)
- 87 Strongly Landlord-Friendly
- State Texas
- 87 Strongly Landlord-Friendly · R+5
- County
- — inherits STATE
- City
- — inherits STATE
ZIP-level market 76821
- Home prices YoY
- 2.5%
- Active inventory
- 61
- Price-to-rent
- 11.1×
Monthly cashflow live
- Estimated rent
- $1,184 medium interval (Pro) →
- Mortgage (P&I)
- −$826
- Tax from tax record
- −$270 /mo · $3,238/yr
- Insurance
- −$66
- HOA
- −$0
- Vacancy / Maint / Mgmt
- −$249
- Net cashflow
- $-226
Break-even live
UW: 25.0% down · 7.5% · 30yr · 1.5% tax · 5.0% vac · 8.0% maint · 8.0% mgmt
Financing live
Cash to close
- Down payment
- $39,375
- Closing costs
- $4,725
- Reserves months
- —
- Total cash needed
- —
Loan-product check · same deal, 3 products live
Conventional
25% down · 7.5% · 30yr
- Down + closing
- —
- Monthly P&I
- —
- Monthly cashflow
- —
- DSCR
- —
- Eligible?
- —
Personal DTI + credit; lowest rate.
DSCR
20% down · 8.5% · 30yr
- Down + closing
- —
- Monthly P&I
- —
- Monthly cashflow
- —
- DSCR
- —
- Eligible?
- —
No personal income docs; deal must DSCR.
Hard money
10% down · 12.0% · 12mo
- Down + closing
- —
- Monthly P&I
- —
- Monthly cashflow
- —
- DSCR
- —
- Eligible?
- —
Short-term bridge; refi at stabilization.
Listing history 20 events
-
2026-06-18days on market $157,500 Active 35 DOM
-
2026-06-17days on market $157,500 Active 34 DOM
-
2026-06-16days on market $157,500 Active 33 DOM
-
2026-06-15days on market $157,500 Active 32 DOM
-
2026-06-13days on market $157,500 Active 30 DOM
-
2026-06-12days on market $157,500 Active 29 DOM
-
2026-06-09days on market $157,500 Active 26 DOM
-
2026-06-08days on market $157,500 Active 25 DOM
-
2026-06-08days on market $157,500 Active 24 DOM
-
2026-06-07days on market $157,500 Active 23 DOM
-
2026-06-03days on market $157,500 Active 20 DOM
-
2026-06-02days on market $157,500 Active 19 DOM
-
2026-06-02remarks 457-char remark
-
2026-06-01days on market $157,500 Active 18 DOM
-
2026-05-31days on market $157,500 Active 17 DOM
-
2026-05-14$157,500 Active 147-char remark
-
2016-12-20soldstatus
-
2015-05-26soldstatus
-
2015-04-27soldstatus 156-char remark
Show marketing remark (156 chars)
Charming 3bed 2 1/2bath home in quite neighborhood. This house has tons of room for all you family's needs. Two car carport and large shop in the back yard.
-
2015-02-20$94,900 156-char remark
Show marketing remark (156 chars)
Charming 3bed 2 1/2bath home in quite neighborhood. This house has tons of room for all you family's needs. Two car carport and large shop in the back yard.
ⓘ Source: listings_history table (triggers on properties + properties_extension) + one-shot
backfill from property_details.listing_events for pre-trigger history.
Tax reassessment forecast TX · Resets to sale price
- Current annual tax
- $3,238 · $270/mo
- Projected year-2 tax
- $3,238 · $270/mo
- Expected delta
- $0/yr ($0/mo · 0.0%)
ⓘ Screening estimate from a state-policy table — verify with the county assessor before closing.
Climate risk First Street
- Flood 1/10 Low FEMA zone X · 0% chance over 30 yrs
- Wildfire 5/10 Major
- Heat 7/10 Severe 7 d/yr ≥106°F today · 21 d/yr by 30 yrs out
- Wind 4/10 Moderate 16% chance of damaging wind over 30 yrs
- Air quality 1/10 Low 0 unhealthy d/yr today · 0 by 30 yrs out
Nearby sold comps map
Loading sold comps map…
Walkable amenities ~0.75 mi
Loading nearby amenities…
Taxation est. · year 1
- Rental income
- $14,202
- − Mortgage interest
- −$8,822
- − Property taxes
- −$3,238
- − Insurance
- −$788
- − Repairs & maintenance
- −$1,136
- − Management
- −$1,136
- − Depreciation
- −$4,582
- Taxable loss
- −$5,500
- Est. tax savings @ 24.0%
- +$1,320
- After-tax cash flow
- $-1,397/yr
For passive investors: Depreciation is non-cash, so a rental often shows a tax loss while cash-flowing — sheltering income. Rental losses are passive: they offset passive income freely, and up to $25,000/yr can offset ordinary (W-2) income if you actively participate and your MAGI is under $100k (phasing out to $0 by $150k); unused losses carry forward. On sale, claimed depreciation is recaptured at up to 25%, and gains may owe capital-gains tax (a 1031 exchange can defer both). Figures are a year-1 estimate at your 24.0% rate — not tax advice; consult a CPA.
Schools (NCES district)
- District
- Ballinger ISD
- NCES district ID
- 4809300
- Math proficiency
- 33% ▼ -2.00%
- Reading proficiency
- 41% ▼ -1.00%
- Median HH income
- $37,665
- Composite
- 30.8/100
- National rank
- #6144
- State rank
- #496 of 826 in TX
Livability — Ballinger
- Score
- 66/100
- State rank
- #623
- US rank
- #11849
Category grades
Schools grade is shown separately in the Schools card above.
Census & demographics
- Census place
- Ballinger, TX
- City population
- 4,572
- Population (ZIP)
- 4,572
Population outlook (Runnels County) Hauer SSP2
- Today (2025)
- 10,754 people
- By 2030
- 10,843 · +0.8%
- By 2040
- 10,946 · +1.8%
- By 2050
- 10,981 · +2.1%
- By 2075
- 11,103 · +3.2%
- By 2100
- 10,051 · -6.5%
Race, ethnicity, and origin ACS 2023
- Neighborhood character
- Majority White (60%)
- Race & ethnicity
- White 60% Hispanic / Latino 34% Two or more races 20% Black 5%
- Hispanic origin (detail)
- Mexican 32%
- Common ancestry
- Lithuanian 3% Italian 3% Slovak 2%
- Foreign-born
- 2% · Canada
- Languages at home
- 79% English-only · Spanish 20% German/W. Germanic 1% Russian/Polish/Slavic 1%
Political lean MEDSL · Runnels
- 2024 margin
- Solid R (+77.1) · D 11.1% · R 88.3%
- 2008→2024 swing
- -15.1pp toward R · 2008: -62.0pp · 2024: -77.1pp
- All cycles
- 2024: R+77.1 2020: R+73.8 2016: R+74.1 2012: R+70.6 2008: R+62.0
Not yet ingested
- Civics
- —
Market trends
- HPI YoY
- ▲ 4.09%
- Current HPI
- 168.3222
- Rent YoY
- —
- Metro
- —
- State GDP YoY
- ▲ 3.95%
- F500 in state
- 110
Industry mix (Fortune 500 HQ in TX)
| Industry | F500 HQs | Revenue |
|---|---|---|
| Energy | 16 | $1,198B |
|
||
| Technology | 5 | $198B |
|
||
| Engineering / Construction | 4 | $72B |
|
||
| Energy Services | 3 | $60B |
|
||
| Utilities | 3 | $41B |
|
||
| Healthcare | 2 | $330B |
|
||
Price history
+66.0% since first listed5 events — show timeline
- 2026-05-14 Listed $157,500 SAAR TX
- 2016-12-20 Sold (Public Records) — Public Records
- 2015-05-26 Sold (Public Records) — Public Records
- 2015-04-27 Sold (MLS) — SAAR TX
- 2015-02-20 Listed $94,900 SAAR TX
Property tax history
+6.3%/yrLatest (2025): $3,238 · +11.0% YoY. Source: county tax records.
Cash-flow waterfall
monthlySold comps — $/sqft
last 12 mo · ≤1 miLoading sold comps…