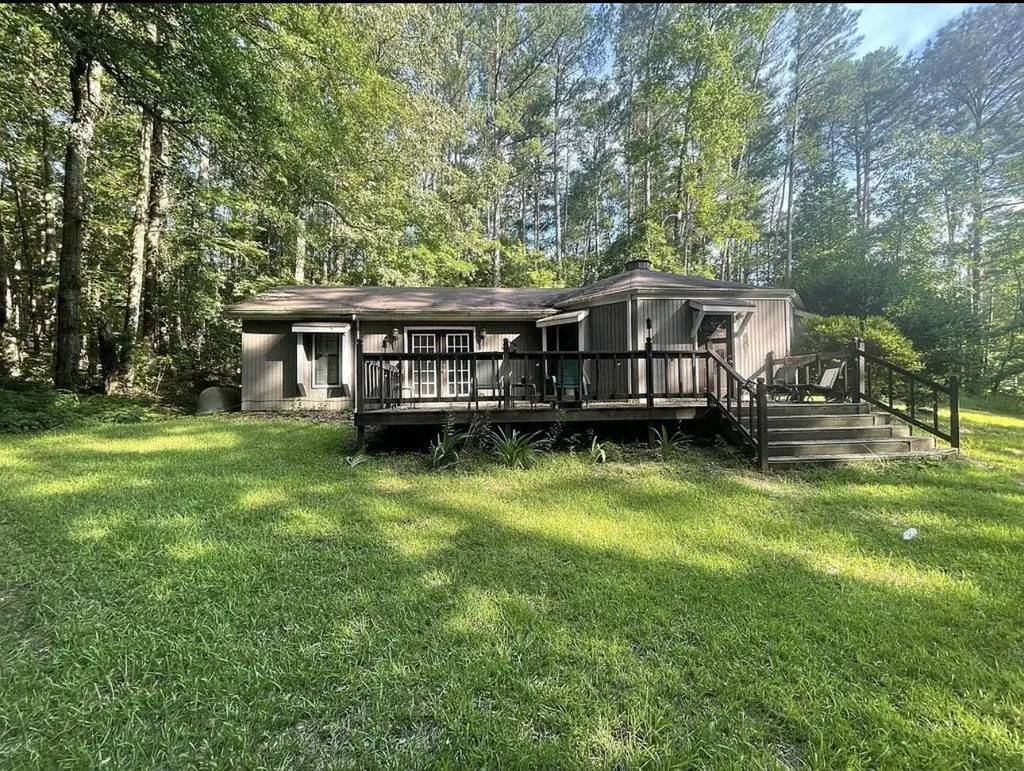
224 Little Turkey Trail Trl · Tupelo, MS
Flood risk 1/10 · Minimal
- FEMA flood zone
- X (unshaded)
- Chance of flooding over 30 yrs
- 0.0%
- Est. flood insurance / yr
- $507 – $1,088
Fire risk 4/10 · Minor
- Est. fire insurance / yr
- $1,241 – $2,305
Heat risk 6/10 · Moderate
- Hot days now (above 108°F)
- 7 days/yr
- Hot days in 30 yrs
- 21 days/yr
Wind risk 6/10 · Moderate
- Chance of severe wind over 30 yrs
- 27.0%
Air-quality risk 1/10 · Minimal
- Unhealthy air days now
- 0 days/yr
- Unhealthy air days in 30 yrs
- 0 days/yr
Risk factors via First Street. Map © Google.
Why this score? — see what drove the B- grade
The composite is a weighted blend of 9 inputs, each scored 0–100. Each bar is that input's sub-score; the figure is the points it added to the 100-point composite (weight × sub-score).
- Cash flow +30.0/30.0
- 1% rule +10.0/10.0
- DSCR +10.0/10.0
- ARV discount +7.5/15.0
- Livability +3.6/5.0
- Schools +3.0/10.0
- Rent growth +2.5/5.0
- Condition / age +2.5/5.0
- Appreciation +0.0/10.0
$78,000
🖨 Deal sheet (PDF) 📄 Offer letter ✓ Due diligence
Listing remarks
Investor Opportunity in Lake Piomingo!! Positioned on two lots, this property offers strong potential for renovation or redevelopment. The home needs updates, making it an ideal project for investors seeking value-add opportunities or buyers looking to customize a home at an affordable entry point. Located on a quiet dead-end road near the neighborhood entrance, the setting provides privacy with convenient access. The front deck offers usable outdoor space for future tenants or resale appeal. This property is a great candidate for investors ready to bring it back to life. Home is to be ''Sold AS''.
Key facts
- Two lots
- Usable outdoor space
- Quiet dead-end road
Tags
Property features AI
Finance
- Financial info: Annual property tax approximately $908.26
Exterior
- Home design: Single-family residential property; Located in the Lake Piomingo subdivision; Directions: From I-22, take Auburn Road north for about 4 miles to Lake Piomingo, then take the very first left
- Construction: About 1,206 square feet
- Exterior features: Lot roughly 90 x 158.1 (irregular)
Interior
- Bathrooms: 2 full bathrooms
- Interior features: 6 total rooms
Neighborhood map
What this means for you Summary
Snapshot
- This is a 3-bed/2.0-bath single-family listed at $78k.
Deal economics
- At list price, monthly cash flow is $636 ($8k/yr) — positive.
- The deal already cash-flows at list — no discount required.
- Meets the 1% rule at list price ($1k rent vs $78k).
Location & tenants
- Location reads 72/100 on livability (#26 in MS) — a middle-class / working-renter tenant base. Strengths: cost of living A+, housing A+, health & safety A-; Watch: schools C-, amenities D+, employment D+.
- Lee County School District (rural): math 37% / reading 35% proficiency, ranked #51 of 130 in MS (top 39%) — families likely to look elsewhere, expect single-tenant / working-renter base with shorter leases.
- Market conditions: 172 active listings in the ZIP; 154 units permitted in Lee County in 2024 (24 in 5+ unit buildings).
Forward outlook
- Local home prices are declining (-3.0%/yr); year-one equity from $539 of loan paydown is wiped out by about $2k of value loss. Plan a longer hold.
- Lee County population projected at +6% by 2050 — modest demand growth; plan on rents tracking national, not racing it.
- At projected returns (-3.0% appreciation + 3.0% rent growth), your $22k cash investment doubles in ~4 years — after that, you're playing with house money.
Negotiation context
- Only 14 days on market — expect competitive offers; lowballing is unlikely to land.
- Current owner paid $43k; list at $78k implies a 81% gain — meaningful room to come down on a strong offer.
Risks & watch-outs
- Climate carrying-cost: major wind risk, 27% chance of damaging wind over 30y; extreme-heat days projected 7→21/yr by 2055 (HVAC capex compounding) — expect insurance premiums to compound above CPI over the hold.
Questions for the listing agent
- Is there a deadline driving the sale (1031 exchange, divorce, estate, relocation)? That informs how much negotiation room exists.
- Crime grade is F in this area — have there been break-ins, vandalism, or insurance claims at this property in the last 3 years? What carrier currently insures it and at what premium?
- What's the average days-on-market for RENTAL listings here right now (not sales)? A rising rental-DOM trend means longer vacancies and softer asking-rent achievability than the comps imply.
- What's the recent tenant-quality profile in this submarket — average credit score on applications, eviction rate, late-payment / NSF rate, and stable-employment percentage? A property-management company in the area should have these aggregated.
- How much new for-sale + rental construction is in the pipeline within 1–3 miles? Heavy new supply typically softens prices + rents 12–24 months out; constrained supply supports both.
Investment metrics
- 1% rule
- 1.87% ✓
- Cap rate
- 16.08%
- Cash-on-cash
- 34.95%
- DSCR
- 2.56
- GRM
- 4.5
CMA / ARV
No comps found within radius.
Projected returns pro-forma
-3.0% appreciation · 3.0% rent growth · sell at horizon
- IRR
- 30.5%
- Equity multiple
- 2.28×
- Total profit
- $27,884
- Equity at exit
- $11,630
- IRR
- 37.7%
- Equity multiple
- 4.50×
- Total profit
- $76,485
- Equity at exit
- $6,744
Cash invested: $21,840 (down + closing). Projections, not guarantees.
Landlord ↔ Tenant lean methodology
- Overall (STATE)
- 90 Strongly Landlord-Friendly
- State Mississippi
- 90 Strongly Landlord-Friendly · R+11
- County
- — inherits STATE
- City
- — inherits STATE
ZIP-level market 38804
- Active inventory
- 172
- Price-to-rent
- 4.5×
Monthly cashflow live
- Estimated rent
- $1,460 medium interval (Pro) →
- Mortgage (P&I)
- −$409
- Tax from tax record
- −$76 /mo · $908/yr
- Insurance
- −$32
- HOA
- −$0
- Vacancy / Maint / Mgmt
- −$307
- Net cashflow
- $636
Break-even live
Sensitivity live
| Price | -10% $680 | -5% $658 | +0% $636 | +5% $614 | +10% $592 |
|---|---|---|---|---|---|
| Rent | -10% $521 | -5% $578 | +0% $636 | +5% $694 | +10% $751 |
| Rate | -1.0pp $675 | -0.5pp $656 | base $636 | +0.5pp $616 | +1.0pp $595 |
UW: 25.0% down · 7.5% · 30yr · 1.5% tax · 5.0% vac · 8.0% maint · 8.0% mgmt
Financing live
Cash to close
- Down payment
- $19,500
- Closing costs
- $2,340
- Reserves months
- —
- Total cash needed
- —
Loan-product check · same deal, 3 products live
Conventional
25% down · 7.5% · 30yr
- Down + closing
- —
- Monthly P&I
- —
- Monthly cashflow
- —
- DSCR
- —
- Eligible?
- —
Personal DTI + credit; lowest rate.
DSCR
20% down · 8.5% · 30yr
- Down + closing
- —
- Monthly P&I
- —
- Monthly cashflow
- —
- DSCR
- —
- Eligible?
- —
No personal income docs; deal must DSCR.
Hard money
10% down · 12.0% · 12mo
- Down + closing
- —
- Monthly P&I
- —
- Monthly cashflow
- —
- DSCR
- —
- Eligible?
- —
Short-term bridge; refi at stabilization.
Listing history 11 events
-
2026-06-19days on market $78,000 Active 14 DOM
-
2026-06-18days on market $78,000 Active 13 DOM
-
2026-06-17days on market $78,000 Active 12 DOM
-
2026-06-16days on market $78,000 Active 11 DOM
-
2026-06-15days on market $78,000 Active 10 DOM
-
2026-06-14days on market $78,000 Active 8 DOM
-
2026-06-12days on market $78,000 Active 7 DOM
-
2026-06-09days on market $78,000 Active 4 DOM
-
2026-06-08days on market $78,000 Active 3 DOM
-
2026-06-07remarks 621-char remark
-
2026-06-07$78,000 Active 2 DOM
ⓘ Source: listings_history table (triggers on properties + properties_extension) + one-shot
backfill from property_details.listing_events for pre-trigger history.
Tax reassessment forecast MS · Resets to sale price
- Current annual tax
- $908 · $76/mo
- Projected year-2 tax
- $908 · $76/mo
- Expected delta
- $0/yr ($0/mo · 0.0%)
ⓘ Screening estimate from a state-policy table — verify with the county assessor before closing.
Climate risk First Street
- Flood 1/10 Low FEMA zone X (unshaded) · 0% chance over 30 yrs
- Wildfire 4/10 Moderate
- Heat 6/10 Major 7 d/yr ≥108°F today · 21 d/yr by 30 yrs out
- Wind 6/10 Major 27% chance of damaging wind over 30 yrs
- Air quality 1/10 Low 0 unhealthy d/yr today · 0 by 30 yrs out
Nearby sold comps map
Loading sold comps map…
Walkable amenities ~0.75 mi
Loading nearby amenities…
Taxation est. · year 1
- Rental income
- $17,519
- − Mortgage interest
- −$4,369
- − Property taxes
- −$908
- − Insurance
- −$390
- − Repairs & maintenance
- −$1,402
- − Management
- −$1,402
- − Depreciation
- −$2,269
- Taxable income
- $6,780
- Est. tax owed @ 24.0%
- −$1,627
- After-tax cash flow
- $6,006/yr
For passive investors: Depreciation is non-cash, so a rental often shows a tax loss while cash-flowing — sheltering income. Rental losses are passive: they offset passive income freely, and up to $25,000/yr can offset ordinary (W-2) income if you actively participate and your MAGI is under $100k (phasing out to $0 by $150k); unused losses carry forward. On sale, claimed depreciation is recaptured at up to 25%, and gains may owe capital-gains tax (a 1031 exchange can defer both). Figures are a year-1 estimate at your 24.0% rate — not tax advice; consult a CPA.
Schools (NCES district)
- District
- Lee County School District
- NCES district ID
- 2802550
- Math proficiency
- 37% ▼ -11.00%
- Reading proficiency
- 35% ▼ -6.00%
- Median HH income
- $41,435
- Composite
- 30.38/100
- National rank
- #6253
- State rank
- #51 of 130 in MS
Livability — Tupelo
- Score
- 72/100
- State rank
- #26
- US rank
- #6369
Category grades
Schools grade is shown separately in the Schools card above.
Census & demographics
- County
- Lee County · 52,445 people
- City population
- 46,551
- Metro
- Tupelo, MS
- Population (ZIP)
- 16,693
- Household income
- $64,420
- Rent vs Own
- Severe rent burden
- 642.0
Population outlook (Lee County) Hauer SSP2
- Today (2025)
- 90,253 people
- By 2030
- 92,125 · +2.1%
- By 2040
- 94,914 · +5.2%
- By 2050
- 95,841 · +6.2%
- By 2075
- 94,189 · +4.4%
- By 2100
- 83,736 · -7.2%
Race, ethnicity, and origin ACS 2023
- Neighborhood character
- Majority White (63%)
- Race & ethnicity
- White 63% Black 30% Two or more races 3% Hispanic / Latino 3% Native American 1%
- Common ancestry
- Serbian 3% Slovak 2% Italian 2%
- Foreign-born
- 1%
- Languages at home
- 98% English-only · Spanish 1% Other Indo-European 1%
Political lean MEDSL · Lee
- 2024 margin
- Solid R (+38.8) · D 30.0% · R 68.9% · Other 1.1%
- 2008→2024 swing
- -8.3pp toward R · 2008: -30.5pp · 2024: -38.8pp
- All cycles
- 2024: R+38.8 2020: R+32.5 2016: R+37.7 2012: R+29.0 2008: R+30.5
Not yet ingested
- Civics
- —
Market trends
- HPI YoY
- ▼ -111.19%
- Current HPI
- 172.0153
- Rent YoY
- —
- Metro
- Tupelo, MS
- State GDP YoY
- —
- F500 in state
- 0
Price history
+81.4% since first listed4 events — show timeline
- 2026-06-05 Listed $78,000 NEMSBD
- 2019-01-22 Sold (Public Records) $43,000 Public Records
- 2018-11-02 Sold (Public Records) $43,000 Public Records
- 2009-04-03 Sold (Public Records) $43,000 Public Records
Property tax history
+11.6%/yrLatest (2025): $908 · +1.3% YoY. Source: county tax records.
Cash-flow waterfall
monthlySold comps — $/sqft
last 12 mo · ≤1 miLoading sold comps…