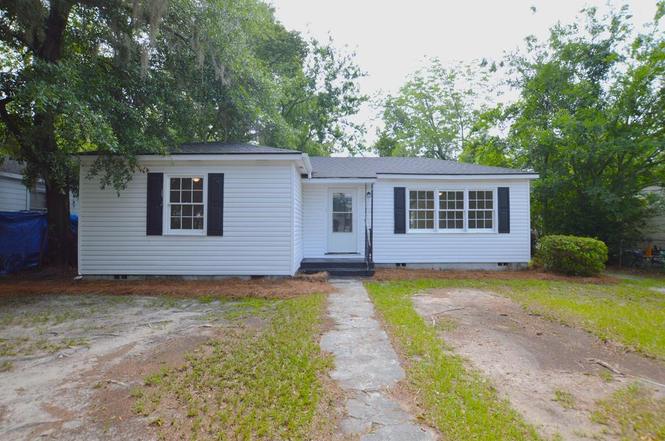
1709 Marion St · Valdosta, GA
Flood risk 1/10 · Minimal
- FEMA flood zone
- X (unshaded)
- Chance of flooding over 30 yrs
- 0.0%
- Est. flood insurance / yr
- $507 – $1,088
Fire risk 3/10 · Minor
- Est. fire insurance / yr
- $963 – $1,789
Heat risk 7/10 · Major
- Hot days now (above 108°F)
- 7 days/yr
- Hot days in 30 yrs
- 19 days/yr
Wind risk 9/10 · Severe
- Chance of severe wind over 30 yrs
- 99.0%
Air-quality risk 6/10 · Moderate
- Unhealthy air days now
- 10 days/yr
- Unhealthy air days in 30 yrs
- 11 days/yr
Risk factors via First Street. Map © Google.
Why this score? — see what drove the C+ grade
The composite is a weighted blend of 9 inputs, each scored 0–100. Each bar is that input's sub-score; the figure is the points it added to the 100-point composite (weight × sub-score).
- Cash flow +25.0/30.0
- ARV discount +15.0/15.0
- DSCR +8.1/10.0
- 1% rule +5.5/10.0
- Rent growth +3.5/5.0
- Livability +3.0/5.0
- Condition / age +2.5/5.0
- Schools +1.5/10.0
- Appreciation +0.0/10.0
$115,000
🖨 Deal sheet 📄 Offer letter ✓ Due diligence
Listing remarks MLS
Great investment opportunity at only $45k! There is currently a month to month tenant at $500/month. Rents have not been raised in a while, and with a little sprucing up, they should easily be around $600/month. 2017 architectural shingle roof, and all but two windows have been replaced with newer wood windows that came off of another renovation! This property can be purchased individually or together with 1109 Dunwoody Dr ($45K) and 605 E Moore St ($79k).
Key facts
- Natural light
- Vinyl siding
- Bonus area
Tags
Property features AI
Finance
- Other: Lot approximately 0.22 acre; Zoned R-10
Exterior
- Utilities: Public water; Public sewer; Cable available
- Home design: Single-family residence; One story; Residential property
- Construction: Vinyl siding
- Exterior features: Shingle roof
Interior
- Kitchen: Refrigerator
- Flooring: Vinyl
- Bathrooms: 1 full bathroom; 1 half bathroom
- Interior features: Refrigerator included; Vinyl flooring
- Laundry & utility: Dedicated laundry room
Neighborhood map
What this means for you Summary
Snapshot
- This is a 3-bed/1.5-bath single-family listed at $115k.
Deal economics
- At list price, monthly cash flow is $250 ($3k/yr) — positive.
- The deal already cash-flows at list — no discount required.
- Meets the 1% rule at list price ($1k rent vs $115k).
- Cap rate 8.9% vs local median 4.3% in Valdosta — top-decile yield for the area; either an underpriced asset or a hidden risk that comps aren't pricing in. Stress-test before assuming the spread holds.
Location & tenants
- Location reads 60/100 on livability (#392 in GA) — a middle-class / working-renter tenant base. Strengths: cost of living A+, health & safety A+, housing A-; Watch: schools F, crime F, amenities F.
- Valdosta City (urban): math 15% / reading 22% proficiency, ranked #149 of 174 in GA (top 86%) — low school quality limits family demand, transient renter base, plan for 1-2y turnover; 74% free/reduced lunch — lower-income household profile, screen leases tightly.
- Market conditions: Rents rising fast (+4.2%/yr); 267 active listings in the ZIP; 40 comparable units currently listed for rent nearby; rentals lingering (median 44d on market — plan ~5-8 weeks vacancy on turnover, expect pricing pressure); 70% of comp listings sitting > 30 days — soft ceiling on asking rent; 896 units permitted in Lowndes County in 2024 (0 in 5+ unit buildings).
Forward outlook
- Local home prices are declining (-3.0%/yr); year-one equity from $795 of loan paydown is wiped out by about $3k of value loss. Plan a longer hold.
- Lowndes County population projected at +10% by 2050 — modest demand growth; plan on rents tracking national, not racing it.
- At projected returns (-3.0% appreciation + 4.2% rent growth), your $32k cash investment doubles in ~10 years — after that, you're playing with house money.
Negotiation context
- Only 4 days on market — expect competitive offers; lowballing is unlikely to land.
- 2 sale attempts since 3y ago with the ask held roughly flat each time — persistent listings suggest the price (not the market) is what's stuck; bring a comps-based counter.
Risks & watch-outs
- Watch-outs: built in 1955 — expect roof / HVAC / electrical / plumbing capex.
- Climate carrying-cost: severe wind risk, 99% chance of damaging wind over 30y; extreme-heat days projected 7→19/yr by 2055 (HVAC capex compounding) — expect insurance premiums to compound above CPI over the hold.
Questions for the listing agent
- Built in 1955 — when were the roof, HVAC, electrical panel, plumbing, and water heater last replaced?
- Is there a deadline driving the sale (1031 exchange, divorce, estate, relocation)? That informs how much negotiation room exists.
- Schools are F-rated, which usually means shorter tenancies and higher turnover. Who's the typical renter profile here, and what's been the actual vacancy rate?
- Crime grade is F in this area — have there been break-ins, vandalism, or insurance claims at this property in the last 3 years? What carrier currently insures it and at what premium?
- What's the average days-on-market for RENTAL listings here right now (not sales)? A rising rental-DOM trend means longer vacancies and softer asking-rent achievability than the comps imply.
- What's the recent tenant-quality profile in this submarket — average credit score on applications, eviction rate, late-payment / NSF rate, and stable-employment percentage? A property-management company in the area should have these aggregated.
- How much new for-sale + rental construction is in the pipeline within 1–3 miles? Heavy new supply typically softens prices + rents 12–24 months out; constrained supply supports both.
Investment metrics
- 1% rule
- 1.05% ✓
- Cap rate
- 8.90%
- Cash-on-cash
- 9.32%
- DSCR
- 1.41
- GRM
- 7.9
CMA / ARV
- ARV (on-the-fly)
- $139,125
- Comps found
- 12
Show comp detail 12 sales within ~0.75 mi
| Address | Dist | Beds/Ba | Sqft | Sold | Price | $/sf | Match |
|---|---|---|---|---|---|---|---|
| 1713 N Lee St | 0.08mi | 3/2.0 | 1,309 (-1%) | 6mo | $60,000 | $46 | 87 |
| 1716 N Troup St | 0.20mi | 3/2.0 | 1,246 (-6%) | 5mo | $179,000 | $144 | 75 |
| 1803 N Lee St | 0.11mi | 4/2.0 (+1) | 1,241 (-6%) | 4mo | $71,500 | $58 | 74 |
| 2105 N Troup St | 0.52mi | 4/2.0 (+1) | 1,334 (+1%) | 1mo | $140,000 | $105 | 67 |
| 1803 Charlton St | 0.17mi | 3/2.0 | 1,170 (-12%) | 5mo | $93,000 | $79 | 66 |
| 2102 Melrose Dr | 0.55mi | 3/2.0 | 1,404 (+6%) | 3mo | $139,000 | $99 | 60 |
| 1016 N Troup St | 0.67mi | 3/1.0 | 1,353 (+2%) | 4mo | $22,000 | $16 | 60 |
| 1206 Lakeland Ave | 0.70mi | 3/2.0 | 1,296 (-2%) | 3mo | $145,000 | $112 | 59 |
| 950 Lakeside Dr | 0.67mi | 3/2.0 | 1,214 (-8%) | 5mo | $160,000 | $132 | 48 |
| 903 Pine Cone Cir | 0.72mi | 3/2.0 | 1,184 (-11%) | 3mo | $164,000 | $139 | 44 |
| 2206 Pin Oak Cir | 0.72mi | 4/2.0 (+1) | 1,512 (+14%) | 2mo | $202,000 | $134 | 34 |
| 957 Mcafina Trl | 0.66mi | 2/2.0 (-1) | 1,140 (-14%) | 7mo | $100,000 | $88 | 33 |
Match score weights: distance 35% · size 25% · config 20% · recency 20%. Top-matched comps best support the ARV.
Projected returns pro-forma
-3.0% appreciation · 4.19% rent growth · sell at horizon
- IRR
- -1.0%
- Equity multiple
- 0.96×
- Total profit
- $-1,274
- Equity at exit
- $17,147
- IRR
- 9.7%
- Equity multiple
- 1.79×
- Total profit
- $25,428
- Equity at exit
- $9,943
Cash invested: $32,200 (down + closing). Projections, not guarantees.
Landlord ↔ Tenant lean methodology
- Overall (STATE)
- 90 Strongly Landlord-Friendly
- State Georgia
- 90 Strongly Landlord-Friendly · R+3
- County
- — inherits STATE
- City
- — inherits STATE
ZIP-level market 31602
- Rents YoY
- 4.2%
- Active inventory
- 267
- Price-to-rent
- 7.9×
Monthly cashflow live
- Estimated rent
- $1,212 high interval (Pro) →
- Mortgage (P&I)
- −$603
- Tax from tax record
- −$56 /mo · $672/yr
- Insurance
- −$48
- HOA
- −$0
- Vacancy / Maint / Mgmt
- −$254
- Net cashflow
- $250
Break-even live
UW: 25.0% down · 7.5% · 30yr · 1.5% tax · 5.0% vac · 8.0% maint · 8.0% mgmt
Financing live
Cash to close
- Down payment
- $28,750
- Closing costs
- $3,450
- Reserves months
- —
- Total cash needed
- —
Loan-product check · same deal, 3 products live
Conventional
25% down · 7.5% · 30yr
- Down + closing
- —
- Monthly P&I
- —
- Monthly cashflow
- —
- DSCR
- —
- Eligible?
- —
Personal DTI + credit; lowest rate.
DSCR
20% down · 8.5% · 30yr
- Down + closing
- —
- Monthly P&I
- —
- Monthly cashflow
- —
- DSCR
- —
- Eligible?
- —
No personal income docs; deal must DSCR.
Hard money
10% down · 12.0% · 12mo
- Down + closing
- —
- Monthly P&I
- —
- Monthly cashflow
- —
- DSCR
- —
- Eligible?
- —
Short-term bridge; refi at stabilization.
Rent comps 40 comps
| Address | Beds | Baths | Sqft | Rent | $/sqft | DOM | Units | Dist |
|---|---|---|---|---|---|---|---|---|
| 1609 Marion St Unit B Valdosta, GA | 2.0 | 1.0 | 945 | $895 | $0.95 | 21d | 1 | 0.19mi |
| 713 Lakeland Ave Valdosta, GA | 2.0 | 1.0 | 1047 | $895 | $0.85 | 44d | 1 | 0.30mi |
| 304 E Cranford Ave Valdosta, GA | 2.0 | 1.0 | 980 | $850 | $0.87 | 44d | 1 | 0.31mi |
| 908 E Park Ave Valdosta, GA | 3.0 | 2.0 | 1612 | $1,650 | $1.02 | 21d | 1 | 0.41mi |
| 1503 E Park Ave Valdosta, GA | 1.0–3.0 | 1.0–2.0 | 890 | $1,260 | $1.42 | 44d | 54 | 0.47mi |
| 722 Vallotton Dr Valdosta, GA | 3.0 | 1.0 | 984 | $900 | $0.91 | 44d | 1 | 0.50mi |
| 2205 Bemiss Rd Valdosta, GA | 2.0 | 1.0 | 880 | $1,095 | $1.24 | 44d | 3 | 0.52mi |
| 1506 Slater St Unit 7 Valdosta, GA | 2.0 | 1.5 | 1037 | $695 | $0.67 | 44d | 1 | 0.53mi |
| 1005 Langdale Dr Unit B Valdosta, GA | 2.0 | 1.0 | 879 | $700 | $0.80 | 21d | 1 | 0.56mi |
| 1704 N Patterson St Unit 4 Valdosta, GA | 2.0 | 2.0 | 1100 | $950 | $0.86 | 44d | 1 | 0.58mi |
| 1425 E Park Ave Valdosta, GA | 1.0–2.0 | 1.0–2.0 | 917 | $1,095 | $1.19 | 21d | 2 | 0.62mi |
| 1109 Timber Line Dr Valdosta, GA | 3.0 | 2.0 | 1436 | $1,300 | $0.91 | 44d | 1 | 0.63mi |
| 743 E Brookwood Dr Valdosta, GA | 2.0 | 1.0 | 906 | $895 | $0.99 | 44d | 1 | 0.69mi |
| 803 Lausanne Dr Valdosta, GA | 3.0 | 1.0 | 994 | $1,095 | $1.10 | 44d | 1 | 0.69mi |
| 200 W Cranford Ave Valdosta, GA | 2.0 | 2.0 | 950 | $1,225 | $1.29 | 21d | 3 | 0.71mi |
| 611 Pineview Dr Valdosta, GA | 1.0–3.0 | 1.0–2.5 | 1204 | $1,600 | $1.33 | 21d | 3 | 0.79mi |
| 1616 E Moore St Apt 19 Valdosta, GA | 2.0 | 1.0 | 1029 | $825 | $0.80 | 44d | 1 | 0.83mi |
| 2305 Bemiss Rd Unit T16 Valdosta, GA | 2.0 | 1.5 | 896 | $850 | $0.95 | 44d | 1 | 0.87mi |
| 2324 Sterling Pl Valdosta, GA | 3.0 | 1.0 | 1124 | $1,095 | $0.97 | 21d | 1 | 0.94mi |
| 2437 University Dr Valdosta, GA | 3.0 | 1.0 | 879 | $1,175 | $1.34 | 44d | 1 | 0.97mi |
| 1632 Lexington Cir Valdosta, GA | 3.0 | 2.0 | 1104 | $1,395 | $1.26 | 44d | 1 | 1.02mi |
| 1010 N Toombs St Valdosta, GA | 2.0 | 1.5 | 1056 | $1,000 | $0.95 | 21d | 3 | 1.02mi |
| 1235 Ponderosa Dr Valdosta, GA | 3.0 | 2.0 | 1200 | $1,295 | $1.08 | 21d | 1 | 1.05mi |
| 1005 N Oak St Valdosta, GA | 3.0 | 1.0 | 1087 | $795 | $0.73 | 44d | 1 | 1.06mi |
| 1029 Johnson St Valdosta, GA | 2.0 | 1.0 | 986 | $900 | $0.91 | 44d | 1 | 1.08mi |
| 4 Lakeland Ct Valdosta, GA | 4.0 | 2.0 | 1350 | $1,250 | $0.93 | 21d | 1 | 1.15mi |
| 411 Northside Dr Unit G5 Valdosta, GA | 2.0 | 1.5 | 950 | $795 | $0.84 | 44d | 1 | 1.20mi |
| 411 Northside Dr Valdosta, GA | 2.0 | 2.0 | 950 | $795 | $0.84 | 44d | 1 | 1.20mi |
| 1612 Garland Pl Valdosta, GA | 3.0 | 2.0 | 1268 | $1,295 | $1.02 | 44d | 1 | 1.20mi |
| 2314 Pineview Dr Apt A Valdosta, GA | 2.0 | 1.0 | 940 | $900 | $0.96 | 44d | 1 | 1.21mi |
| 2859 Fawnwood Cir Valdosta, GA | 2.0 | 2.0 | 1173 | $1,400 | $1.19 | 21d | 1 | 1.25mi |
| 807 Cherokee Ave Unit A Valdosta, GA | 2.0 | 2.5 | 1200 | $2,000 | $1.67 | 44d | 1 | 1.25mi |
| 522 Green St Valdosta, GA | 2.0 | 1.0 | 1020 | $900 | $0.88 | 21d | 1 | 1.27mi |
| 413 Georgetown Cir Valdosta, GA | 2.0 | 2.0 | 1178 | $1,400 | $1.19 | 44d | 1 | 1.27mi |
| 2709 Pineview Dr Unit A Valdosta, GA | 2.0 | 2.5 | 1000 | $995 | $0.99 | 44d | 1 | 1.31mi |
| 1307 Baytree Dr Apt E Valdosta, GA | 3.0 | 2.0 | 1756 | $1,250 | $0.71 | 44d | 1 | 1.32mi |
| 2878 Fawnwood Cir Valdosta, GA | 3.0 | 2.0 | 1400 | $3,000 | $2.14 | 44d | 1 | 1.33mi |
| 2600 Deborah Dr Valdosta, GA | 3.0 | 1.0 | 1333 | $1,495 | $1.12 | 44d | 1 | 1.34mi |
| 1400 Baytree Dr Valdosta, GA | 2.0–4.0 | 2.0–4.0 | 1277 | $614 | $0.48 | 44d | 1 | 1.36mi |
| 1730 Forsyth Pl Unit B Valdosta, GA | 3.0 | 3.0 | 1280 | $1,395 | $1.09 | 44d | 1 | 1.36mi |
Listing history 5 events
-
2026-06-19days on market $115,000 Active 4 DOM
-
2026-06-18days on market $115,000 Active 3 DOM
-
2026-06-17days on market $115,000 Active 2 DOM
-
2026-06-15remarks 699-char remark
-
2026-06-15$115,000 Active 1 DOM
ⓘ Source: listings_history table (triggers on properties + properties_extension) + one-shot
backfill from property_details.listing_events for pre-trigger history.
Tax reassessment forecast GA · Resets to sale price
- Current annual tax
- $672 · $56/mo
- Projected year-2 tax
- $1,058 · $88/mo
- Expected delta
- +$386/yr (+$32/mo · 57.4%)
ⓘ Screening estimate from a state-policy table — verify with the county assessor before closing.
Climate risk First Street
- Flood 1/10 Low FEMA zone X (unshaded) · 0% chance over 30 yrs
- Wildfire 3/10 Moderate
- Heat 7/10 Severe 7 d/yr ≥108°F today · 19 d/yr by 30 yrs out
- Wind 9/10 Extreme 99% chance of damaging wind over 30 yrs
- Air quality 6/10 Major 10 unhealthy d/yr today · 11 by 30 yrs out
Nearby sold comps map
Loading sold comps map…
Walkable amenities ~0.75 mi
Loading nearby amenities…
Taxation est. · year 1
- Rental income
- $14,538
- − Mortgage interest
- −$6,442
- − Property taxes
- −$672
- − Insurance
- −$575
- − Repairs & maintenance
- −$1,163
- − Management
- −$1,163
- − Depreciation
- −$3,345
- Taxable income
- $1,178
- Est. tax owed @ 24.0%
- −$283
- After-tax cash flow
- $2,719/yr
For passive investors: Depreciation is non-cash, so a rental often shows a tax loss while cash-flowing — sheltering income. Rental losses are passive: they offset passive income freely, and up to $25,000/yr can offset ordinary (W-2) income if you actively participate and your MAGI is under $100k (phasing out to $0 by $150k); unused losses carry forward. On sale, claimed depreciation is recaptured at up to 25%, and gains may owe capital-gains tax (a 1031 exchange can defer both). Figures are a year-1 estimate at your 24.0% rate — not tax advice; consult a CPA.
Schools (NCES district)
- District
- Valdosta City
- NCES district ID
- 1305310
- Math proficiency
- 15% ▼ -12.00%
- Reading proficiency
- 22% ▼ -7.00%
- Median HH income
- $30,634
- Composite
- 14.79/100
- National rank
- #9388
- State rank
- #149 of 174 in GA
Livability — Valdosta
- Score
- 60/100
- State rank
- #392
- US rank
- #19544
Category grades
Schools grade is shown separately in the Schools card above.
Census & demographics
- Census place
- Valdosta, GA
- County
- Lowndes County · 107,801 people
- City population
- 91,859
- Metro
- Valdosta, GA
- Population (ZIP)
- 35,728
- Household income
- $56,939
- Rent vs Own
- Severe rent burden
- 2034.0
Population outlook (Lowndes County) Hauer SSP2
- Today (2025)
- 120,348 people
- By 2030
- 123,469 · +2.6%
- By 2040
- 128,482 · +6.8%
- By 2050
- 131,907 · +9.6%
- By 2075
- 139,080 · +15.6%
- By 2100
- 133,649 · +11.1%
Race, ethnicity, and origin ACS 2023
- Neighborhood character
- Diverse neighborhood (Simpson 0.61)
- Race & ethnicity
- White 45% Black 42% Hispanic / Latino 7% Two or more races 5% Asian 2%
- Hispanic origin (detail)
- Mexican 3% Puerto Rican 1%
- Common ancestry
- Italian 1% Slovak 1% Lithuanian 1%
- Foreign-born
- 4% · Canada
- Languages at home
- 94% English-only · Spanish 3% Other Indo-European 1% French/Haitian/Cajun 1%
Political lean MEDSL · Lowndes
- 2024 margin
- R (+18.0) · D 40.8% · R 58.8%
- 2008→2024 swing
- -8.6pp toward R · 2008: -9.4pp · 2024: -18.0pp
- All cycles
- 2024: R+18.0 2020: R+12.0 2016: R+18.2 2012: R+10.5 2008: R+9.4
Not yet ingested
- Civics
- —
Market trends
- HPI YoY
- ▼ -150.60%
- Current HPI
- 188.2012
- Rent YoY
- ▲ 4.19%
- Metro
- Valdosta, GA
- State GDP YoY
- ▲ 2.66%
- F500 in state
- 28
Industry mix (Fortune 500 HQ in GA)
| Industry | F500 HQs | Revenue |
|---|---|---|
| Paper / Packaging | 2 | $29B |
|
||
| Retail | 1 | $160B |
|
||
| Transportation / Logistics | 1 | $91B |
|
||
| Airlines | 1 | $62B |
|
||
| Consumer Goods | 1 | $47B |
|
||
| Utilities | 1 | $25B |
|
||
Price history
+310.7% since first listed6 events — show timeline
- 2026-06-15 Listed $115,000 SGMLS
- 2023-03-06 Sold (Public Records) $151,500 Public Records
- 2023-03-01 Sold (MLS) $50,500 SGMLS
- 2023-01-24 Listed $45,000 SGMLS
- 2004-09-27 Sold (Public Records) $48,000 Public Records
- 1991-05-10 Sold (Public Records) $28,000 Public Records
Property tax history
+1.2%/yrLatest (2025): $672 · +8.9% YoY. Source: county tax records.
Cash-flow waterfall
monthlySold comps — $/sqft
last 12 mo · ≤1 miLoading sold comps…