39669 Ormsby St · Mount Clemens, MI
Flood risk 3/10 · Minor
- FEMA flood zone
- X (unshaded)
- Chance of flooding over 30 yrs
- 0.2%
- Est. flood insurance / yr
- $473 – $860
Fire risk 1/10 · Minimal
- Est. fire insurance / yr
- $784 – $1,456
Heat risk 3/10 · Minor
- Hot days now (above 96°F)
- 7 days/yr
- Hot days in 30 yrs
- 15 days/yr
Wind risk 1/10 · Minimal
- Chance of severe wind over 30 yrs
- —
Air-quality risk 4/10 · Minor
- Unhealthy air days now
- 4 days/yr
- Unhealthy air days in 30 yrs
- 6 days/yr
Risk factors via First Street. Map © Google.
Why this score? — see what drove the B grade
The composite is a weighted blend of 9 inputs, each scored 0–100. Each bar is that input's sub-score; the figure is the points it added to the 100-point composite (weight × sub-score).
- Cash flow +30.0/30.0
- ARV discount +15.0/15.0
- DSCR +10.0/10.0
- 1% rule +8.9/10.0
- Livability +3.9/5.0
- Rent growth +3.3/5.0
- Condition / age +2.5/5.0
- Schools +0.6/10.0
- Appreciation +0.0/10.0
$99,000
🖨 Deal sheet (PDF) 📄 Offer letter ✓ Due diligence
Listing remarks MLS
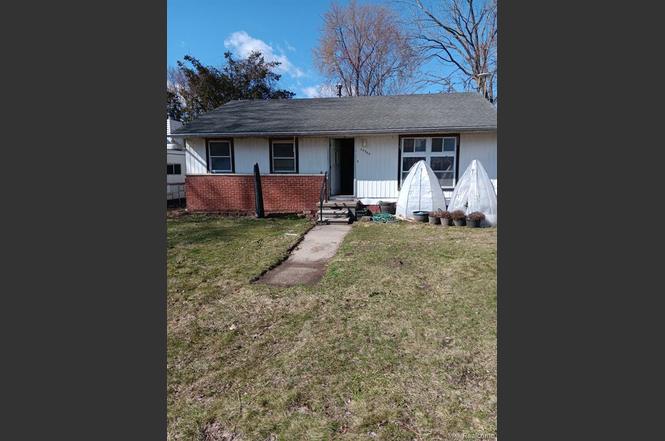
INVESTOR ALERT! Rare opportunity to snag a 3-bedroom ranch in Clinton Township with massive upside. This home is a basically complete blank canvas and requires a full rehab - perfect for your next fix-and-flip or BRRRR project. Featuring 1,073 sq. ft. , a solid crawl space foundation, and a deep 122' lot. Seller may entertain a short-term Land Contract with a strong down payment. Located in the Mount Clemens school district, just minutes from Metro Parkway. Sold as-is. Bring your contractor and your vision! BRRRR-Buy, Rehab, Rent, Refinance, Repeat Property sold as-is. All data, including room sizes and square footage, should be independently verified by the buyer and/or buyer's representative for accuracy. "
Key facts
- Deep lot
- 7,841 sq ft lot
- Built 1968
Tags
Neighborhood map
What this means for you Summary
Snapshot
- This is a 3-bed/1.0-bath single-family listed at $99k.
Deal economics
- At list price, monthly cash flow is $395 ($5k/yr) — positive.
- The deal already cash-flows at list — no discount required.
- Meets the 1% rule at list price ($1k rent vs $99k).
- Cap rate 11.1% vs local median 3.0% in Mount Clemens — top-decile yield for the area; either an underpriced asset or a hidden risk that comps aren't pricing in. Stress-test before assuming the spread holds.
Location & tenants
- Location reads 77/100 on livability (#120 in MI, #2,918 nationally) — a middle-class / working-renter tenant base. Strengths: commute A+, cost of living A+, housing A+; Watch: schools D+, crime D+, amenities D+.
- Mount Clemens Community School District (suburban): math 4% / reading 11% proficiency, ranked #532 of 540 in MI (top 98%) — low school quality limits family demand, transient renter base, plan for 1-2y turnover; 80% free/reduced lunch — lower-income household profile, screen leases tightly.
- Market conditions: Rents rising (+3.1%/yr); 117 active listings in the ZIP; 12 comparable units currently listed for rent nearby; rentals leasing fast (median 11d on market — plan ~1-2 weeks tenant-placement turnaround); 42% of comp listings sitting > 30 days — soft ceiling on asking rent; 1,321 units permitted in Macomb County in 2024 (86 in 5+ unit buildings).
Forward outlook
- Local home prices are declining (-3.0%/yr); year-one equity from $684 of loan paydown is wiped out by about $3k of value loss. Plan a longer hold.
- Macomb County population projected at +9% by 2050 — modest demand growth; plan on rents tracking national, not racing it.
- At projected returns (-3.0% appreciation + 3.1% rent growth), your $28k cash investment doubles in ~7 years — after that, you're playing with house money.
Negotiation context
- Only 8 days on market — expect competitive offers; lowballing is unlikely to land.
- 2 sale attempts with the ask held roughly flat each time — persistent listings suggest the price (not the market) is what's stuck; bring a comps-based counter.
- Current owner paid $78k; 27% above their basis — modest negotiation headroom, anchor on the comps not their cost.
Questions for the listing agent
- Built in 1968 — when were the roof, HVAC, electrical panel, plumbing, and water heater last replaced?
- Is there a deadline driving the sale (1031 exchange, divorce, estate, relocation)? That informs how much negotiation room exists.
- Schools are D-rated, which usually means shorter tenancies and higher turnover. Who's the typical renter profile here, and what's been the actual vacancy rate?
- Crime grade is D in this area — have there been break-ins, vandalism, or insurance claims at this property in the last 3 years? What carrier currently insures it and at what premium?
- What's the average days-on-market for RENTAL listings here right now (not sales)? A rising rental-DOM trend means longer vacancies and softer asking-rent achievability than the comps imply.
- What's the recent tenant-quality profile in this submarket — average credit score on applications, eviction rate, late-payment / NSF rate, and stable-employment percentage? A property-management company in the area should have these aggregated.
- How much new for-sale + rental construction is in the pipeline within 1–3 miles? Heavy new supply typically softens prices + rents 12–24 months out; constrained supply supports both.
Investment metrics
- 1% rule
- 1.39% ✓
- Cap rate
- 11.08%
- Cash-on-cash
- 17.10%
- DSCR
- 1.76
- GRM
- 6.0
CMA / ARV
- ARV (on-the-fly)
- $174,899
- Comps found
- 12
Show comp detail 12 sales within ~0.75 mi
| Address | Dist | Beds/Ba | Sqft | Sold | Price | $/sf | Match |
|---|---|---|---|---|---|---|---|
| 39669 Ormsby St | 0.00mi | 3/1.0 | 1,073 (0%) | 3mo | $78,000 | $73 | 98 |
| 39355 Charbeneau St | 0.10mi | 3/1.0 | 1,148 (+7%) | 10mo | $185,000 | $161 | 75 |
| 50 Michigan St | 0.46mi | 4/1.0 (+1) | 1,056 (-2%) | 6mo | $90,500 | $86 | 66 |
| 53 Eastman St | 0.26mi | 3/2.0 | 1,200 (+12%) | 1mo | $240,000 | $200 | 64 |
| 72 Gratiot Ave | 0.72mi | 3/1.0 | 1,045 (-3%) | 1mo | $169,900 | $163 | 61 |
| 79 Rathbone St | 0.22mi | 2/1.0 (-1) | 985 (-8%) | 14mo | $75,000 | $76 | 60 |
| 54 Gibbs St | 0.37mi | 3/1.0 | 1,000 (-7%) | 15mo | $185,000 | $185 | 59 |
| 38747 Harper Ave | 0.58mi | 3/1.0 | 1,003 (-6%) | 6mo | $165,000 | $165 | 57 |
| 184 Dickinson St | 0.24mi | 2/1.0 (-1) | 1,226 (+14%) | 4mo | $105,000 | $86 | 57 |
| 46 Michigan St | 0.47mi | 3/1.0 | 1,192 (+11%) | 9mo | $124,000 | $104 | 52 |
| 38815 Albert Blvd | 0.55mi | 3/1.5 | 1,189 (+11%) | 4mo | $225,000 | $189 | 51 |
| 38482 Riverside Dr | 0.74mi | 3/1.0 | 1,196 (+12%) | 6mo | $236,500 | $198 | 41 |
Match score weights: distance 35% · size 25% · config 20% · recency 20%. Top-matched comps best support the ARV.
Projected returns pro-forma
-3.0% appreciation · 3.12% rent growth · sell at horizon
- IRR
- 8.5%
- Equity multiple
- 1.34×
- Total profit
- $9,302
- Equity at exit
- $14,761
- IRR
- 17.9%
- Equity multiple
- 2.49×
- Total profit
- $41,272
- Equity at exit
- $8,560
Cash invested: $27,720 (down + closing). Projections, not guarantees.
Landlord ↔ Tenant lean methodology
- Overall (STATE)
- 62 Landlord-Friendly
- State Michigan
- 62 Landlord-Friendly · EVEN
- County
- — inherits STATE
- City
- — inherits STATE
ZIP-level market 48036
- Home prices YoY
- -29.2%
- Rents YoY
- 3.1%
- Active inventory
- 117
- Price-to-rent
- 6.0×
Monthly cashflow live
- Estimated rent
- $1,374 high interval (Pro) →
- Mortgage (P&I)
- −$519
- Tax from tax record
- −$130 /mo · $1,564/yr
- Insurance
- −$41
- HOA
- −$0
- Vacancy / Maint / Mgmt
- −$289
- Net cashflow
- $395
Break-even live
Sensitivity live
| Price | -10% $451 | -5% $423 | +0% $395 | +5% $367 | +10% $339 |
|---|---|---|---|---|---|
| Rent | -10% $286 | -5% $341 | +0% $395 | +5% $449 | +10% $503 |
| Rate | -1.0pp $445 | -0.5pp $420 | base $395 | +0.5pp $369 | +1.0pp $343 |
UW: 25.0% down · 7.5% · 30yr · 1.5% tax · 5.0% vac · 8.0% maint · 8.0% mgmt
Financing live
Cash to close
- Down payment
- $24,750
- Closing costs
- $2,970
- Reserves months
- —
- Total cash needed
- —
Loan-product check · same deal, 3 products live
Conventional
25% down · 7.5% · 30yr
- Down + closing
- —
- Monthly P&I
- —
- Monthly cashflow
- —
- DSCR
- —
- Eligible?
- —
Personal DTI + credit; lowest rate.
DSCR
20% down · 8.5% · 30yr
- Down + closing
- —
- Monthly P&I
- —
- Monthly cashflow
- —
- DSCR
- —
- Eligible?
- —
No personal income docs; deal must DSCR.
Hard money
10% down · 12.0% · 12mo
- Down + closing
- —
- Monthly P&I
- —
- Monthly cashflow
- —
- DSCR
- —
- Eligible?
- —
Short-term bridge; refi at stabilization.
Rent comps 12 comps
| Address | Beds | Baths | Sqft | Rent | $/sqft | DOM | Units | Dist |
|---|---|---|---|---|---|---|---|---|
| 104 Crocker Blvd Mt Clemens, MI | 2.0 | 1.0 | 854 | $1,250 | $1.46 | 6d | 1 | 0.46mi |
| 70 Crocker Blvd Mt Clemens, MI | 2.0 | 1.0 | 950 | $1,400 | $1.47 | 11d | 1 | 0.55mi |
| 64 Crocker Blvd Mt Clemens, MI | 2.0 | 1.0 | 950 | $1,250 | $1.32 | 44d | 1 | 0.55mi |
| 23128 Wellington Cres Clinton Twp, MI | 1.0–2.0 | 1.0 | 850 | $1,375 | $1.62 | 0d | 6 | 0.99mi |
| 121 Jones St Unit 2 Mt Clemens, MI | 2.0 | 1.0 | 1050 | $1,600 | $1.52 | 3d | 1 | 0.99mi |
| 121 Jones St Unit 1 Mt Clemens, MI | 2.0 | 1.0 | 1080 | $1,400 | $1.30 | 0d | 1 | 0.99mi |
| 38539 Wellington Dr #19 Clinton Twp, MI | 2.0 | 1.0 | 1092 | $1,400 | $1.28 | 44d | 1 | 1.06mi |
| 20 Lincoln St Unit 225 Mt Clemens, MI | 2.0 | 1.0 | 816 | $1,200 | $1.47 | 44d | 1 | 1.13mi |
| 15 Washington St Unit 2 Mt Clemens, MI | 3.0 | 1.0 | 1396 | $1,400 | $1.00 | 44d | 1 | 1.22mi |
| 24120 Denise Blvd Clinton Twp, MI | 1.0–2.0 | 1.0 | 800 | $940 | $1.18 | 44d | 1 | 1.24mi |
| 40 Ferrin Pl Mount Clemens, MI | 3.0 | 1.0 | 1400 | $1,700 | $1.21 | 0d | 1 | 1.24mi |
| 23560 Denton St Clinton Twp, MI | 1.0–2.0 | 1.0 | 650 | $1,100 | $1.69 | 4d | 1 | 1.46mi |
Listing history 7 events
-
2026-05-12status Pending
-
2026-03-31soldstatus $78,000
-
2026-03-21status Pending
Show marketing remark (724 chars)
INVESTOR ALERT! Rare opportunity to snag a 3-bedroom ranch in Clinton Township with massive upside. This home is a basically complete blank canvas and requires a full rehab - perfect for your next fix-and-flip or BRRRR project. Featuring 1,073 sq. ft. , a solid crawl space foundation, and a deep 122' lot. Seller may entertain a short-term Land Contract with a strong down payment. Located in the Mount Clemens school district, just minutes from Metro Parkway. Sold as-is. Bring your contractor and your vision! BRRRR-Buy, Rehab, Rent, Refinance, Repeat Property sold as-is. All data, including room sizes and square footage, should be independently verified by the buyer and/or buyer's representative for accuracy. "
-
2026-03-21status Pending 724-char remark
Show marketing remark (724 chars)
INVESTOR ALERT! Rare opportunity to snag a 3-bedroom ranch in Clinton Township with massive upside. This home is a basically complete blank canvas and requires a full rehab - perfect for your next fix-and-flip or BRRRR project. Featuring 1,073 sq. ft. , a solid crawl space foundation, and a deep 122' lot. Seller may entertain a short-term Land Contract with a strong down payment. Located in the Mount Clemens school district, just minutes from Metro Parkway. Sold as-is. Bring your contractor and your vision! BRRRR-Buy, Rehab, Rent, Refinance, Repeat Property sold as-is. All data, including room sizes and square footage, should be independently verified by the buyer and/or buyer's representative for accuracy. "
-
2026-03-20historical
-
2026-03-13$99,000 Active
Show marketing remark (724 chars)
INVESTOR ALERT! Rare opportunity to snag a 3-bedroom ranch in Clinton Township with massive upside. This home is a basically complete blank canvas and requires a full rehab - perfect for your next fix-and-flip or BRRRR project. Featuring 1,073 sq. ft. , a solid crawl space foundation, and a deep 122' lot. Seller may entertain a short-term Land Contract with a strong down payment. Located in the Mount Clemens school district, just minutes from Metro Parkway. Sold as-is. Bring your contractor and your vision! BRRRR-Buy, Rehab, Rent, Refinance, Repeat Property sold as-is. All data, including room sizes and square footage, should be independently verified by the buyer and/or buyer's representative for accuracy. "
-
2026-03-13$99,000 Active 724-char remark
Show marketing remark (724 chars)
INVESTOR ALERT! Rare opportunity to snag a 3-bedroom ranch in Clinton Township with massive upside. This home is a basically complete blank canvas and requires a full rehab - perfect for your next fix-and-flip or BRRRR project. Featuring 1,073 sq. ft. , a solid crawl space foundation, and a deep 122' lot. Seller may entertain a short-term Land Contract with a strong down payment. Located in the Mount Clemens school district, just minutes from Metro Parkway. Sold as-is. Bring your contractor and your vision! BRRRR-Buy, Rehab, Rent, Refinance, Repeat Property sold as-is. All data, including room sizes and square footage, should be independently verified by the buyer and/or buyer's representative for accuracy. "
ⓘ Source: listings_history table (triggers on properties + properties_extension) + one-shot
backfill from property_details.listing_events for pre-trigger history.
Tax reassessment forecast MI · Partial reset (capped growth)
- Current annual tax
- $1,564 · $130/mo
- Projected year-2 tax
- $1,564 · $130/mo
- Expected delta
- $0/yr ($0/mo · 0.0%)
ⓘ Screening estimate from a state-policy table — verify with the county assessor before closing.
Climate risk First Street
- Flood 3/10 Moderate FEMA zone X (unshaded) · 20% chance over 30 yrs
- Wildfire 1/10 Low
- Heat 3/10 Moderate 7 d/yr ≥96°F today · 15 d/yr by 30 yrs out
- Wind 1/10 Low
- Air quality 4/10 Moderate 4 unhealthy d/yr today · 6 by 30 yrs out
Nearby sold comps map
Loading sold comps map…
Walkable amenities ~0.75 mi
Loading nearby amenities…
Taxation est. · year 1
- Rental income
- $16,491
- − Mortgage interest
- −$5,546
- − Property taxes
- −$1,564
- − Insurance
- −$495
- − Repairs & maintenance
- −$1,319
- − Management
- −$1,319
- − Depreciation
- −$2,880
- Taxable income
- $3,368
- Est. tax owed @ 24.0%
- −$808
- After-tax cash flow
- $3,931/yr
For passive investors: Depreciation is non-cash, so a rental often shows a tax loss while cash-flowing — sheltering income. Rental losses are passive: they offset passive income freely, and up to $25,000/yr can offset ordinary (W-2) income if you actively participate and your MAGI is under $100k (phasing out to $0 by $150k); unused losses carry forward. On sale, claimed depreciation is recaptured at up to 25%, and gains may owe capital-gains tax (a 1031 exchange can defer both). Figures are a year-1 estimate at your 24.0% rate — not tax advice; consult a CPA.
Schools (NCES district)
- District
- Mount Clemens Community School District
- NCES district ID
- 2624690
- Math proficiency
- 4% ▼ -9.00%
- Reading proficiency
- 11% ▼ -7.00%
- Median HH income
- $36,632
- Composite
- 6.25/100
- National rank
- #10005
- State rank
- #532 of 540 in MI
Livability — Mount Clemens
- Score
- 77/100
- State rank
- #120
- US rank
- #2918
Category grades
Schools grade is shown separately in the Schools card above.
Census & demographics
- County
- Macomb County · 638,552 people
- City population
- 15,429
- Metro
- Detroit-Warren-Dearborn, MI
- Population (ZIP)
- 22,538
- Household income
- $70,071
- Rent vs Own
- Severe rent burden
- 514.0
Population outlook (Macomb County) Hauer SSP2
- Today (2025)
- 925,296 people
- By 2030
- 948,226 · +2.5%
- By 2040
- 983,961 · +6.3%
- By 2050
- 1,010,200 · +9.2%
- By 2075
- 1,076,222 · +16.3%
- By 2100
- 1,077,065 · +16.4%
Race, ethnicity, and origin ACS 2023
- Neighborhood character
- Predominantly White (65%)
- Race & ethnicity
- White 65% Black 21% Two or more races 8% Hispanic / Latino 5% Asian 3%
- Hispanic origin (detail)
- Mexican 3%
- Common ancestry
- Romanian 13% Lithuanian 3% English 2%
- Foreign-born
- 4% · Canada, China, Jamaica
- Languages at home
- 94% English-only · Spanish 3% Chinese 1% Other Indo-European 1%
Political lean MEDSL · Macomb
- 2024 margin
- R (+13.7) · D 42.2% · R 55.9% · Other 1.9%
- 2008→2024 swing
- -22.3pp toward R · 2008: 8.6pp · 2024: -13.7pp
- All cycles
- 2024: R+13.7 2020: R+8.1 2016: R+11.6 2012: D+4.0 2008: D+8.6
Not yet ingested
- Civics
- —
Market trends
- HPI YoY
- ▼ -111.99%
- Current HPI
- 270.9126
- Rent YoY
- ▲ 3.12%
- Metro
- Detroit-Warren-Dearborn, MI
- State GDP YoY
- ▲ 1.37%
- F500 in state
- 28
Industry mix (Fortune 500 HQ in MI)
| Industry | F500 HQs | Revenue |
|---|---|---|
| Automotive Parts | 3 | $48B |
|
||
| Automotive | 2 | $372B |
|
||
| Chemicals | 1 | $45B |
|
||
| Automotive Retail | 1 | $29B |
|
||
| Healthcare / Medical Devices | 1 | $23B |
|
||
| Automotive Technology | 1 | $20B |
|
||
Price history
-21.2% since first listed7 events — show timeline
- 2026-05-12 Pending — REALCOMP
- 2026-03-31 Sold (Public Records) $78,000 Public Records
- 2026-03-21 Pending — REALCOMP
- 2026-03-21 Pending — MiRealSource-MiMLS
- 2026-03-20 Listing Removed — REALCOMP
- 2026-03-13 Listed $99,000 MiRealSource-MiMLS
- 2026-03-13 Listed $99,000 REALCOMP
Property tax history
-3.3%/yrLatest (2025): $1,564 · +0.7% YoY. Source: county tax records.
Cash-flow waterfall
monthlySold comps — $/sqft
last 12 mo · ≤1 miLoading sold comps…