 🏗️ New Construction
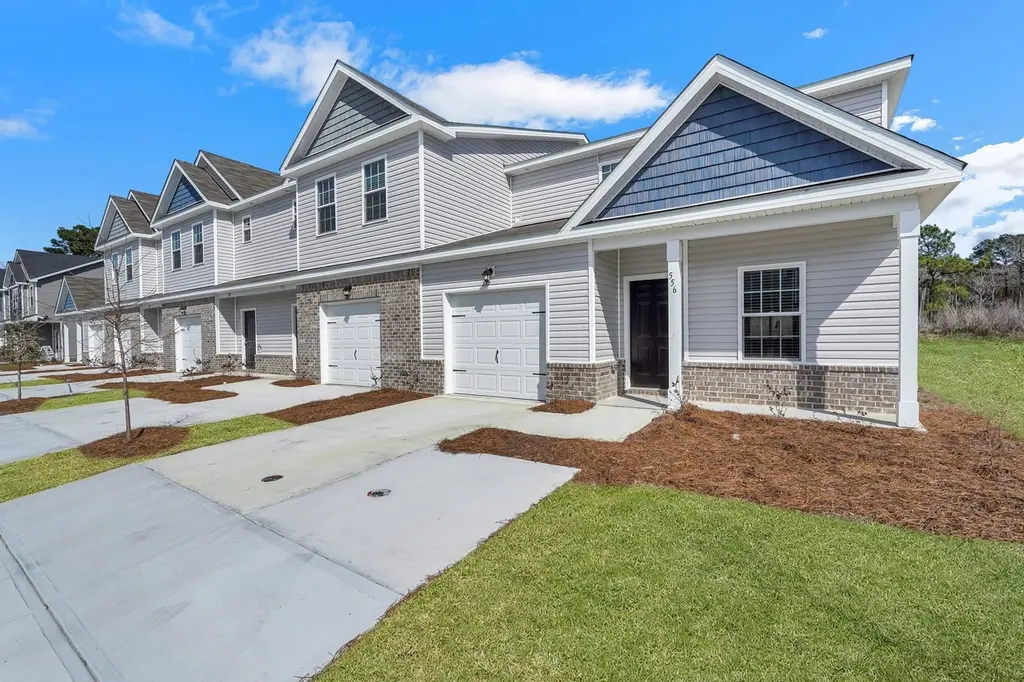
Andros Plan · Pooler, GA
Flood risk 4/10 · Minor
- FEMA flood zone
- A
- Chance of flooding over 30 yrs
- 0.2%
- Est. flood insurance / yr
- $1,009 – $1,996
Fire risk 3/10 · Minor
- Est. fire insurance / yr
- $963 – $1,789
Heat risk 9/10 · Severe
- Hot days now (above 108°F)
- 7 days/yr
- Hot days in 30 yrs
- 18 days/yr
Wind risk 8/10 · Major
- Chance of severe wind over 30 yrs
- 97.0%
Air-quality risk 5/10 · Moderate
- Unhealthy air days now
- 7 days/yr
- Unhealthy air days in 30 yrs
- 8 days/yr
Risk factors via First Street. Map © Google.
Why this score? — see what drove the F grade
The composite is a weighted blend of 9 inputs, each scored 0–100. Each bar is that input's sub-score; the figure is the points it added to the 100-point composite (weight × sub-score).
- Cash flow +8.1/30.0
- ARV discount +7.5/15.0
- Condition / age +5.0/5.0
- Livability +3.3/5.0
- 1% rule +3.2/10.0
- DSCR +2.2/10.0
- Schools +2.0/10.0
- Rent growth +1.7/5.0
- Appreciation +0.0/10.0
$1
🖨 Deal sheet 📄 Offer letter ✓ Due diligence
Listing remarks MLS
$162 Per Sq. Ft. Move-in-Ready New Construction Townhomes Available in Towne Park Pooler! Beacon New Homes Presents the Andros Plan conveniently located close to a variety of shopping, Dining, I-95, and I-16! This SPACIOUS End Unit Features 3 Bedrooms, 2.5 Baths with a Bonus Room on the second floor! The Master Suite is located on the main floor with a large walk-in-closet, double vanities, and a SECOND washer and dryer hook up in the walk in closet! First floor has an open concept with luxury vinyl plank flooring. The kitchen showcases Stainless-Steel Appliances Including a Refrigerator, Microwave, Stove, and a Dishwasher. Granite Counter Tops! Single Car Garage.
Key facts
- Granite counter tops
- End unit features
- $130 HOA
Tags
Neighborhood map
What this means for you Summary
Snapshot
- This is a 3-bed/2.5-bath townhouse listed at $1. Condition is rated excellent.
Deal economics
- At list price, monthly cash flow is $-380 ($-5k/yr) — negative.
- The deal already cash-flows at list — no discount required.
- Meets the 1% rule at list price ($2k rent vs $1).
- Cap rate 5.1% vs local median 4.0% in Pooler — meaningfully above typical; check what's discounted (condition, days-on-market, listing class) to confirm the premium yield is real.
Location & tenants
- Location reads 66/100 on livability (#182 in GA) — a middle-class / working-renter tenant base. Strengths: housing A+, crime A-, employment A-; Watch: schools D+, amenities F, commute F.
- Savannah-Chatham County (urban): math 20% / reading 26% proficiency, ranked #134 of 174 in GA (top 77%) — low school quality limits family demand, transient renter base, plan for 1-2y turnover.
- Market conditions: Rents falling (-3.4%/yr); 424 active listings in the ZIP; 22 comparable units currently listed for rent nearby; rentals at typical pace (median 24d on market — plan ~3-4 weeks tenant-placement turnaround); solid renter incomes; 2,694 units permitted in Chatham County in 2024 (973 in 5+ unit buildings).
Forward outlook
- Local home prices are declining (-3.0%/yr); year-one equity from $2k of loan paydown is wiped out by about $8k of value loss. Plan a longer hold.
- Chatham County population projected at +33% by 2050 — long-run rental-demand tailwind backs the buy-and-hold thesis.
Negotiation context
- It's been on market 749 days — a 12% lower offer ($0) is reasonable based on typical stale-listing flexibility.
Risks & watch-outs
- Watch-outs: property tax is 397882.4% of price; flood insurance adds $125/mo.
- Climate carrying-cost: in FEMA flood zone A (mandatory federal flood insurance); severe wind risk, 97% chance of damaging wind over 30y; extreme-heat days projected 7→18/yr by 2055 (HVAC capex compounding) — expect insurance premiums to compound above CPI over the hold.
Questions for the listing agent
- What do current leases actually rent for vs. the listed asking? Can we see a recent rent roll and the last 12 months of T-12 income?
- It's been on market 749 days. Have you received any prior offers? Is the seller open to a 5% concession, seller financing, or rate buy-down credit?
- Property tax is high relative to price — has the assessment been appealed recently, and will the sale trigger a re-assessment?
- What's the actual annual flood-insurance premium (NFIP or private), and is the property in a SFHA with mandatory coverage?
- What does the HOA fee cover, when was the last increase, and are there any pending special assessments or reserve-fund shortfalls?
- Why hasn't it sold? Are there any deal-killer items the seller is aware of (foundation, flood, title, zoning, code violations)?
- Is there a deadline driving the sale (1031 exchange, divorce, estate, relocation)? That informs how much negotiation room exists.
- Schools are D-rated, which usually means shorter tenancies and higher turnover. Who's the typical renter profile here, and what's been the actual vacancy rate?
- The area grade is low — what's the realistic commute time and amenity access for the typical tenant pool here? Any planned neighborhood developments (good or bad) we should know about?
- What's the average days-on-market for RENTAL listings here right now (not sales)? A rising rental-DOM trend means longer vacancies and softer asking-rent achievability than the comps imply.
- What's the recent tenant-quality profile in this submarket — average credit score on applications, eviction rate, late-payment / NSF rate, and stable-employment percentage? A property-management company in the area should have these aggregated.
- How much new for-sale + rental construction is in the pipeline within 1–3 miles? Heavy new supply typically softens prices + rents 12–24 months out; constrained supply supports both.
Investment metrics
- 1% rule
- 0.82% ✗
- Cap rate
- 5.14%
- Cash-on-cash
- -4.12%
- DSCR
- 0.82
- GRM
- 10.2
CMA / ARV
- ARV (median comp)
- $265,255
- List price
- $1
- Delta
- -100.00%
- Verdict
- UNDERPRICED
- Comps
- 20 within 1.0 mi
Show comp detail 12 sales within ~0.75 mi
| Address | Dist | Beds/Ba | Sqft | Sold | Price | $/sf | Match |
|---|---|---|---|---|---|---|---|
| 459 Governor Treutlen Cir | 0.08mi | 3/2.5 | 1,933 (0%) | 3mo | $293,300 | $152 | 93 |
| 439 Governor Treutlen Cir | 0.11mi | 3/2.5 | 1,926 (-0%) | 2mo | $305,000 | $158 | 93 |
| 463 Governor Treutlen Cir | 0.08mi | 3/2.5 | 1,933 (0%) | 5mo | $293,300 | $152 | 92 |
| 449 Governor Treutlen Cir | 0.14mi | 3/2.5 | 1,933 (0%) | 2mo | $296,100 | $153 | 92 |
| 440 Governor Treutlen Cir | 0.12mi | 3/2.5 | 1,933 (0%) | 4mo | $293,300 | $152 | 91 |
| 576 Governor Treutlen Cir | 0.06mi | 3/2.5 | 1,992 (+3%) | 3mo | $265,000 | $133 | 90 |
| 460 Governor Treutlen Cir | 0.17mi | 3/2.5 | 1,933 (0%) | 5mo | $293,300 | $152 | 88 |
| 571 Governor Treutlen Cir | 0.08mi | 3/2.5 | 1,820 (-6%) | 5mo | $250,000 | $137 | 82 |
| 315 Governor Gwinnett Way | 0.08mi | 3/2.0 | 1,796 (-7%) | 2mo | $285,000 | $159 | 81 |
| 466 Governor Treutlen Cir | 0.18mi | 3/2.5 | 1,825 (-6%) | 3mo | $281,315 | $154 | 80 |
| 464 Governor Treutlen Cir | 0.18mi | 3/2.5 | 1,825 (-6%) | 5mo | $283,015 | $155 | 78 |
| 302 Governor Gwinnett Way | 0.05mi | 3/2.5 | 2,202 (+14%) | 2mo | $242,000 | $110 | 73 |
Match score weights: distance 35% · size 25% · config 20% · recency 20%. Top-matched comps best support the ARV.
Projected returns pro-forma
-3.0% appreciation · 0.0% rent growth · sell at horizon
- IRR
- -30.8%
- Equity multiple
- 0.01×
- Total profit
- $-73,337
- Equity at exit
- $39,550
- IRR
- -57.8%
- Equity multiple
- -0.60×
- Total profit
- $-118,752
- Equity at exit
- $22,934
Cash invested: $74,271 (down + closing). Projections, not guarantees.
Landlord ↔ Tenant lean methodology
- Overall (STATE)
- 90 Strongly Landlord-Friendly
- State Georgia
- 90 Strongly Landlord-Friendly · R+3
- County
- — inherits STATE
- City
- — inherits STATE
ZIP-level market 31322
- Home prices YoY
- -32.2%
- Rents YoY
- -3.4%
- Active inventory
- 424
Monthly cashflow live
- Estimated rent
- $2,162 high interval (Pro) →
- Mortgage (P&I)
- −$1,391
- Tax est. 1.5%
- −$332 /mo · $3,979/yr
- Insurance
- −$111
- Flood insurance flood zone
- −$125 /mo · $1,502/yr
- HOA
- −$130
- Vacancy / Maint / Mgmt
- −$454
- Net cashflow
- $-380
Break-even live
UW: 25.0% down · 7.5% · 30yr · 1.5% tax · 5.0% vac · 8.0% maint · 8.0% mgmt
Financing live
Cash to close
- Down payment
- $66,314
- Closing costs
- $7,958
- Reserves months
- —
- Total cash needed
- —
Loan-product check · same deal, 3 products live
Conventional
25% down · 7.5% · 30yr
- Down + closing
- —
- Monthly P&I
- —
- Monthly cashflow
- —
- DSCR
- —
- Eligible?
- —
Personal DTI + credit; lowest rate.
DSCR
20% down · 8.5% · 30yr
- Down + closing
- —
- Monthly P&I
- —
- Monthly cashflow
- —
- DSCR
- —
- Eligible?
- —
No personal income docs; deal must DSCR.
Hard money
10% down · 12.0% · 12mo
- Down + closing
- —
- Monthly P&I
- —
- Monthly cashflow
- —
- DSCR
- —
- Eligible?
- —
Short-term bridge; refi at stabilization.
Rent comps 22 comps
| Address | Beds | Baths | Sqft | Rent | $/sqft | DOM | Units | Dist |
|---|---|---|---|---|---|---|---|---|
| 573 Governor Treutlen Cir Pooler, GA | 3.0 | 2.5 | 1728 | $2,100 | $1.22 | 43d | 1 | 0.08mi |
| 461 Governor Treutlen Cir Pooler, GA | 3.0 | 2.5 | 1685 | $2,145 | $1.27 | 13d | 1 | 0.08mi |
| 337 Governor Gwinnett Way Pooler, GA | 3.0 | 2.0 | 1714 | $1,995 | $1.16 | 43d | 1 | 0.14mi |
| 464 Governor Treutlen Cir Pooler, GA | 3.0 | 2.5 | 1825 | $2,050 | $1.12 | 43d | 1 | 0.17mi |
| 500 Gov Treutlen Cir Pooler, GA | 3.0 | 2.5 | 1605 | $2,250 | $1.40 | 23d | 1 | 0.20mi |
| 313 Manden Rd Unit 1244797P Pooler, GA | 3.0 | 2.0 | 1496 | $5,585 | $3.73 | 43d | 1 | 0.50mi |
| 1224 Crawford Way Unit 1291585P Pooler, GA | 3.0 | 2.0 | 1539 | $2,140 | $1.39 | 13d | 1 | 0.74mi |
| 1105 S Rogers St Lot 507 Pooler, GA | 3.0 | 2.0 | 1800 | $1,900 | $1.06 | 13d | 1 | 0.83mi |
| 1105 S Rogers St Lot 619 Pooler, GA | 3.0 | 2.0 | 1568 | $1,825 | $1.16 | 13d | 1 | 0.87mi |
| 1105 S Rogers St Lot 445 Pooler, GA | 3.0 | 2.0 | 1568 | $1,875 | $1.20 | 23d | 1 | 0.87mi |
| 1105 S Rogers St Lot 310 Pooler, GA | 3.0 | 2.0 | 1440 | $1,635 | $1.14 | 23d | 1 | 0.87mi |
| 1105 S Rogers St Lot 547 Pooler, GA | 3.0 | 2.0 | 1960 | $2,110 | $1.08 | 23d | 1 | 0.87mi |
| 1105 S Rogers St Lot 543 Pooler, GA | 3.0 | 2.0 | 1792 | $2,035 | $1.14 | 23d | 1 | 0.87mi |
| 500 Fox Farm ST Pooler, GA | 1.0–3.0 | 1.0–2.0 | 1063 | $2,567 | $2.41 | 13d | 142 | 0.98mi |
| 217 Holly Ave Unit 1244795P Pooler, GA | 4.0 | 2.0 | 1743 | $3,201 | $1.84 | 13d | 1 | 1.05mi |
| 503 W Tietgen St Pooler, GA | 3.0 | 2.0 | 1464 | $2,200 | $1.50 | 23d | 1 | 1.09mi |
| 216 Pinecrest Pl Unit 1244792P Pooler, GA | 3.0 | 2.0 | 1539 | $2,674 | $1.74 | 13d | 1 | 1.14mi |
| 402 Symons St Unit 1244794P Pooler, GA | 3.0 | 2.0 | 1560 | $3,309 | $2.12 | 13d | 1 | 1.27mi |
| 2 Venice Pl Pooler, GA | 2.0–4.0 | 2.0–2.5 | 1514 | $2,399 | $1.58 | 13d | 12 | 1.38mi |
| 11 Ripple Way Pooler, GA | 3.0–4.0 | 2.0–3.5 | 1697 | $2,475 | $1.46 | 13d | 21 | 1.41mi |
| 3002 Benton Grv Pooler, GA | 1.0–2.0 | 1.0–2.0 | 1004 | $2,437 | $2.43 | 21d | 10 | 1.45mi |
| 16 Stoney Hill Rd Pooler, GA | 3.0 | 2.0 | 1665 | $2,150 | $1.29 | 43d | 1 | 1.48mi |
HOA detail
- Monthly dues
- $130 · $1,560/yr
- Likely covers
- pool
Listing history 17 events
-
2026-06-18days on market $1 Active 749 DOM
-
2026-06-17days on market $1 Active 748 DOM
-
2026-06-16days on market $1 Active 747 DOM
-
2026-06-15days on market $1 Active 746 DOM
-
2026-06-14days on market $1 Active 744 DOM
-
2026-06-13days on market $1 Active 743 DOM
-
2026-06-10days on market $1 Active 741 DOM
-
2026-06-09days on market $1 Active 740 DOM
-
2026-06-08days on market $1 Active 739 DOM
-
2026-06-07days on market $1 Active 738 DOM
-
2026-06-05days on market $1 Active 735 DOM
-
2026-06-03days on market $1 Active 734 DOM
-
2026-06-02days on market $1 Active 733 DOM
-
2026-06-01days on market $1 Active 732 DOM
-
2026-05-31days on market $1 Active 731 DOM
-
2026-05-30days on market $1 Active 730 DOM
-
2024-05-30$1 Active 672-char remark
Show marketing remark (672 chars)
$162 Per Sq. Ft. Move-in-Ready New Construction Townhomes Available in Towne Park Pooler! Beacon New Homes Presents the Andros Plan conveniently located close to a variety of shopping, Dining, I-95, and I-16! This SPACIOUS End Unit Features 3 Bedrooms, 2.5 Baths with a Bonus Room on the second floor! The Master Suite is located on the main floor with a large walk-in-closet, double vanities, and a SECOND washer and dryer hook up in the walk in closet! First floor has an open concept with luxury vinyl plank flooring. The kitchen showcases Stainless-Steel Appliances Including a Refrigerator, Microwave, Stove, and a Dishwasher. Granite Counter Tops! Single Car Garage.
ⓘ Source: listings_history table (triggers on properties + properties_extension) + one-shot
backfill from property_details.listing_events for pre-trigger history.
Climate risk First Street
- Flood 4/10 Moderate FEMA zone A · 20% chance over 30 yrs
- Wildfire 3/10 Moderate
- Heat 9/10 Extreme 7 d/yr ≥108°F today · 18 d/yr by 30 yrs out
- Wind 8/10 Severe 97% chance of damaging wind over 30 yrs
- Air quality 5/10 Major 7 unhealthy d/yr today · 8 by 30 yrs out
Nearby sold comps map
Loading sold comps map…
Walkable amenities ~0.75 mi
Loading nearby amenities…
Taxation est. · year 1
- Rental income
- $25,948
- − Mortgage interest
- −$14,858
- − Property taxes
- −$3,979
- − Insurance
- −$2,829
- − Repairs & maintenance
- −$2,076
- − Management
- −$2,076
- − HOA
- −$1,560
- − Depreciation
- −$7,717
- Taxable loss
- −$9,146
- Est. tax savings @ 24.0%
- +$2,195
- After-tax cash flow
- $-2,366/yr
For passive investors: Depreciation is non-cash, so a rental often shows a tax loss while cash-flowing — sheltering income. Rental losses are passive: they offset passive income freely, and up to $25,000/yr can offset ordinary (W-2) income if you actively participate and your MAGI is under $100k (phasing out to $0 by $150k); unused losses carry forward. On sale, claimed depreciation is recaptured at up to 25%, and gains may owe capital-gains tax (a 1031 exchange can defer both). Figures are a year-1 estimate at your 24.0% rate — not tax advice; consult a CPA.
Condition & rehab AI · 5 photos
This townhouse is in excellent condition with no visible repairs needed. It offers a modern kitchen, well-maintained exterior, and a clean interior. Potential value-adding updates include painting and landscaping improvements.
Value-add opportunities
- Both Painting interior walls — Fresh paint can enhance the home's curb appeal and interior aesthetics.
- Both Landscaping improvements — Enhanced landscaping can increase both resale and rental value.
- Both Add a smart home system — A smart home system can improve convenience and energy efficiency, attracting more buyers and renters.
Renovation cost estimate screening
Value-add ROI direction
- Both Painting interior walls — Fresh paint can enhance the home's curb appeal and interior aesthetics. ↑
- Both Landscaping improvements — Enhanced landscaping can increase both resale and rental value. ↑
- Both Add a smart home system — A smart home system can improve convenience and energy efficiency, attracting more buyers and renters. ↑
ⓘ Cost ranges are severity-bucket heuristics (US national rule-of-thumb). Get contractor quotes + a written scope before underwriting a rehab budget.
Schools (NCES district)
- District
- Savannah-Chatham County
- NCES district ID
- 1301020
- Math proficiency
- 20% ▼ -11.00%
- Reading proficiency
- 26% ▼ -5.00%
- Median HH income
- $47,443
- Composite
- 20.14/100
- National rank
- #8639
- State rank
- #134 of 174 in GA
Livability — Pooler
- Score
- 66/100
- State rank
- #182
- US rank
- #11364
Category grades
Schools grade is shown separately in the Schools card above.
Census & demographics
- Census place
- Pooler, GA
- County
- Chatham County · 271,602 people
- City population
- 30,145
- Metro
- Savannah, GA
- Population (ZIP)
- 30,145
- Household income
- $91,344
- Rent vs Own
- Severe rent burden
- 877.0
Population outlook (Chatham County) Hauer SSP2
- Today (2025)
- 332,584 people
- By 2030
- 355,508 · +6.9%
- By 2040
- 400,030 · +20.3%
- By 2050
- 443,019 · +33.2%
- By 2075
- 534,579 · +60.7%
- By 2100
- 583,863 · +75.6%
Race, ethnicity, and origin ACS 2023
- Neighborhood character
- Diverse neighborhood (Simpson 0.65)
- Race & ethnicity
- White 50% Black 31% Two or more races 9% Hispanic / Latino 7% Asian 2%
- Hispanic origin (detail)
- Mexican 1% Puerto Rican 2% Cuban 2%
- Common ancestry
- Romanian 1% Slovak 1% Italian 1%
- Foreign-born
- 13% · Canada, Jamaica, Vietnam
- Languages at home
- 86% English-only · Spanish 8% Other Indo-European 2% French/Haitian/Cajun 1%
Political lean MEDSL · Chatham
- 2024 margin
- D (+18.0) · D 58.6% · R 40.6%
- 2008→2024 swing
- +3.6pp toward D · 2008: 14.4pp · 2024: 18.0pp
- All cycles
- 2024: D+18.0 2020: D+18.8 2016: D+14.5 2012: D+12.0 2008: D+14.4
Not yet ingested
- Civics
- —
Market trends
- HPI YoY
- ▼ -116.17%
- Current HPI
- 244.2052
- Rent YoY
- ▼ -3.35%
- Metro
- Savannah, GA
- State GDP YoY
- ▲ 2.66%
- F500 in state
- 28
Industry mix (Fortune 500 HQ in GA)
| Industry | F500 HQs | Revenue |
|---|---|---|
| Paper / Packaging | 2 | $29B |
|
||
| Retail | 1 | $160B |
|
||
| Transportation / Logistics | 1 | $91B |
|
||
| Airlines | 1 | $62B |
|
||
| Consumer Goods | 1 | $47B |
|
||
| Utilities | 1 | $25B |
|
||
Cash-flow waterfall
monthlySold comps — $/sqft
last 12 mo · ≤1 miLoading sold comps…