 Duplex
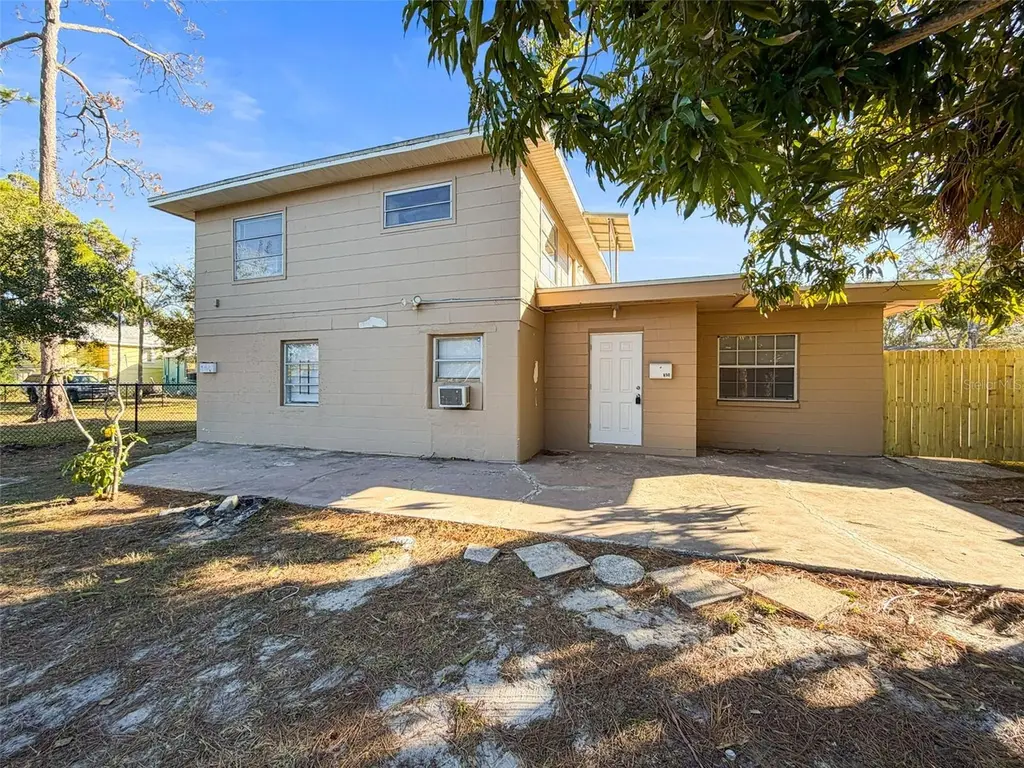
650 E Harbor Dr S · St. Petersburg, FL
Flood risk 10/10 · Severe
- FEMA flood zone
- AE
- Chance of flooding over 30 yrs
- 0.99%
- Est. flood insurance / yr
- $1,737 – $8,500
Fire risk 1/10 · Minimal
- Est. fire insurance / yr
- $947 – $1,759
Heat risk 10/10 · Severe
- Hot days now (above 106°F)
- 7 days/yr
- Hot days in 30 yrs
- 25 days/yr
Wind risk 10/10 · Severe
- Chance of severe wind over 30 yrs
- 99.0%
Air-quality risk 3/10 · Minor
- Unhealthy air days now
- 3 days/yr
- Unhealthy air days in 30 yrs
- 4 days/yr
Risk factors via First Street. Map © Google.
Why this score? — see what drove the B grade
The composite is a weighted blend of 9 inputs, each scored 0–100. Each bar is that input's sub-score; the figure is the points it added to the 100-point composite (weight × sub-score).
- Cash flow +27.0/30.0
- ARV discount +15.0/15.0
- DSCR +9.4/10.0
- 1% rule +7.4/10.0
- Schools +4.3/10.0
- Rent growth +2.5/5.0
- Livability +2.5/5.0
- Condition / age +2.5/5.0
- Appreciation +0.0/10.0
$285,000
🖨 Deal sheet 📄 Offer letter ✓ Due diligence
Multi-family units
County records classify this as Multi-Family (2-4 Unit). Listing-text estimate: 2 units. confirmed
Listing remarks MLS
Two unit dwelling, ready for quick sale. Located next to park, easy access to shopping, interstate, family friendly community.
Key facts
- 4,282 sq ft lot
- Built 1960
- Listed 73 days
Property features AI
Finance
- Other: Property used as residential income with 2 units; Unfurnished units
- Financial info: Gross income reported: $36,000; Annual net income reported: $24,783; Pro forma rents listed for unit types: one unit pro forma $1,600; the other unit pro forma $1,400
- HOA & community: No HOA
Exterior
- Parking: No specific parking details provided
- Security: No specific security features provided
- Utilities: Public water; Public sewer; Public utilities
- Home design: Duplex (residential income property); One building with two units; Two levels
- Construction: Block construction; Shingle and other roof materials; Slab foundation; Built area: approximately 1,999 total building area
- Exterior features: Patio; Fenced yard; Storage structure on property; Asphalt road access; Lot dimensions approximately 55 x 79 feet
Interior
- Kitchen: Range; Refrigerator
- Bedrooms: 4 bedrooms total; Two 2-bedroom units (one 2-bed/1-bath unit and another 2-bed/1-bath unit)
- Flooring: Tile flooring
- Bathrooms: Each unit includes 1 bathroom
- Heating & cooling: Ductless heating; Wall/window air conditioning units
- Interior features: Ceiling fans; Open floor plan; Window treatments (blinds)
- Laundry & utility: Common area laundry room; Washer and dryer included; Inside utility and storage rooms
Neighborhood map
What this means for you Summary
Snapshot
- This is a 2 × 2-bed/1.0-bath units multifamily listed at $285k.
Deal economics
- At list price, monthly cash flow is $374 ($4k/yr) — positive. Per door: $187/mo.
- The deal already cash-flows at list — no discount required.
- Meets the 1% rule at list price ($4k rent vs $285k).
- Recommended offer: $268k (6.0% below list) — sets the bar for market timing.
- Cap rate 9.7% vs local median 2.6% in St. Petersburg — top-decile yield for the area; either an underpriced asset or a hidden risk that comps aren't pricing in. Stress-test before assuming the spread holds.
Location & tenants
- Location reads: area grade B — affects rentability + tenant quality, not the cash-flow math above.
- Pinellas (suburban): math 51% / reading 51% proficiency, ranked #31 of 73 in FL (top 42%) — acceptable for families but not a draw, mixed tenant base, ~2y average lease.
- Market conditions: Rents soft (-0.1%/yr); 308 active listings in the ZIP; 33 comparable units currently listed for rent nearby; rentals leasing fast (median 4d on market — plan ~1-2 weeks tenant-placement turnaround); 2,676 units permitted in Pinellas County in 2024 (1,422 in 5+ unit buildings).
- At $3,547/mo this rent would consume 58% of the median local household income ($73k/yr) (locally 1386% of renters already pay >50% of income on rent) — very limited rent-growth headroom before tenants either downsize or default.
Forward outlook
- Local home prices are declining (-3.0%/yr); year-one equity from $2k of loan paydown is wiped out by about $9k of value loss. Plan a longer hold.
- Pinellas County population projected at +14% by 2050 — modest demand growth; plan on rents tracking national, not racing it.
Negotiation context
- It's been on market 73 days — a 6% lower offer ($268k) is reasonable based on typical stale-listing flexibility.
- 3 sale attempts since 10y ago; this cycle's ask has dropped $40k (12%) from the opening price — seller is motivated, your offer sets the floor, not the list.
- Current owner paid $95k; list at $285k implies a 200% gain — meaningful room to come down on a strong offer.
Risks & watch-outs
- Watch-outs: flood insurance adds $427/mo.
- Climate carrying-cost: in FEMA flood zone AE (mandatory federal flood insurance); severe wind risk, 99% chance of damaging wind over 30y; extreme-heat days projected 7→25/yr by 2055 (HVAC capex compounding) — expect insurance premiums to compound above CPI over the hold.
Questions for the listing agent
- It's been on market 73 days. Have you received any prior offers? Is the seller open to a 6% concession, seller financing, or rate buy-down credit?
- Can we see the unit-by-unit rent roll, current vacancy, and any below-market leases? What's the average tenancy length?
- What capital expenditures (roof, boiler, parking lot, exteriors) have been made in the last 5 years, and what's planned in the next 2?
- Built in 1960 — when were the roof, HVAC, electrical panel, plumbing, and water heater last replaced?
- What's the actual annual flood-insurance premium (NFIP or private), and is the property in a SFHA with mandatory coverage?
- Why hasn't it sold? Are there any deal-killer items the seller is aware of (foundation, flood, title, zoning, code violations)?
- Is there a deadline driving the sale (1031 exchange, divorce, estate, relocation)? That informs how much negotiation room exists.
- What's the average days-on-market for RENTAL listings here right now (not sales)? A rising rental-DOM trend means longer vacancies and softer asking-rent achievability than the comps imply.
- What's the recent tenant-quality profile in this submarket — average credit score on applications, eviction rate, late-payment / NSF rate, and stable-employment percentage? A property-management company in the area should have these aggregated.
- How much new apartment / multifamily construction is in the pipeline within 1–3 miles? Heavy new supply (>2% of stock underway) typically softens rents 12–24 months out; light construction supports rent growth.
Investment metrics
- 1% rule
- 1.24% ✓
- Cap rate
- 9.66%
- Cash-on-cash
- 12.04%
- DSCR
- 1.54
- GRM
- 6.7
CMA / ARV
- ARV (on-the-fly)
- $386,341
- Comps found
- 4
Show comp detail 4 sales within ~0.75 mi
| Address | Dist | Beds/Ba | Sqft | Sold | Price | $/sf | Match |
|---|---|---|---|---|---|---|---|
| 719 20th Ave S | 0.31mi | 4/4.0 | 1,854 (+1%) | 18mo | $291,500 | $157 | 60 |
| 801 18th Ave S | 0.46mi | 4/2.0 | 1,680 (-8%) | 8mo | $355,000 | $211 | 58 |
| 875 19th Ave S Unit 1/2 | 0.44mi | 5/3.0 (+1) | 2,046 (+12%) | 2mo | $335,000 | $164 | 49 |
| 877 36th Ave S | 0.73mi | 3/2.0 (-1) | 1,960 (+7%) | 22mo | $575,000 | $293 | 31 |
Match score weights: distance 35% · size 25% · config 20% · recency 20%. Top-matched comps best support the ARV.
Projected returns pro-forma
-3.0% appreciation · 0.0% rent growth · sell at horizon
- IRR
- -11.6%
- Equity multiple
- 0.59×
- Total profit
- $-32,408
- Equity at exit
- $42,494
- IRR
- -8.7%
- Equity multiple
- 0.54×
- Total profit
- $-36,340
- Equity at exit
- $24,642
Cash invested: $79,800 (down + closing). Projections, not guarantees.
Landlord ↔ Tenant lean methodology
- Overall (STATE)
- 87 Strongly Landlord-Friendly
- State Florida
- 87 Strongly Landlord-Friendly · R+3
- County
- — inherits STATE
- City
- — inherits STATE
ZIP-level market 33705
- Rents YoY
- -0.1%
- Active inventory
- 308
- Price-to-rent
- 13.4×
Monthly cashflow live
- Estimated rent
- $3,547 high interval (Pro) →
- Mortgage (P&I)
- −$1,495
- Tax from tax record
- −$388 /mo · $4,657/yr
- Insurance
- −$119
- Flood insurance flood zone
- −$427 /mo · $5,118/yr
- HOA
- −$0
- Vacancy / Maint / Mgmt
- −$745
- Net cashflow
- $374
Break-even live
2-unit breakdown (identical units grouped — click to expand)
| Units | Beds | Baths | Est. rent |
|---|---|---|---|
| 2× units | 2 | 1 | $3,546 |
| #1 | 2 | 1 | $1,773 |
| #2 | 2 | 1 | $1,773 |
| Total (2 units) | $3,547 | ||
UW: 25.0% down · 7.5% · 30yr · 1.5% tax · 5.0% vac · 8.0% maint · 8.0% mgmt
Financing live
Cash to close
- Down payment
- $71,250
- Closing costs
- $8,550
- Reserves months
- —
- Total cash needed
- —
Loan-product check · same deal, 3 products live
Conventional
25% down · 7.5% · 30yr
- Down + closing
- —
- Monthly P&I
- —
- Monthly cashflow
- —
- DSCR
- —
- Eligible?
- —
Personal DTI + credit; lowest rate.
DSCR
20% down · 8.5% · 30yr
- Down + closing
- —
- Monthly P&I
- —
- Monthly cashflow
- —
- DSCR
- —
- Eligible?
- —
No personal income docs; deal must DSCR.
Hard money
10% down · 12.0% · 12mo
- Down + closing
- —
- Monthly P&I
- —
- Monthly cashflow
- —
- DSCR
- —
- Eligible?
- —
Short-term bridge; refi at stabilization.
Rent comps 33 comps
| Address | Beds | Baths | Sqft | Rent | $/sqft | DOM | Units | Dist |
|---|---|---|---|---|---|---|---|---|
| 2329 7th St S Saint Petersburg, FL | 3.0 | 3.0 | 1894 | $2,150 | $1.14 | 17d | 1 | 0.09mi |
| 773 W Harbor Dr S Saint Petersburg, FL | 4.0 | 2.0 | 1495 | $2,800 | $1.87 | 24d | 1 | 0.13mi |
| 2825 6th St S Saint Petersburg, FL | 4.0 | 2.0 | 1235 | $2,590 | $2.10 | 4d | 1 | 0.24mi |
| 2720 Edwards Ave S Saint Petersburg, FL | 4.0 | 2.0 | 1298 | $2,300 | $1.77 | 4d | 1 | 0.28mi |
| 825 32nd Ave S Saint Petersburg, FL | 1.0–3.0 | 1.0–2.5 | 1518 | $3,840 | $2.53 | 2d | 17 | 0.39mi |
| 2950 Pallanza Dr S Saint Petersburg, FL | 3.0 | 3.0 | 2015 | $3,250 | $1.61 | 4d | 1 | 0.49mi |
| 2003 10th St S Saint Petersburg, FL | 4.0 | 2.0 | 1620 | $2,349 | $1.45 | 7d | 1 | 0.53mi |
| 675 16th Ave S Unit 1 St. Petersburg, FL | 4.0 | 2.0 | 1518 | $2,750 | $1.81 | 10d | 1 | 0.63mi |
| 935 17th Ave S Saint Petersburg, FL | 4.0 | 2.0 | 2448 | $3,195 | $1.31 | 4d | 1 | 0.63mi |
| 720 Newton Ave S Saint Petersburg, FL | 4.0 | 2.0 | 1320 | $2,500 | $1.89 | 7d | 1 | 0.70mi |
| 116 16th Ave SE Saint Petersburg, FL | 3.0 | 2.0 | 1468 | $3,200 | $2.18 | 24d | 1 | 0.79mi |
| 750 38th Ave S Saint Petersburg, FL | 3.0 | 1.0 | 1475 | $1,900 | $1.29 | 3d | 1 | 0.85mi |
| 1535 13th St S Saint Petersburg, FL | 4.0 | 2.0 | 1716 | $2,850 | $1.66 | 24d | 1 | 0.87mi |
| 1137 Highland St S Saint Petersburg, FL | 3.0 | 2.0 | 1400 | $2,600 | $1.86 | 2d | 1 | 0.90mi |
| 3876 Island Way Saint Petersburg, FL | 3.0 | 2.5 | 1345 | $2,500 | $1.86 | 17d | 1 | 0.93mi |
| 160 Coquina Bay Dr Saint Petersburg, FL | 3.0 | 2.5 | 1345 | $2,400 | $1.78 | 24d | 1 | 0.94mi |
| 3353 Coquina Key Dr SE Saint Petersburg, FL | 3.0 | 2.0 | 2240 | $4,800 | $2.14 | 4d | 1 | 0.95mi |
| 1218 13th Ave S Saint Petersburg, FL | 3.0 | 2.0 | 1356 | $2,594 | $1.91 | 4d | 1 | 0.99mi |
| 1465 15th St S Saint Petersburg, FL | 3.0 | 1.5 | 1405 | $2,400 | $1.71 | 4d | 1 | 0.99mi |
| 3560 Beach Dr SE Saint Petersburg, FL | 3.0 | 2.0 | 1388 | $3,500 | $2.52 | 4d | 1 | 1.04mi |
| 2524 19th St S Saint Petersburg, FL | 4.0 | 2.0 | 1230 | $2,495 | $2.03 | 24d | 1 | 1.04mi |
| 1317 14th St S St Petersburg, FL | 4.0 | 2.0 | 1236 | $2,150 | $1.74 | 24d | 1 | 1.06mi |
| 1349 15th St S Saint Petersburg, FL | 3.0 | 2.0 | 1702 | $2,700 | $1.59 | 24d | 1 | 1.06mi |
| 1911 22nd Ave S St Petersburg, FL | 4.0 | 2.0 | 1424 | $3,000 | $2.11 | 2d | 1 | 1.08mi |
| 1900 19th St S Saint Petersburg, FL | 4.0 | 1.0 | 1572 | $2,500 | $1.59 | 4d | 1 | 1.08mi |
| 1900 19th St S Saint Petersburg, FL | 4.0 | 1.0 | 2148 | $2,500 | $1.16 | 24d | 1 | 1.08mi |
| 2435 20th St S Unit 1 St. Petersburg, FL | 4.0 | 2.0 | 1230 | $2,650 | $2.15 | 24d | 1 | 1.13mi |
| 2033 20th St S Saint Petersburg, FL | 3.0 | 1.0 | 1752 | $1,775 | $1.01 | 4d | 1 | 1.15mi |
| 3601 Coquina Key Dr SE St Petersburg, FL | 3.0 | 2.5 | 1680 | $7,800 | $4.64 | 24d | 1 | 1.15mi |
| 2310 21st St S Saint Petersburg, FL | 5.0 | 3.0 | 1500 | $3,460 | $2.31 | 4d | 1 | 1.15mi |
| 1400 21st St S Saint Petersburg, FL | 4.0 | 2.0 | 1487 | $2,970 | $2.00 | 7d | 1 | 1.34mi |
| 2244 21st Ave S Saint Petersburg, FL | 3.0 | 1.0 | 1229 | $2,250 | $1.83 | 4d | 1 | 1.36mi |
| 218 Lewis Blvd SE Saint Petersburg, FL | 3.0 | 2.0 | 1300 | $2,300 | $1.77 | 4d | 1 | 1.39mi |
Listing history 23 events
-
2026-06-18days on market $285,000 Active 73 DOM
-
2026-06-17days on market $285,000 Active 72 DOM
-
2026-06-16days on market $285,000 Active 71 DOM
-
2026-06-15days on market $285,000 Active 70 DOM
-
2026-06-13days on market $285,000 Active 68 DOM
-
2026-06-09days on market $285,000 Active 64 DOM
-
2026-06-08days on market $285,000 Active 63 DOM
-
2026-06-07days on market $285,000 Active 62 DOM
-
2026-06-04days on market $285,000 Active 59 DOM
-
2026-06-03pricedays on market $285,000 Active 58 DOM
-
2026-06-01days on market $299,900 Active 56 DOM
-
2026-05-31days on market $299,900 Active 55 DOM
-
2026-04-30price $299,900
-
2026-04-06$325,000 Active
-
2026-03-26historical $1,500
-
2026-03-20price $1,500
-
2026-02-06$1,600
-
2017-03-24soldstatus $95,000
-
2017-03-23soldstatus $95,000 Sold 126-char remark
Show marketing remark (126 chars)
Two unit dwelling, ready for quick sale. Located next to park, easy access to shopping, interstate, family friendly community.
-
2017-01-12status Pending 126-char remark
Show marketing remark (126 chars)
Two unit dwelling, ready for quick sale. Located next to park, easy access to shopping, interstate, family friendly community.
-
2016-12-29$109,500 Active 126-char remark
Show marketing remark (126 chars)
Two unit dwelling, ready for quick sale. Located next to park, easy access to shopping, interstate, family friendly community.
-
1999-08-04soldstatus $38,000
-
1985-10-01soldstatus $39,000
ⓘ Source: listings_history table (triggers on properties + properties_extension) + one-shot
backfill from property_details.listing_events for pre-trigger history.
Tax reassessment forecast FL · Resets to sale price
- Current annual tax
- $4,657 · $388/mo
- Projected year-2 tax
- $4,657 · $388/mo
- Expected delta
- $0/yr ($0/mo · 0.0%)
ⓘ Screening estimate from a state-policy table — verify with the county assessor before closing.
Climate risk First Street
- Flood 10/10 Extreme FEMA zone AE · 99% chance over 30 yrs
- Wildfire 1/10 Low
- Heat 10/10 Extreme 7 d/yr ≥106°F today · 25 d/yr by 30 yrs out
- Wind 10/10 Extreme 99% chance of damaging wind over 30 yrs
- Air quality 3/10 Moderate 3 unhealthy d/yr today · 4 by 30 yrs out
Nearby sold comps map
Loading sold comps map…
Walkable amenities ~0.75 mi
Loading nearby amenities…
Taxation est. · year 1
- Rental income
- $42,564
- − Mortgage interest
- −$15,964
- − Property taxes
- −$4,657
- − Insurance
- −$6,544
- − Repairs & maintenance
- −$3,405
- − Management
- −$3,405
- − Depreciation
- −$8,291
- Taxable income
- $298
- Est. tax owed @ 24.0%
- −$72
- After-tax cash flow
- $4,419/yr
For passive investors: Depreciation is non-cash, so a rental often shows a tax loss while cash-flowing — sheltering income. Rental losses are passive: they offset passive income freely, and up to $25,000/yr can offset ordinary (W-2) income if you actively participate and your MAGI is under $100k (phasing out to $0 by $150k); unused losses carry forward. On sale, claimed depreciation is recaptured at up to 25%, and gains may owe capital-gains tax (a 1031 exchange can defer both). Figures are a year-1 estimate at your 24.0% rate — not tax advice; consult a CPA.
Schools (NCES district)
- District
- Pinellas
- NCES district ID
- 1201560
- Math proficiency
- 51% ▼ -5.00%
- Reading proficiency
- 51% ▼ -3.00%
- Median HH income
- $46,270
- Composite
- 43.27/100
- National rank
- #3046
- State rank
- #31 of 73 in FL
Livability — St. Petersburg
No livability data for this city. (Only ~50 U.S. cities are tracked.)
Census & demographics
- Census place
- St. Petersburg, FL
- County
- Pinellas County · 939,478 people
- City population
- 249,151
- Metro
- Tampa-St. Petersburg-Clearwater, FL
- Population (ZIP)
- 27,939
- Household income
- $73,027
- Rent vs Own
- Severe rent burden
- 1386.0
Population outlook (Pinellas County) Hauer SSP2
- Today (2025)
- 1,027,532 people
- By 2030
- 1,063,586 · +3.5%
- By 2040
- 1,125,020 · +9.5%
- By 2050
- 1,168,637 · +13.7%
- By 2075
- 1,265,188 · +23.1%
- By 2100
- 1,260,357 · +22.7%
Race, ethnicity, and origin ACS 2023
- Neighborhood character
- Diverse neighborhood (Simpson 0.64)
- Race & ethnicity
- Black 44% White 41% Two or more races 10% Hispanic / Latino 5%
- Hispanic origin (detail)
- Puerto Rican 1%
- Common ancestry
- Lithuanian 2% Italian 1% Slovak 1%
- Foreign-born
- 9% · Canada, Dominican Republic
- Languages at home
- 92% English-only · Spanish 4% Other Indo-European 1% Russian/Polish/Slavic 1%
Political lean MEDSL · Pinellas
- 2024 margin
- Lean R (+5.2) · D 46.9% · R 52.1%
- 2008→2024 swing
- -13.5pp toward R · 2008: 8.3pp · 2024: -5.2pp
- All cycles
- 2024: R+5.2 2020: D+0.2 2016: R+1.1 2012: D+5.6 2008: D+8.3
Not yet ingested
- Civics
- —
Market trends
- HPI YoY
- ▼ -540.28%
- Current HPI
- 388.3086
- Rent YoY
- ▼ -0.13%
- Metro
- Tampa-St. Petersburg-Clearwater, FL
- State GDP YoY
- ▲ 3.28%
- F500 in state
- 36
Industry mix (Fortune 500 HQ in FL)
| Industry | F500 HQs | Revenue |
|---|---|---|
| Industrial Technology | 2 | $29B |
|
||
| Insurance | 2 | $17B |
|
||
| Retail | 1 | $60B |
|
||
| Technology Distribution | 1 | $58B |
|
||
| Homebuilding | 1 | $35B |
|
||
| Technology Manufacturing | 1 | $35B |
|
||
Price history
+669.0% since first listed11 events — show timeline
- 2026-04-30 Price Changed $299,900 Stellar MLS as Distributed by MLS Grid
- 2026-04-06 Listed $325,000 Stellar MLS as Distributed by MLS Grid
- 2026-03-26 Rental Removed $1,500 RentEngineListings
- 2026-03-20 Price Changed $1,500 RentEngineListings
- 2026-02-06 Listed for Rent $1,600 RentEngineListings
- 2017-03-24 Sold (Public Records) $95,000 Public Records
- 2017-03-23 Sold (MLS) $95,000 Stellar MLS as Distributed by MLS Grid
- 2017-01-12 Pending — Stellar MLS as Distributed by MLS Grid
- 2016-12-29 Listed $109,500 Stellar MLS as Distributed by MLS Grid
- 1999-08-04 Sold (Public Records) $38,000 Public Records
- 1985-10-01 Sold (Public Records) $39,000 Public Records
Property tax history
+16.3%/yrLatest (2025): $4,657 · +12.0% YoY. Source: county tax records.
Cash-flow waterfall
monthlySold comps — $/sqft
last 12 mo · ≤1 miLoading sold comps…