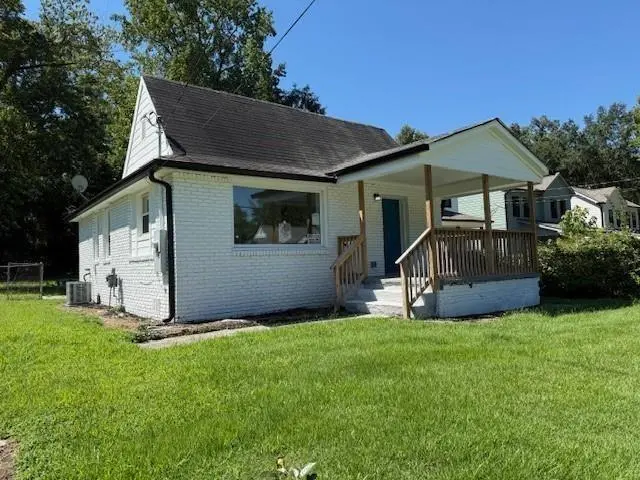
2040 Chicago Ave NW · Atlanta, GA
Flood risk 1/10 · Minimal
- FEMA flood zone
- X (unshaded)
- Chance of flooding over 30 yrs
- 0.0%
- Est. flood insurance / yr
- $473 – $860
Fire risk 1/10 · Minimal
- Est. fire insurance / yr
- $963 – $1,789
Heat risk 6/10 · Moderate
- Hot days now (above 103°F)
- 7 days/yr
- Hot days in 30 yrs
- 18 days/yr
Wind risk 6/10 · Moderate
- Chance of severe wind over 30 yrs
- 27.0%
Air-quality risk 4/10 · Minor
- Unhealthy air days now
- 3 days/yr
- Unhealthy air days in 30 yrs
- 5 days/yr
Risk factors via First Street. Map © Google.
Why this score? — see what drove the D+ grade
The composite is a weighted blend of 9 inputs, each scored 0–100. Each bar is that input's sub-score; the figure is the points it added to the 100-point composite (weight × sub-score).
- ARV discount +15.0/15.0
- Cash flow +14.3/30.0
- DSCR +4.3/10.0
- Livability +4.2/5.0
- 1% rule +3.6/10.0
- Rent growth +3.1/5.0
- Schools +2.7/10.0
- Condition / age +2.5/5.0
- Appreciation +0.0/10.0
$219,900
🖨 Deal sheet 📄 Offer letter ✓ Due diligence
Listing remarks MLS
TOTAL RENOVATION.....NOW INCLUDING A $3,000 APPLIANCE ALLOWANCE. Sharp renovation priced far below the new construction homes next door and in this vibrant growing neighborhood. Luxury vinyl flooring throughout. Totally redesigned bathrooms feature walk-in stall showers with beautiful tile work. The kitchen features a full wall of white cabinetry and offers plenty of storage. ALL NEW HWH AND HVAC. Enjoy the original fireplace in the open concept floor plan. The large picture window and high ceilings in the living area helps to flood the house with natural light. Nice level backyard with plenty of room for children and pets to play.
Key facts
- Plenty of storage
- Redesigned bathrooms
- Original fireplace
Tags
Neighborhood map
What this means for you Summary
Snapshot
- This is a 3-bed/1.0-bath single-family listed at $220k.
Deal economics
- At list price, monthly cash flow is $40 ($480/yr) — positive.
- The deal already cash-flows at list — no discount required.
- To meet the 1% rule (rent ≥ 1% of price), the offer needs to be $190k (13.8% below list).
- Recommended offer: $190k (13.8% below list) — sets the bar for 1% rule.
- Cap rate 6.5% vs local median 3.1% in Atlanta — top-decile yield for the area; either an underpriced asset or a hidden risk that comps aren't pricing in. Stress-test before assuming the spread holds.
Location & tenants
- Location reads 83/100 on livability (#6 in GA, #919 nationally) — a professional / high-income tenant draw. Strengths: amenities A+, commute A+, housing A+; Watch: schools C-, cost of living C-.
- Atlanta Public Schools (urban): math 28% / reading 35% proficiency, ranked #80 of 174 in GA (top 46%) — families likely to look elsewhere, expect single-tenant / working-renter base with shorter leases; 71% free/reduced lunch — lower-income household profile, screen leases tightly.
- Market conditions: Rents rising (+2.5%/yr); 293 active listings in the ZIP; 40 comparable units currently listed for rent nearby; rentals at typical pace (median 25d on market — plan ~3-4 weeks tenant-placement turnaround); lower-income renter base — watch delinquency; 11,565 units permitted in Fulton County in 2024 (8,159 in 5+ unit buildings).
- At $1,896/mo this rent would consume 54% of the median local household income ($42k/yr) (locally 1293% of renters already pay >50% of income on rent) — very limited rent-growth headroom before tenants either downsize or default.
Forward outlook
- Local home prices are declining (-3.0%/yr); year-one equity from $2k of loan paydown is wiped out by about $7k of value loss. Plan a longer hold.
- Fulton County population projected at +38% by 2050 — long-run rental-demand tailwind backs the buy-and-hold thesis.
Negotiation context
- It's been on market 134 days — a 12% lower offer ($194k) is reasonable based on typical stale-listing flexibility.
- 6 sale attempts since 2y ago with the ask held roughly flat each time — persistent listings suggest the price (not the market) is what's stuck; bring a comps-based counter.
- Current owner paid $120k; list at $220k implies a 83% gain — meaningful room to come down on a strong offer.
Risks & watch-outs
- Watch-outs: built in 1951 — expect roof / HVAC / electrical / plumbing capex.
- Climate carrying-cost: major wind risk, 27% chance of damaging wind over 30y; extreme-heat days projected 7→18/yr by 2055 (HVAC capex compounding) — expect insurance premiums to compound above CPI over the hold.
Questions for the listing agent
- It's been on market 134 days. Have you received any prior offers? Is the seller open to a 14% concession, seller financing, or rate buy-down credit?
- Built in 1951 — when were the roof, HVAC, electrical panel, plumbing, and water heater last replaced?
- Why hasn't it sold? Are there any deal-killer items the seller is aware of (foundation, flood, title, zoning, code violations)?
- Is there a deadline driving the sale (1031 exchange, divorce, estate, relocation)? That informs how much negotiation room exists.
- The area grade is low — what's the realistic commute time and amenity access for the typical tenant pool here? Any planned neighborhood developments (good or bad) we should know about?
- What's the average days-on-market for RENTAL listings here right now (not sales)? A rising rental-DOM trend means longer vacancies and softer asking-rent achievability than the comps imply.
- What's the recent tenant-quality profile in this submarket — average credit score on applications, eviction rate, late-payment / NSF rate, and stable-employment percentage? A property-management company in the area should have these aggregated.
- How much new for-sale + rental construction is in the pipeline within 1–3 miles? Heavy new supply typically softens prices + rents 12–24 months out; constrained supply supports both.
Investment metrics
- 1% rule
- 0.86% ✗
- Cap rate
- 6.51%
- Cash-on-cash
- 0.78%
- DSCR
- 1.03
- GRM
- 9.7
CMA / ARV
- ARV (median comp)
- $270,229
- List price
- $219,900
- Delta
- -18.62%
- Verdict
- UNDERPRICED
- Comps
- 20 within 1.0 mi
Show comp detail 12 sales within ~0.75 mi
| Address | Dist | Beds/Ba | Sqft | Sold | Price | $/sf | Match |
|---|---|---|---|---|---|---|---|
| 2074 Morehouse Dr | 0.24mi | 3/2.0 | 1,559 (+4%) | 0mo | $320,000 | $205 | 77 |
| 2022 Detroit Ave NW | 0.17mi | 3/2.0 | 1,369 (-8%) | 1mo | $235,900 | $172 | 73 |
| 360 New Jersey Ave | 0.13mi | 4/3.0 (+1) | 1,430 (-4%) | 2mo | $238,500 | $167 | 72 |
| 2066 Bethel Dr NW | 0.17mi | 3/1.0 | 1,624 (+9%) | 9mo | $53,000 | $33 | 70 |
| 1827 North Ave NW | 0.52mi | 3/1.5 | 1,520 (+2%) | 3mo | $167,000 | $110 | 69 |
| 1824 Tiger Flowers Dr NW | 0.54mi | 3/2.0 | 1,400 (-6%) | 4mo | $309,000 | $221 | 57 |
| 688 S Eugenia Pl NW | 0.66mi | 3/2.0 | 1,526 (+2%) | 7mo | $85,000 | $56 | 56 |
| 20 S Eugenia Pl NW | 0.70mi | 3/2.0 | 1,416 (-5%) | 6mo | $280,000 | $198 | 50 |
| 2191 Tiger Flowers Dr NW | 0.37mi | 3/2.0 | 1,286 (-14%) | 8mo | $156,188 | $121 | 48 |
| 1938 Maywood Pl NW | 0.55mi | 4/2.0 (+1) | 1,596 (+7%) | 8mo | $287,000 | $180 | 48 |
| 1708 Detroit Ave NW | 0.55mi | 4/1.5 (+1) | 1,282 (-14%) | 6mo | $170,000 | $133 | 38 |
| 793 Ayrshire Cir NW | 0.64mi | 4/2.0 (+1) | 1,710 (+14%) | 0mo | $299,900 | $175 | 37 |
Match score weights: distance 35% · size 25% · config 20% · recency 20%. Top-matched comps best support the ARV.
Projected returns pro-forma
-3.0% appreciation · 2.53% rent growth · sell at horizon
- IRR
- -15.6%
- Equity multiple
- 0.45×
- Total profit
- $-33,986
- Equity at exit
- $32,788
- IRR
- -7.9%
- Equity multiple
- 0.51×
- Total profit
- $-29,978
- Equity at exit
- $19,013
Cash invested: $61,572 (down + closing). Projections, not guarantees.
Landlord ↔ Tenant lean methodology
- Overall (STATE)
- 90 Strongly Landlord-Friendly
- State Georgia
- 90 Strongly Landlord-Friendly · R+3
- County
- — inherits STATE
- City
- — inherits STATE
ZIP-level market 30314
- Home prices YoY
- -22.9%
- Rents YoY
- 2.5%
- Active inventory
- 293
- Price-to-rent
- 9.7×
Monthly cashflow live
- Estimated rent
- $1,896 high interval (Pro) →
- Mortgage (P&I)
- −$1,153
- Tax from tax record
- −$213 /mo · $2,553/yr
- Insurance
- −$92
- HOA
- −$0
- Vacancy / Maint / Mgmt
- −$398
- Net cashflow
- $40
Break-even live
UW: 25.0% down · 7.5% · 30yr · 1.5% tax · 5.0% vac · 8.0% maint · 8.0% mgmt
Financing live
Cash to close
- Down payment
- $54,975
- Closing costs
- $6,597
- Reserves months
- —
- Total cash needed
- —
Loan-product check · same deal, 3 products live
Conventional
25% down · 7.5% · 30yr
- Down + closing
- —
- Monthly P&I
- —
- Monthly cashflow
- —
- DSCR
- —
- Eligible?
- —
Personal DTI + credit; lowest rate.
DSCR
20% down · 8.5% · 30yr
- Down + closing
- —
- Monthly P&I
- —
- Monthly cashflow
- —
- DSCR
- —
- Eligible?
- —
No personal income docs; deal must DSCR.
Hard money
10% down · 12.0% · 12mo
- Down + closing
- —
- Monthly P&I
- —
- Monthly cashflow
- —
- DSCR
- —
- Eligible?
- —
Short-term bridge; refi at stabilization.
Rent comps 40 comps
| Address | Beds | Baths | Sqft | Rent | $/sqft | DOM | Units | Dist |
|---|---|---|---|---|---|---|---|---|
| 308 Anderson Ave NW Unit A Atlanta, GA | 4.0 | 3.0 | 1250 | $2,200 | $1.76 | 24d | 1 | 0.14mi |
| 1916 Joseph E. Boone Blvd NW Unit A Atlanta, GA | 3.0 | 1.0 | 1100 | $1,550 | $1.41 | 21d | 1 | 0.23mi |
| 1916 Joseph E. Boone Blvd NW Unit B Atlanta, GA | 2.0 | 1.0 | 1000 | $1,195 | $1.20 | 24d | 1 | 0.23mi |
| 1948 Detroit Ave NW Unit A Atlanta, GA | 3.0 | 2.5 | 1205 | $1,900 | $1.58 | 24d | 1 | 0.27mi |
| 2199 Tiger Flowers Dr NW Atlanta, GA | 3.0 | 1.0 | 936 | $1,325 | $1.42 | 24d | 1 | 0.38mi |
| 511 Emily Pl NW Atlanta, GA | 3.0 | 1.0 | 1101 | $1,745 | $1.58 | 24d | 1 | 0.39mi |
| 1894 North Ave NW Atlanta, GA | 2.0 | 1.5 | 1098 | $1,995 | $1.82 | 24d | 1 | 0.39mi |
| 273 Wadley St NW Atlanta, GA | 3.0 | 2.0 | 1406 | $1,990 | $1.42 | 24d | 1 | 0.41mi |
| 2060 Baker Rd NW Atlanta, GA | 2.0 | 2.0 | 1436 | $2,100 | $1.46 | 4d | 1 | 0.41mi |
| 1770 Springview Rd NW Atlanta, GA | 3.0 | 2.0 | 1262 | $2,000 | $1.58 | 24d | 1 | 0.57mi |
| 562 Gary Rd NW Atlanta, GA | 4.0 | 2.0 | 1700 | $2,400 | $1.41 | 24d | 1 | 0.62mi |
| 195 W Lake Ave NW Unit 1 Atlanta, GA | 3.0 | 2.0 | 1245 | $2,654 | $2.13 | 24d | 1 | 0.67mi |
| 390 W Lake Ave NW Apt A1 Atlanta, GA | 3.0 | 1.5 | 1256 | $1,299 | $1.03 | 24d | 1 | 0.67mi |
| 390 W Lake Ave NW Unit A10 Atlanta, GA | 3.0 | 1.5 | 1256 | $1,275 | $1.02 | 24d | 1 | 0.67mi |
| 390 W Lake Ave NW Unit B9 Atlanta, GA | 2.0 | 1.5 | 1256 | $1,275 | $1.02 | 24d | 1 | 0.67mi |
| 24 S Eugenia Pl NW Atlanta, GA | 4.0 | 2.5 | 1410 | $1,725 | $1.22 | 24d | 1 | 0.71mi |
| 714 Emily Pl NW Atlanta, GA | 3.0 | 2.0 | 1492 | $2,700 | $1.81 | 3d | 1 | 0.73mi |
| 2705 Lincoln Ct NW Atlanta, GA | 3.0 | 2.0 | 1134 | $2,050 | $1.81 | 18d | 1 | 0.75mi |
| 1839 Penelope Rd NW Atlanta, GA | 3.0 | 1.0 | 988 | $1,400 | $1.42 | 24d | 1 | 0.78mi |
| 1595 Carlisle St NW Unit 1 Atlanta, GA | 2.0 | 1.0 | 900 | $1,200 | $1.33 | 24d | 1 | 0.82mi |
| 687 S Evelyn Pl NW Atlanta, GA | 3.0 | 2.5 | 1200 | $1,978 | $1.65 | 21d | 1 | 0.84mi |
| 557 W Lake Ave NW Atlanta, GA | 1.0–3.0 | 1.0–2.0 | 1190 | $1,556 | $1.31 | 5d | 9 | 0.85mi |
| 2364 Cross St NW Atlanta, GA | 3.0 | 1.0 | 1168 | $1,500 | $1.28 | 17d | 1 | 0.86mi |
| 556 Church St NW Atlanta, GA | 2.0 | 2.0 | 1432 | $2,200 | $1.54 | 8d | 1 | 0.87mi |
| 0 W Lake Ave NW Atlanta, GA | 3.0 | 2.5 | 1300 | $1,900 | $1.46 | 2d | 1 | 0.88mi |
| 280 Holly Rd NW Unit B Atlanta, GA | 2.0 | 2.0 | 1100 | $1,650 | $1.50 | 24d | 1 | 0.93mi |
| 2662 Hood Ave NW Atlanta, GA | 3.0 | 2.0 | 1450 | $2,000 | $1.38 | 24d | 1 | 0.96mi |
| 725 Matilda Pl NW Atlanta, GA | 2.0 | 1.0 | 1225 | $1,450 | $1.18 | 24d | 1 | 0.98mi |
| 427 Holly St NW Atlanta, GA | 2.0 | 2.0 | 900 | $2,100 | $2.33 | 24d | 1 | 0.98mi |
| 66 Holly Rd NW Atlanta, GA | 3.0 | 2.5 | 1632 | $2,228 | $1.37 | 2d | 1 | 1.03mi |
| 2227 Telhurst St SW Atlanta, GA | 2.0 | 2.0 | 928 | $1,395 | $1.50 | 14d | 1 | 1.04mi |
| 2227 Telhurst St SW Atlanta, GA | 2.0 | 2.0 | 928 | $1,395 | $1.50 | 4d | 1 | 1.04mi |
| 2423 M.L.K. Jr Dr SW Atlanta, GA | 1.0–3.0 | 1.0–2.0 | 1120 | $1,750 | $1.56 | 2d | 19 | 1.04mi |
| 636 Francis Pl NW Unit A Atlanta, GA | 2.0 | 2.0 | 1380 | $1,800 | $1.30 | 24d | 1 | 1.07mi |
| 2111 Martin Luther King Junior Dr NW Atlanta, GA | 3.0 | 1.0 | 1470 | $1,800 | $1.22 | 24d | 1 | 1.07mi |
| 717 Church St NW Atlanta, GA | 4.0 | 2.0 | 1328 | $2,000 | $1.51 | 24d | 1 | 1.07mi |
| 1448 Rome Dr NW Unit 1448 Atlanta, GA | 3.0 | 2.5 | 1400 | $2,300 | $1.64 | 13d | 1 | 1.08mi |
| 751 Prince Pl NW Atlanta, GA | 4.0 | 2.0 | 1785 | $2,200 | $1.23 | 24d | 1 | 1.09mi |
| 2507 Dale Creek Dr NW Atlanta, GA | 3.0 | 1.0 | 1795 | $1,900 | $1.06 | 24d | 1 | 1.09mi |
| 753 Prince Pl NW Atlanta, GA | 4.0 | 2.0 | 1785 | $2,200 | $1.23 | 24d | 1 | 1.09mi |
Listing history 31 events
-
2026-06-18days on market $219,900 Active 134 DOM
-
2026-06-17days on market $219,900 Active 133 DOM
-
2026-06-16days on market $219,900 Active 132 DOM
-
2026-06-15days on market $219,900 Active 131 DOM
-
2026-06-13days on market $219,900 Active 129 DOM
-
2026-06-13days on market $219,900 Active 128 DOM
-
2026-06-09days on market $219,900 Active 125 DOM
-
2026-06-08days on market $219,900 Active 124 DOM
-
2026-06-07days on market $219,900 Active 123 DOM
-
2026-06-04days on market $219,900 Active 120 DOM
-
2026-06-03days on market $219,900 Active 119 DOM
-
2026-06-02days on market $219,900 Active 118 DOM
-
2026-06-01days on market $219,900 Active 117 DOM
-
2026-05-31days on market $219,900 Active 116 DOM
-
2026-05-08price $219,900 649-char remark
Show marketing remark (649 chars)
TOTAL RENOVATION.....NOW INCLUDING A $3,000 APPLIANCE ALLOWANCE. Sharp renovation priced far below the new construction homes next door and in this vibrant growing neighborhood. Luxury vinyl flooring throughout. Totally redesigned bathrooms feature walk-in stall showers with beautiful tile work. The kitchen features a full wall of white cabinetry and offers plenty of storage. ALL NEW HWH AND HVAC. Enjoy the original fireplace in the open concept floor plan. The large picture window and high ceilings in the living area helps to flood the house with natural light. Nice level backyard with plenty of room for children and pets to play.
-
2026-02-04$229,900 New 649-char remark
Show marketing remark (649 chars)
TOTAL RENOVATION.....NOW INCLUDING A $3,000 APPLIANCE ALLOWANCE. Sharp renovation priced far below the new construction homes next door and in this vibrant growing neighborhood. Luxury vinyl flooring throughout. Totally redesigned bathrooms feature walk-in stall showers with beautiful tile work. The kitchen features a full wall of white cabinetry and offers plenty of storage. ALL NEW HWH AND HVAC. Enjoy the original fireplace in the open concept floor plan. The large picture window and high ceilings in the living area helps to flood the house with natural light. Nice level backyard with plenty of room for children and pets to play.
-
2026-02-04$229,900 Active 649-char remark
Show marketing remark (649 chars)
TOTAL RENOVATION.....NOW INCLUDING A $3,000 APPLIANCE ALLOWANCE. Sharp renovation priced far below the new construction homes next door and in this vibrant growing neighborhood. Luxury vinyl flooring throughout. Totally redesigned bathrooms feature walk-in stall showers with beautiful tile work. The kitchen features a full wall of white cabinetry and offers plenty of storage. ALL NEW HWH AND HVAC. Enjoy the original fireplace in the open concept floor plan. The large picture window and high ceilings in the living area helps to flood the house with natural light. Nice level backyard with plenty of room for children and pets to play.
-
2026-01-31historical
-
2025-11-07$234,900 New
-
2025-10-31historical
-
2025-10-31historical
-
2025-10-02price $239,900
-
2025-10-02price $239,900
-
2025-07-30price $259,900
-
2025-05-05$269,900 Active
-
2025-05-05$269,900 New
-
2024-11-02historical
-
2024-10-11price $280,000
-
2024-09-13$320,000 Active
-
2023-03-01soldstatus $120,000
ⓘ Source: listings_history table (triggers on properties + properties_extension) + one-shot
backfill from property_details.listing_events for pre-trigger history.
Tax reassessment forecast GA · Resets to sale price
- Current annual tax
- $2,553 · $213/mo
- Projected year-2 tax
- $2,553 · $213/mo
- Expected delta
- $0/yr ($0/mo · 0.0%)
ⓘ Screening estimate from a state-policy table — verify with the county assessor before closing.
Climate risk First Street
- Flood 1/10 Low FEMA zone X (unshaded) · 0% chance over 30 yrs
- Wildfire 1/10 Low
- Heat 6/10 Major 7 d/yr ≥103°F today · 18 d/yr by 30 yrs out
- Wind 6/10 Major 27% chance of damaging wind over 30 yrs
- Air quality 4/10 Moderate 3 unhealthy d/yr today · 5 by 30 yrs out
Nearby sold comps map
Loading sold comps map…
Walkable amenities ~0.75 mi
Loading nearby amenities…
Taxation est. · year 1
- Rental income
- $22,748
- − Mortgage interest
- −$12,318
- − Property taxes
- −$2,553
- − Insurance
- −$1,100
- − Repairs & maintenance
- −$1,820
- − Management
- −$1,820
- − Depreciation
- −$6,397
- Taxable loss
- −$3,259
- Est. tax savings @ 24.0%
- +$782
- After-tax cash flow
- $1,262/yr
For passive investors: Depreciation is non-cash, so a rental often shows a tax loss while cash-flowing — sheltering income. Rental losses are passive: they offset passive income freely, and up to $25,000/yr can offset ordinary (W-2) income if you actively participate and your MAGI is under $100k (phasing out to $0 by $150k); unused losses carry forward. On sale, claimed depreciation is recaptured at up to 25%, and gains may owe capital-gains tax (a 1031 exchange can defer both). Figures are a year-1 estimate at your 24.0% rate — not tax advice; consult a CPA.
Schools (NCES district)
- District
- Atlanta Public Schools
- NCES district ID
- 1300120
- Math proficiency
- 28% ▼ -6.00%
- Reading proficiency
- 35% ▼ -2.00%
- Median HH income
- $48,306
- Composite
- 27.27/100
- National rank
- #7006
- State rank
- #80 of 174 in GA
Livability — Atlanta
- Score
- 83/100
- State rank
- #6
- US rank
- #919
Category grades
Schools grade is shown separately in the Schools card above.
Census & demographics
- Census place
- Atlanta, GA
- County
- Fulton County · 1,094,430 people
- City population
- 629,525
- Metro
- Atlanta-Sandy Springs-Alpharetta, GA
- Population (ZIP)
- 23,333
- Household income
- $42,089
- Rent vs Own
- Severe rent burden
- 1293.0
Population outlook (Fulton County) Hauer SSP2
- Today (2025)
- 1,203,707 people
- By 2030
- 1,299,706 · +8.0%
- By 2040
- 1,488,256 · +23.6%
- By 2050
- 1,664,580 · +38.3%
- By 2075
- 2,036,072 · +69.2%
- By 2100
- 2,222,402 · +84.6%
Race, ethnicity, and origin ACS 2023
- Neighborhood character
- Predominantly Black (76%)
- Race & ethnicity
- Black 76% White 11% Hispanic / Latino 7% Asian 4% Two or more races 3%
- Hispanic origin (detail)
- Mexican 4% Dominican 1%
- Common ancestry
- Lithuanian 1%
- Foreign-born
- 6% · Canada, China, South Korea
- Languages at home
- 89% English-only · Spanish 5% Other Indo-European 1% Chinese 1%
Political lean MEDSL · Fulton
- 2024 margin
- Solid D (+44.9) · D 71.9% · R 27.0% · Other 1.1%
- 2008→2024 swing
- +9.8pp toward D · 2008: 35.0pp · 2024: 44.9pp
- All cycles
- 2024: D+44.9 2020: D+46.4 2016: D+42.1 2012: D+29.6 2008: D+35.0
Not yet ingested
- Civics
- —
Market trends
- HPI YoY
- ▼ -95.32%
- Current HPI
- 321.4626
- Rent YoY
- ▲ 2.53%
- Metro
- Atlanta-Sandy Springs-Alpharetta, GA
- State GDP YoY
- ▲ 2.66%
- F500 in state
- 28
Industry mix (Fortune 500 HQ in GA)
| Industry | F500 HQs | Revenue |
|---|---|---|
| Paper / Packaging | 2 | $29B |
|
||
| Retail | 1 | $160B |
|
||
| Transportation / Logistics | 1 | $91B |
|
||
| Airlines | 1 | $62B |
|
||
| Consumer Goods | 1 | $47B |
|
||
| Utilities | 1 | $25B |
|
||
Price history
+83.2% since first listed17 events — show timeline
- 2026-05-08 Price Changed $219,900 GAMLS
- 2026-05-08 Price Changed $219,900 FMLS
- 2026-02-04 Listed $229,900 FMLS
- 2026-02-04 Listed $229,900 GAMLS
- 2026-01-31 Listing Removed — GAMLS
- 2025-11-07 Listed $234,900 GAMLS
- 2025-10-31 Listing Removed — GAMLS
- 2025-10-31 Listing Removed — FMLS
- 2025-10-02 Price Changed $239,900 GAMLS
- 2025-10-02 Price Changed $239,900 FMLS
- 2025-07-30 Price Changed $259,900 FMLS
- 2025-05-05 Listed $269,900 GAMLS
- 2025-05-05 Listed $269,900 FMLS
- 2024-11-02 Listing Removed — FMLS
- 2024-10-11 Price Changed $280,000 FMLS
- 2024-09-13 Listed $320,000 FMLS
- 2023-03-01 Sold (Public Records) $120,000 Public Records
Property tax history
+33.7%/yrLatest (2025): $2,553 · -2.0% YoY. Source: county tax records.
Cash-flow waterfall
monthlySold comps — $/sqft
last 12 mo · ≤1 miLoading sold comps…