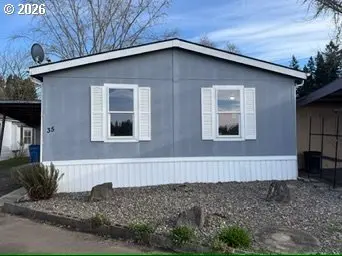
21201 NE 58th St · Camas, WA
Flood risk No data
- FEMA flood zone
- —
- Chance of flooding over 30 yrs
- —
- Est. flood insurance / yr
- —
Fire risk No data
- Est. fire insurance / yr
- —
Heat risk No data
- Hot days now (above threshold)
- —
- Hot days in 30 yrs
- —
Wind risk No data
- Chance of severe wind over 30 yrs
- —
Air-quality risk No data
- Unhealthy air days now
- —
- Unhealthy air days in 30 yrs
- —
Risk factors via First Street. Map © Google.
Why this score? — see what drove the B grade
The composite is a weighted blend of 9 inputs, each scored 0–100. Each bar is that input's sub-score; the figure is the points it added to the 100-point composite (weight × sub-score).
- Cash flow +30.0/30.0
- 1% rule +10.0/10.0
- DSCR +10.0/10.0
- ARV discount +7.5/15.0
- Schools +4.3/10.0
- Livability +3.7/5.0
- Rent growth +2.7/5.0
- Condition / age +2.5/5.0
- Appreciation +0.0/10.0
$149,900
🖨 Deal sheet 📄 Offer letter ✓ Due diligence
Listing remarks MLS
Welcome to 2026 with bright, inviting floor plan featuring vaulted ceilings and abundant natural light, and newly appointed and remodeled bathrooms and showers! Located in a quiet senior housing community tucked away just under the shadow of the desirable Green Mountain. The home has been remodeled with all new floors, appliances, quartz countertops and fresh paint. Buyers will appreciate the convenience as it's just 3 miles out from shopping and services. Space rent is $850 and Buyers will enjoy reduced operating expenses as park is located on private well and septic tanks. No rentals allowed.
Key facts
- Built 1999
- Listed 83 days
Neighborhood map
What this means for you Summary
Snapshot
- This is a 2-bed/2.0-bath manufactured listed at $150k.
Deal economics
- At list price, monthly cash flow is $1k ($17k/yr) — positive.
- The deal already cash-flows at list — no discount required.
- Meets the 1% rule at list price ($3k rent vs $150k).
- Recommended offer: $141k (6.0% below list) — sets the bar for market timing.
- Cap rate 17.5% vs local median 1.7% in Camas — top-decile yield for the area; either an underpriced asset or a hidden risk that comps aren't pricing in. Stress-test before assuming the spread holds.
Location & tenants
- Location reads 74/100 on livability (#181 in WA, #4,740 nationally) — a middle-class / working-renter tenant base. Strengths: crime A+, employment A+, housing A+; Watch: amenities F, commute F, cost of living F.
- Evergreen School District (Clark) (urban): math 41% / reading 51% proficiency, ranked #164 of 291 in WA (top 56%) — families likely to look elsewhere, expect single-tenant / working-renter base with shorter leases.
- Market conditions: Rents flat; 461 active listings in the ZIP; 3 comparable units currently listed for rent nearby; rentals leasing fast (median 2d on market — plan ~1-2 weeks tenant-placement turnaround); solid renter incomes; 3,547 units permitted in Clark County in 2024 (1,361 in 5+ unit buildings).
- This rent runs 35% of the median local income ($100k/yr) — at the standard rent-burdened threshold; future hikes will face affordability resistance.
Forward outlook
- Local home prices are declining (-3.0%/yr); year-one equity from $1k of loan paydown is wiped out by about $4k of value loss. Plan a longer hold.
- Clark County population projected at +29% by 2050 — long-run rental-demand tailwind backs the buy-and-hold thesis.
- At projected returns (-3.0% appreciation + 0.6% rent growth), your $42k cash investment doubles in ~4 years — after that, you're playing with house money.
Negotiation context
- It's been on market 83 days — a 6% lower offer ($141k) is reasonable based on typical stale-listing flexibility.
- 2 sale attempts since 17y ago; this cycle's ask has dropped $10k (6%) from the opening price — seller is motivated, your offer sets the floor, not the list.
- Current owner paid $62k; list at $150k implies a 144% gain — meaningful room to come down on a strong offer.
Questions for the listing agent
- It's been on market 83 days. Have you received any prior offers? Is the seller open to a 6% concession, seller financing, or rate buy-down credit?
- Why hasn't it sold? Are there any deal-killer items the seller is aware of (foundation, flood, title, zoning, code violations)?
- Is there a deadline driving the sale (1031 exchange, divorce, estate, relocation)? That informs how much negotiation room exists.
- Schools are A-rated — typically a magnet for longer-tenancy family renters. What's the average tenant stay here, and is there a school-zone premium baked into asking?
- What's the average days-on-market for RENTAL listings here right now (not sales)? A rising rental-DOM trend means longer vacancies and softer asking-rent achievability than the comps imply.
- What's the recent tenant-quality profile in this submarket — average credit score on applications, eviction rate, late-payment / NSF rate, and stable-employment percentage? A property-management company in the area should have these aggregated.
- How much new for-sale + rental construction is in the pipeline within 1–3 miles? Heavy new supply typically softens prices + rents 12–24 months out; constrained supply supports both.
Investment metrics
- 1% rule
- 1.94% ✓
- Cap rate
- 17.54%
- Cash-on-cash
- 40.17%
- DSCR
- 2.79
- GRM
- 4.3
CMA / ARV
- ARV (median comp)
- $91,000
- List price
- $149,900
- Delta
- 64.73%
- Verdict
- OVERPRICED
- Comps
- 2 within 1.0 mi
Show comp detail 2 sales within ~0.75 mi
| Address | Dist | Beds/Ba | Sqft | Sold | Price | $/sf | Match |
|---|---|---|---|---|---|---|---|
| 21201 NE 58th St #45 | 0.00mi | 3/2.0 (+1) | 1,476 (+10%) | 3mo | $107,000 | $72 | 76 |
| 21201 NE 58th St #41 | 0.00mi | 2/2.0 | 1,148 (-15%) | 20mo | $106,000 | $92 | 59 |
Match score weights: distance 35% · size 25% · config 20% · recency 20%. Top-matched comps best support the ARV.
Projected returns pro-forma
-3.0% appreciation · 0.63% rent growth · sell at horizon
- IRR
- 34.0%
- Equity multiple
- 2.39×
- Total profit
- $58,363
- Equity at exit
- $22,351
- IRR
- 39.7%
- Equity multiple
- 4.32×
- Total profit
- $139,323
- Equity at exit
- $12,961
Cash invested: $41,972 (down + closing). Projections, not guarantees.
Landlord ↔ Tenant lean methodology
- Overall (STATE)
- 28 Tenant-Leaning
- State Washington
- 28 Tenant-Leaning · D+8
- County
- — inherits STATE
- City
- — inherits STATE
ZIP-level market 98682
- Rents YoY
- 0.6%
- Active inventory
- 461
- Price-to-rent
- 4.3×
Monthly cashflow live
- Estimated rent
- $2,912 medium interval (Pro) →
- Mortgage (P&I)
- −$786
- Tax from tax record
- −$47 /mo · $564/yr
- Insurance
- −$62
- HOA
- −$0
- Vacancy / Maint / Mgmt
- −$612
- Net cashflow
- $1,405
Break-even live
UW: 25.0% down · 7.5% · 30yr · 1.5% tax · 5.0% vac · 8.0% maint · 8.0% mgmt
Financing live
Cash to close
- Down payment
- $37,475
- Closing costs
- $4,497
- Reserves months
- —
- Total cash needed
- —
Loan-product check · same deal, 3 products live
Conventional
25% down · 7.5% · 30yr
- Down + closing
- —
- Monthly P&I
- —
- Monthly cashflow
- —
- DSCR
- —
- Eligible?
- —
Personal DTI + credit; lowest rate.
DSCR
20% down · 8.5% · 30yr
- Down + closing
- —
- Monthly P&I
- —
- Monthly cashflow
- —
- DSCR
- —
- Eligible?
- —
No personal income docs; deal must DSCR.
Hard money
10% down · 12.0% · 12mo
- Down + closing
- —
- Monthly P&I
- —
- Monthly cashflow
- —
- DSCR
- —
- Eligible?
- —
Short-term bridge; refi at stabilization.
Rent comps 3 comps
| Address | Beds | Baths | Sqft | Rent | $/sqft | DOM | Units | Dist |
|---|---|---|---|---|---|---|---|---|
| 21912 NE 68th St Vancouver, WA | 3.0 | 2.5 | 1552 | $3,600 | $2.32 | 1d | 1 | 0.72mi |
| 9333 N Incline Dr Camas, WA | 3.0 | 2.0 | 1800 | $3,495 | $1.94 | 22d | 1 | 1.13mi |
| 7021 N 89th Ave Camas, WA | 3.0 | 2.5 | 1601 | $3,024 | $1.89 | 1d | 31 | 1.23mi |
Listing history 18 events
-
2026-06-18days on market $149,900 Active 83 DOM
-
2026-06-17days on market $149,900 Active 82 DOM
-
2026-06-16days on market $149,900 Active 81 DOM
-
2026-06-15days on market $149,900 Active 80 DOM
-
2026-06-13days on market $149,900 Active 78 DOM
-
2026-06-13days on market $149,900 Active 77 DOM
-
2026-06-09days on market $149,900 Active 74 DOM
-
2026-06-08days on market $149,900 Active 73 DOM
-
2026-06-07days on market $149,900 Active 72 DOM
-
2026-06-03days on market $149,900 Active 68 DOM
-
2026-06-02days on market $149,900 Active 67 DOM
-
2026-06-01days on market $149,900 Active 66 DOM
-
2026-05-31days on market $149,900 Active 65 DOM
-
2026-05-07price $149,900 603-char remark
Show marketing remark (603 chars)
Welcome to 2026 with bright, inviting floor plan featuring vaulted ceilings and abundant natural light, and newly appointed and remodeled bathrooms and showers! Located in a quiet senior housing community tucked away just under the shadow of the desirable Green Mountain. The home has been remodeled with all new floors, appliances, quartz countertops and fresh paint. Buyers will appreciate the convenience as it's just 3 miles out from shopping and services. Space rent is $850 and Buyers will enjoy reduced operating expenses as park is located on private well and septic tanks. No rentals allowed.
-
2026-03-27$160,000 Active 603-char remark
Show marketing remark (603 chars)
Welcome to 2026 with bright, inviting floor plan featuring vaulted ceilings and abundant natural light, and newly appointed and remodeled bathrooms and showers! Located in a quiet senior housing community tucked away just under the shadow of the desirable Green Mountain. The home has been remodeled with all new floors, appliances, quartz countertops and fresh paint. Buyers will appreciate the convenience as it's just 3 miles out from shopping and services. Space rent is $850 and Buyers will enjoy reduced operating expenses as park is located on private well and septic tanks. No rentals allowed.
-
2009-10-19soldstatus $61,500
-
2009-09-30historical
-
2009-08-25$61,500
ⓘ Source: listings_history table (triggers on properties + properties_extension) + one-shot
backfill from property_details.listing_events for pre-trigger history.
Tax reassessment forecast WA · Resets to sale price
- Current annual tax
- $564 · $47/mo
- Projected year-2 tax
- $1,469 · $122/mo
- Expected delta
- +$905/yr (+$75/mo · 160.5%)
ⓘ Screening estimate from a state-policy table — verify with the county assessor before closing.
Nearby sold comps map
Loading sold comps map…
Walkable amenities ~0.75 mi
Loading nearby amenities…
Taxation est. · year 1
- Rental income
- $34,943
- − Mortgage interest
- −$8,397
- − Property taxes
- −$564
- − Insurance
- −$750
- − Repairs & maintenance
- −$2,795
- − Management
- −$2,795
- − Depreciation
- −$4,361
- Taxable income
- $15,282
- Est. tax owed @ 24.0%
- −$3,668
- After-tax cash flow
- $13,191/yr
For passive investors: Depreciation is non-cash, so a rental often shows a tax loss while cash-flowing — sheltering income. Rental losses are passive: they offset passive income freely, and up to $25,000/yr can offset ordinary (W-2) income if you actively participate and your MAGI is under $100k (phasing out to $0 by $150k); unused losses carry forward. On sale, claimed depreciation is recaptured at up to 25%, and gains may owe capital-gains tax (a 1031 exchange can defer both). Figures are a year-1 estimate at your 24.0% rate — not tax advice; consult a CPA.
Schools (NCES district)
- District
- Evergreen School District (Clark)
- NCES district ID
- 5302700
- Math proficiency
- 41% ▼ -3.00%
- Reading proficiency
- 51% ▼ -3.00%
- Median HH income
- $59,418
- Composite
- 42.53/100
- National rank
- #6859
- State rank
- #164 of 291 in WA
Livability — Camas
- Score
- 74/100
- State rank
- #181
- US rank
- #4740
Category grades
Schools grade is shown separately in the Schools card above.
Census & demographics
- County
- Clark County · 513,189 people
- City population
- 35,867
- Metro
- Portland-Vancouver-Hillsboro, OR-WA
- Population (ZIP)
- 68,305
- Household income
- $99,918
- Rent vs Own
- Severe rent burden
- 1618.0
Population outlook (Clark County) Hauer SSP2
- Today (2025)
- 529,610 people
- By 2030
- 563,242 · +6.4%
- By 2040
- 625,905 · +18.2%
- By 2050
- 681,558 · +28.7%
- By 2075
- 805,967 · +52.2%
- By 2100
- 877,450 · +65.7%
Race, ethnicity, and origin ACS 2023
- Neighborhood character
- Predominantly White (69%)
- Race & ethnicity
- White 69% Hispanic / Latino 15% Two or more races 13% Asian 6% Black 2% Pacific Islander 1%
- Hispanic origin (detail)
- Mexican 12%
- Common ancestry
- Portuguese 3% Subsaharan African 3% Scotch-Irish 2%
- Foreign-born
- 13% · Canada, Vietnam, South Korea
- Languages at home
- 79% English-only · Spanish 8% Russian/Polish/Slavic 6% Other Asian/Pacific 2%
Political lean MEDSL · Clark
- 2024 margin
- Lean D (+7.0) · D 52.1% · R 45.1% · Other 2.8%
- 2008→2024 swing
- +0.9pp no change · 2008: 6.1pp · 2024: 7.0pp
- All cycles
- 2024: D+7.0 2020: D+5.1 2016: D+0.1 2012: D+0.1 2008: D+6.1
Not yet ingested
- Civics
- —
Market trends
- HPI YoY
- ▼ -303.95%
- Current HPI
- 307.0529
- Rent YoY
- ▲ 0.63%
- Metro
- Portland-Vancouver-Hillsboro, OR-WA
- State GDP YoY
- ▲ 4.65%
- F500 in state
- 22
Industry mix (Fortune 500 HQ in WA)
| Industry | F500 HQs | Revenue |
|---|---|---|
| Retail | 2 | $269B |
|
||
| Technology / Retail | 1 | $638B |
|
||
| Technology | 1 | $245B |
|
||
| Telecommunications | 1 | $38B |
|
||
| Food / Beverage | 1 | $36B |
|
||
| Automotive / Trucks | 1 | $34B |
|
||
Price history
+143.7% since first listed5 events — show timeline
- 2026-05-07 Price Changed $149,900 RMLS
- 2026-03-27 Listed $160,000 RMLS
- 2009-10-19 Sold (MLS) $61,500 NWMLS as Distributed by MLS Grid
- 2009-09-30 Delisted — NWMLS as Distributed by MLS Grid
- 2009-08-25 Listed $61,500 NWMLS as Distributed by MLS Grid
Property tax history
+11.7%/yrLatest (2021): $564 · +36.1% YoY. Source: county tax records.
Cash-flow waterfall
monthlySold comps — $/sqft
last 12 mo · ≤1 miLoading sold comps…