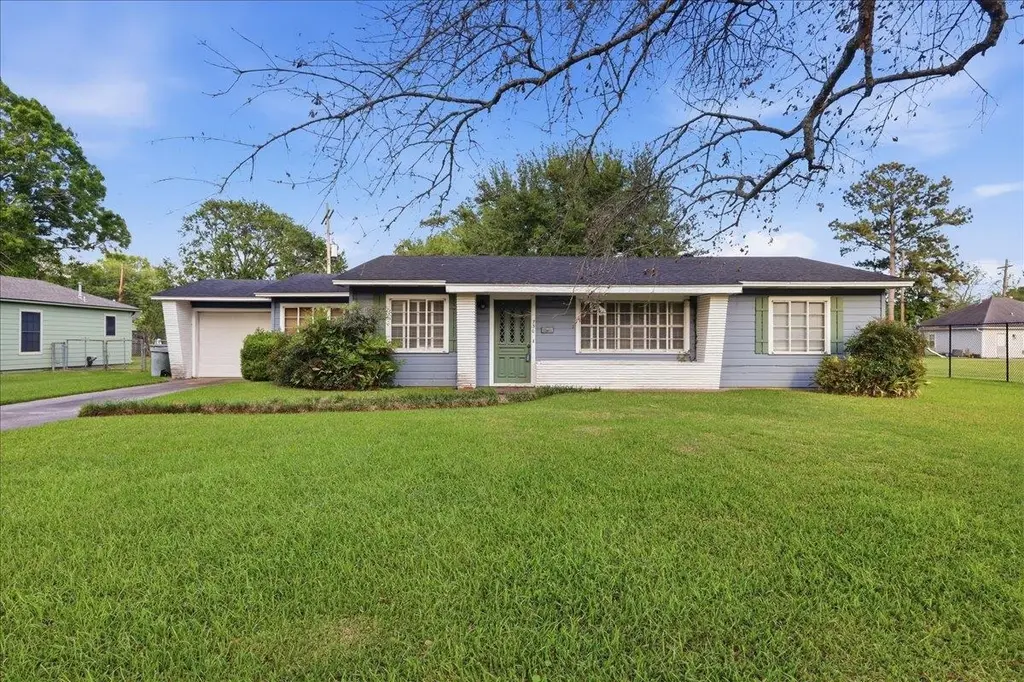
730 Yount St · Beaumont, TX
Flood risk 6/10 · Moderate
- FEMA flood zone
- X
- Chance of flooding over 30 yrs
- 0.71%
- Est. flood insurance / yr
- $507 – $1,088
Fire risk 1/10 · Minimal
- Est. fire insurance / yr
- $1,222 – $2,270
Heat risk 9/10 · Severe
- Hot days now (above 110°F)
- 7 days/yr
- Hot days in 30 yrs
- 24 days/yr
Wind risk 9/10 · Severe
- Chance of severe wind over 30 yrs
- 99.0%
Air-quality risk 2/10 · Minimal
- Unhealthy air days now
- 1 days/yr
- Unhealthy air days in 30 yrs
- 1 days/yr
Risk factors via First Street. Map © Google.
Why this score? — see what drove the C+ grade
The composite is a weighted blend of 9 inputs, each scored 0–100. Each bar is that input's sub-score; the figure is the points it added to the 100-point composite (weight × sub-score).
- Cash flow +23.2/30.0
- ARV discount +15.0/15.0
- DSCR +7.5/10.0
- 1% rule +6.0/10.0
- Livability +3.2/5.0
- Rent growth +2.7/5.0
- Condition / age +2.5/5.0
- Schools +1.5/10.0
- Appreciation +0.0/10.0
$149,900
🖨 Deal sheet (PDF) 📄 Offer letter ✓ Due diligence
Listing remarks MLS
Discover this charming three-bedroom, one-bath home in Beaumont’s desirable West End, Mary Howell Addition. Situated on a spacious lot, this residence offers two distinct living areas—perfect for entertaining or relaxing. Beautiful wood floors. The one-car garage provides convenience, and the generous yard offers plenty of room to grow. Don’t miss this opportunity in a sought-after neighborhood! The neighborhood you want and the price is right to do improvements to your liking. Seller is currently working on cleaning this house out so it may be messy.
Key facts
- One car garage
- Generous yard
- 0.27 acre lot
Tags
Neighborhood map
What this means for you Summary
Snapshot
- This is a 3-bed/1.0-bath single-family listed at $150k.
Deal economics
- At list price, monthly cash flow is $272 ($3k/yr) — positive.
- The deal already cash-flows at list — no discount required.
- Meets the 1% rule at list price ($2k rent vs $150k).
- Recommended offer: $148k (1.5% below list) — sets the bar for market timing.
- Cap rate 8.5% vs local median 5.3% in Beaumont — top-decile yield for the area; either an underpriced asset or a hidden risk that comps aren't pricing in. Stress-test before assuming the spread holds.
Location & tenants
- Location reads 64/100 on livability (#739 in TX) — a middle-class / working-renter tenant base. Strengths: cost of living A+, housing A+, health & safety A+; Watch: employment D, crime F, amenities F.
- Beaumont ISD (urban): math 14% / reading 22% proficiency, ranked #789 of 826 in TX (top 96%) — low school quality limits family demand, transient renter base, plan for 1-2y turnover; 69% free/reduced lunch — lower-income household profile, screen leases tightly.
- Zoned schools: Curtis El (math 33% / reading 35%, grade F, #2,149 of 4,322 statewide, top 50%, 492 students, 55% FRL); Marshall Middle (math 17% / reading 25%, grade F, #1,387 of 1,662 statewide, top 85%, 711 students, 62% FRL); West Brook Sr H S (math 19% / reading 34%, grade F, #1,228 of 1,632 statewide, top 76%, 2,245 students, 58% FRL).
- Market conditions: Rents flat; 259 active listings in the ZIP; 23 comparable units currently listed for rent nearby; rentals at typical pace (median 25d on market — plan ~3-4 weeks tenant-placement turnaround); 43% of comp listings sitting > 30 days — soft ceiling on asking rent; 343 units permitted in Jefferson County in 2024 (0 in 5+ unit buildings).
Forward outlook
- Local home prices are declining (-3.0%/yr); year-one equity from $1k of loan paydown is wiped out by about $4k of value loss. Plan a longer hold.
Negotiation context
- It's been on market 17 days — a 2% lower offer ($148k) is reasonable based on typical stale-listing flexibility.
Risks & watch-outs
- Climate carrying-cost: major flood risk; severe wind risk, 99% chance of damaging wind over 30y; extreme-heat days projected 7→24/yr by 2055 (HVAC capex compounding) — expect insurance premiums to compound above CPI over the hold.
Questions for the listing agent
- Built in 1962 — when were the roof, HVAC, electrical panel, plumbing, and water heater last replaced?
- Is there a deadline driving the sale (1031 exchange, divorce, estate, relocation)? That informs how much negotiation room exists.
- Schools are D-rated, which usually means shorter tenancies and higher turnover. Who's the typical renter profile here, and what's been the actual vacancy rate?
- Crime grade is F in this area — have there been break-ins, vandalism, or insurance claims at this property in the last 3 years? What carrier currently insures it and at what premium?
- What's the average days-on-market for RENTAL listings here right now (not sales)? A rising rental-DOM trend means longer vacancies and softer asking-rent achievability than the comps imply.
- What's the recent tenant-quality profile in this submarket — average credit score on applications, eviction rate, late-payment / NSF rate, and stable-employment percentage? A property-management company in the area should have these aggregated.
- How much new for-sale + rental construction is in the pipeline within 1–3 miles? Heavy new supply typically softens prices + rents 12–24 months out; constrained supply supports both.
Investment metrics
- 1% rule
- 1.10% ✓
- Cap rate
- 8.47%
- Cash-on-cash
- 7.78%
- DSCR
- 1.35
- GRM
- 7.6
CMA / ARV
- ARV (median comp)
- $200,835
- List price
- $149,900
- Delta
- -25.36%
- Verdict
- UNDERPRICED
- Comps
- 20 within 1.0 mi
Show comp detail 6 sales within ~0.75 mi
| Address | Dist | Beds/Ba | Sqft | Sold | Price | $/sf | Match |
|---|---|---|---|---|---|---|---|
| 5590 Kohler St | 0.30mi | 3/2.0 | 1,469 (-0%) | 3mo | $210,000 | $143 | 79 |
| 4760 Lanark Ln | 0.43mi | 3/1.5 | 1,508 (+2%) | 11mo | $204,900 | $136 | 65 |
| 92 Sparrow Way | 0.60mi | 3/2.0 | 1,305 (-12%) | 3mo | $169,900 | $130 | 46 |
| 98 Sparrow Way | 0.62mi | 3/2.0 | 1,275 (-14%) | 1mo | $198,000 | $155 | 43 |
| 4675 Fieldwood Ln | 0.72mi | 3/1.5 | 1,280 (-13%) | 1mo | $195,000 | $152 | 42 |
| 4690 Dellwood Ln | 0.63mi | 3/1.0 | 1,363 (-8%) | 21mo | $155,000 | $114 | 41 |
Match score weights: distance 35% · size 25% · config 20% · recency 20%. Top-matched comps best support the ARV.
Projected returns pro-forma
-3.0% appreciation · 0.66% rent growth · sell at horizon
- IRR
- -7.1%
- Equity multiple
- 0.74×
- Total profit
- $-10,737
- Equity at exit
- $22,351
- IRR
- -0.7%
- Equity multiple
- 0.96×
- Total profit
- $-1,800
- Equity at exit
- $12,961
Cash invested: $41,972 (down + closing). Projections, not guarantees.
Landlord ↔ Tenant lean methodology
- Overall (STATE)
- 87 Strongly Landlord-Friendly
- State Texas
- 87 Strongly Landlord-Friendly · R+5
- County
- — inherits STATE
- City
- — inherits STATE
ZIP-level market 77706
- Rents YoY
- 0.7%
- Active inventory
- 259
- Price-to-rent
- 7.6×
Monthly cashflow live
- Estimated rent
- $1,648 high interval (Pro) →
- Mortgage (P&I)
- −$786
- Tax from tax record
- −$181 /mo · $2,173/yr
- Insurance
- −$62
- HOA
- −$0
- Vacancy / Maint / Mgmt
- −$346
- Net cashflow
- $272
Break-even live
Sensitivity live
| Price | -10% $357 | -5% $314 | +0% $272 | +5% $230 | +10% $187 |
|---|---|---|---|---|---|
| Rent | -10% $142 | -5% $207 | +0% $272 | +5% $337 | +10% $402 |
| Rate | -1.0pp $347 | -0.5pp $310 | base $272 | +0.5pp $233 | +1.0pp $194 |
UW: 25.0% down · 7.5% · 30yr · 1.5% tax · 5.0% vac · 8.0% maint · 8.0% mgmt
Financing live
Cash to close
- Down payment
- $37,475
- Closing costs
- $4,497
- Reserves months
- —
- Total cash needed
- —
Loan-product check · same deal, 3 products live
Conventional
25% down · 7.5% · 30yr
- Down + closing
- —
- Monthly P&I
- —
- Monthly cashflow
- —
- DSCR
- —
- Eligible?
- —
Personal DTI + credit; lowest rate.
DSCR
20% down · 8.5% · 30yr
- Down + closing
- —
- Monthly P&I
- —
- Monthly cashflow
- —
- DSCR
- —
- Eligible?
- —
No personal income docs; deal must DSCR.
Hard money
10% down · 12.0% · 12mo
- Down + closing
- —
- Monthly P&I
- —
- Monthly cashflow
- —
- DSCR
- —
- Eligible?
- —
Short-term bridge; refi at stabilization.
Rent comps 23 comps
| Address | Beds | Baths | Sqft | Rent | $/sqft | DOM | Units | Dist |
|---|---|---|---|---|---|---|---|---|
| 5110 Laurel St Beaumont, TX | 3.0 | 2.0 | 1303 | $1,995 | $1.53 | 23d | 1 | 0.44mi |
| 85 E Caldwood Dr Beaumont, TX | 2.0 | 1.5 | 1330 | $1,223 | $0.92 | 45d | 2 | 0.48mi |
| 85 E Caldwood Dr #6 Beaumont, TX | 2.0 | 1.5 | 1331 | $1,250 | $0.94 | 25d | 1 | 0.48mi |
| 5195 Oriole Dr Beaumont, TX | 3.0 | 2.0 | 1814 | $2,000 | $1.10 | 45d | 1 | 0.48mi |
| 458 Belvedere Dr Beaumont, TX | 3.0 | 2.0 | 1465 | $1,595 | $1.09 | 23d | 1 | 0.51mi |
| 565 25th St Beaumont, TX | 2.0 | 2.0 | 1128 | $1,650 | $1.46 | 15d | 1 | 0.57mi |
| 340 Maxwell Dr Beaumont, TX | 3.0 | 2.5 | 1824 | $2,100 | $1.15 | 45d | 1 | 0.69mi |
| 770 Peyton Dr Beaumont, TX | 3.0 | 2.0 | 1769 | $1,895 | $1.07 | 45d | 1 | 0.72mi |
| 6250 Ivanhoe Ln Beaumont, TX | 1.0–2.0 | 1.0–2.0 | 885 | $1,604 | $1.81 | 15d | 9 | 0.86mi |
| 3720 Laurel St #6 Beaumont, TX | 2.0 | 1.5 | 1152 | $1,095 | $0.95 | 15d | 1 | 0.91mi |
| 3720 Laurel Ave Unit Laurel Ave unit 12 Beaumont, TX | 2.0 | 1.5 | 1188 | $1,095 | $0.92 | 25d | 1 | 0.92mi |
| 1620 Wellington Pl #903 Beaumont, TX | 2.0 | 2.5 | 1215 | $1,750 | $1.44 | 45d | 1 | 0.98mi |
| 520 Dowlen Rd Beaumont, TX | 1.0–2.0 | 1.0–2.0 | 940 | $1,050 | $1.12 | 15d | 10 | 1.01mi |
| 355 N 18th St Beaumont, TX | 3.0 | 2.0 | 1050 | $1,395 | $1.33 | 45d | 1 | 1.05mi |
| 880 Lockwood Dr Beaumont, TX | 3.0 | 2.0 | 1819 | $1,995 | $1.10 | 45d | 1 | 1.08mi |
| 1215 Longfellow Dr Beaumont, TX | 1.0–2.0 | 1.0–2.0 | 834 | $1,545 | $1.85 | 15d | 15 | 1.11mi |
| 551 Georgetown St Beaumont, TX | 2.0 | 1.5 | 1317 | $1,300 | $0.99 | 45d | 1 | 1.12mi |
| 6561 Lexington Dr Beaumont, TX | 2.0 | 2.0 | 1321 | $1,011 | $0.77 | 45d | 1 | 1.23mi |
| 745 Jeny Ln Beaumont, TX | 3.0 | 1.0 | 1008 | $1,190 | $1.18 | 25d | 1 | 1.24mi |
| 3825 Hyde Park Row Beaumont, TX | 3.0 | 2.0 | 1271 | $1,550 | $1.22 | 45d | 1 | 1.29mi |
| 6795 Greenwood Dr Beaumont, TX | 3.0 | 2.0 | 1650 | $2,500 | $1.52 | 25d | 1 | 1.43mi |
| 345 Marceline Blvd Beaumont, TX | 2.0 | 1.5 | 1200 | $2,250 | $1.88 | 25d | 1 | 1.45mi |
| 345 Marceline Blvd Beaumont, TX | 2.0 | 1.5 | 1200 | $1,850 | $1.54 | 23d | 1 | 1.45mi |
Listing history 2 events
-
2026-05-03status Pending 575-char remark
Show marketing remark (575 chars)
Discover this charming three-bedroom, one-bath home in Beaumont’s desirable West End, Mary Howell Addition. Situated on a spacious lot, this residence offers two distinct living areas—perfect for entertaining or relaxing. Beautiful wood floors. The one-car garage provides convenience, and the generous yard offers plenty of room to grow. Don’t miss this opportunity in a sought-after neighborhood! The neighborhood you want and the price is right to do improvements to your liking. Seller is currently working on cleaning this house out so it may be messy.
-
2026-04-16$149,900 Active 575-char remark
Show marketing remark (575 chars)
Discover this charming three-bedroom, one-bath home in Beaumont’s desirable West End, Mary Howell Addition. Situated on a spacious lot, this residence offers two distinct living areas—perfect for entertaining or relaxing. Beautiful wood floors. The one-car garage provides convenience, and the generous yard offers plenty of room to grow. Don’t miss this opportunity in a sought-after neighborhood! The neighborhood you want and the price is right to do improvements to your liking. Seller is currently working on cleaning this house out so it may be messy.
ⓘ Source: listings_history table (triggers on properties + properties_extension) + one-shot
backfill from property_details.listing_events for pre-trigger history.
Tax reassessment forecast TX · Resets to sale price
- Current annual tax
- $2,173 · $181/mo
- Projected year-2 tax
- $2,743 · $229/mo
- Expected delta
- +$570/yr (+$48/mo · 26.2%)
ⓘ Screening estimate from a state-policy table — verify with the county assessor before closing.
Climate risk First Street
- Flood 6/10 Major FEMA zone X · 71% chance over 30 yrs
- Wildfire 1/10 Low
- Heat 9/10 Extreme 7 d/yr ≥110°F today · 24 d/yr by 30 yrs out
- Wind 9/10 Extreme 99% chance of damaging wind over 30 yrs
- Air quality 2/10 Low 1 unhealthy d/yr today · 1 by 30 yrs out
Nearby sold comps map
Loading sold comps map…
Walkable amenities ~0.75 mi
Loading nearby amenities…
Taxation est. · year 1
- Rental income
- $19,772
- − Mortgage interest
- −$8,397
- − Property taxes
- −$2,173
- − Insurance
- −$750
- − Repairs & maintenance
- −$1,582
- − Management
- −$1,582
- − Depreciation
- −$4,361
- Taxable income
- $928
- Est. tax owed @ 24.0%
- −$223
- After-tax cash flow
- $3,041/yr
For passive investors: Depreciation is non-cash, so a rental often shows a tax loss while cash-flowing — sheltering income. Rental losses are passive: they offset passive income freely, and up to $25,000/yr can offset ordinary (W-2) income if you actively participate and your MAGI is under $100k (phasing out to $0 by $150k); unused losses carry forward. On sale, claimed depreciation is recaptured at up to 25%, and gains may owe capital-gains tax (a 1031 exchange can defer both). Figures are a year-1 estimate at your 24.0% rate — not tax advice; consult a CPA.
Schools (NCES district)
- District
- Beaumont ISD
- NCES district ID
- 4809670
- Math proficiency
- 14% ▼ -13.00%
- Reading proficiency
- 22% ▼ -7.00%
- Median HH income
- $41,683
- Composite
- 15.43/100
- National rank
- #9316
- State rank
- #789 of 826 in TX
Livability — Beaumont
- Score
- 64/100
- State rank
- #739
- US rank
- #13710
Category grades
Schools grade is shown separately in the Schools card above.
Census & demographics
- Census place
- Beaumont, TX
- County
- Jefferson County · 203,592 people
- City population
- 125,901
- Metro
- Beaumont-Port Arthur, TX
- Population (ZIP)
- 30,393
- Household income
- $73,185
- Rent vs Own
- Severe rent burden
- 1299.0
Population outlook (Jefferson County) Hauer SSP2
- Today (2025)
- 259,015 people
- By 2030
- 260,685 · +0.6%
- By 2040
- 263,309 · +1.7%
- By 2050
- 265,237 · +2.4%
- By 2075
- 270,193 · +4.3%
- By 2100
- 255,628 · -1.3%
Race, ethnicity, and origin ACS 2023
- Neighborhood character
- Diverse neighborhood (Simpson 0.61)
- Race & ethnicity
- White 56% Black 24% Hispanic / Latino 13% Two or more races 9% Asian 4%
- Hispanic origin (detail)
- Mexican 10%
- Common ancestry
- Lithuanian 4% Iranian 3% Slovak 2%
- Foreign-born
- 8% · Canada, China
- Languages at home
- 87% English-only · Spanish 8% Other Indo-European 2% German/W. Germanic 1%
Political lean MEDSL · Jefferson
- 2024 margin
- Lean R (+8.9) · D 45.1% · R 54.0%
- 2008→2024 swing
- -11.1pp toward R · 2008: 2.2pp · 2024: -8.9pp
- All cycles
- 2024: R+8.9 2020: R+1.6 2016: R+0.5 2012: D+1.6 2008: D+2.2
Not yet ingested
- Civics
- —
Market trends
- HPI YoY
- ▼ -180.53%
- Current HPI
- 159.4053
- Rent YoY
- ▲ 0.66%
- Metro
- Beaumont-Port Arthur, TX
- State GDP YoY
- ▲ 3.95%
- F500 in state
- 110
Industry mix (Fortune 500 HQ in TX)
| Industry | F500 HQs | Revenue |
|---|---|---|
| Energy | 16 | $1,198B |
|
||
| Technology | 5 | $198B |
|
||
| Engineering / Construction | 4 | $72B |
|
||
| Energy Services | 3 | $60B |
|
||
| Utilities | 3 | $41B |
|
||
| Healthcare | 2 | $330B |
|
||
Price history
2 events — show timeline
- 2026-05-03 Pending — BBOR
- 2026-04-16 Listed $149,900 BBOR
Property tax history
-0.5%/yrLatest (2025): $2,173 · -0.8% YoY. Source: county tax records.
Cash-flow waterfall
monthlySold comps — $/sqft
last 12 mo · ≤1 miLoading sold comps…