2821 N Miami Beach Blvd Unit 2K · North Miami Beach, FL
Flood risk No data
- FEMA flood zone
- —
- Chance of flooding over 30 yrs
- —
- Est. flood insurance / yr
- —
Fire risk No data
- Est. fire insurance / yr
- —
Heat risk No data
- Hot days now (above threshold)
- —
- Hot days in 30 yrs
- —
Wind risk No data
- Chance of severe wind over 30 yrs
- —
Air-quality risk No data
- Unhealthy air days now
- —
- Unhealthy air days in 30 yrs
- —
Risk factors via First Street. Map © Google.
Why this score? — see what drove the C grade
The composite is a weighted blend of 9 inputs, each scored 0–100. Each bar is that input's sub-score; the figure is the points it added to the 100-point composite (weight × sub-score).
- Cash flow +17.0/30.0
- 1% rule +8.7/10.0
- ARV discount +7.5/15.0
- DSCR +5.3/10.0
- Appreciation +5.3/10.0
- Schools +4.2/10.0
- Livability +4.1/5.0
- Condition / age +3.8/5.0
- Rent growth +2.7/5.0
$270,000
🖨 Deal sheet 📄 Offer letter ✓ Due diligence
Listing remarks
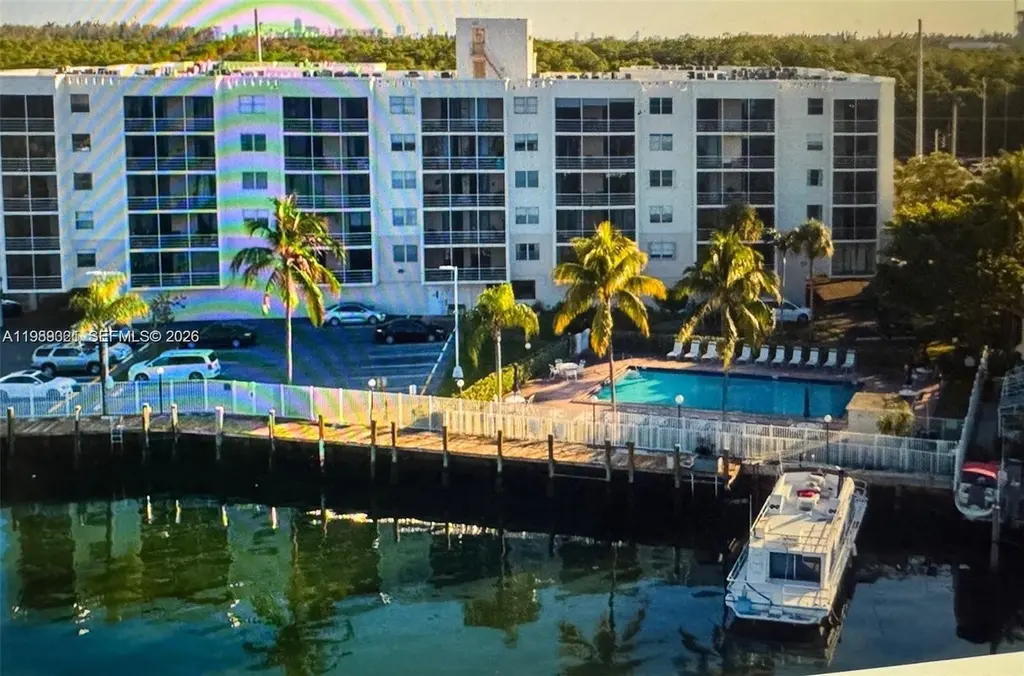
Spacious 2-bedroom, 2-bath unit in the heart of North Miami Beach. This 2nd-floor residence offers a comfortable, functional layout, abundant natural light, and a large living/dining area ideal for everyday living or a home office setup. The building features a swimming pool, on-site parking, and a prime location just minutes from Aventura Mall, Sunny Isles Beach, Oleta River State Park, shops, supermarkets, dining, and major highways. Perfect for a primary residence, seasonal use, or investment opportunity. Easy to show.
Key facts
- Swimming pool
- On-site parking
- Prime location
Tags
Property features AI
Finance
- Financial info: Pets allowed with restrictions or possible restrictions (conditional)
- HOA & community: Monthly association fee; Association fee includes common areas, cable TV, laundry, grounds maintenance, structure maintenance, parking, pest control, pool(s), sewer, and trash; Association amenities include boat dock, fitness center, laundry, pool, sauna, storage, and elevators
Exterior
- Parking: Assigned parking; Guest parking; One assigned space
- Security: Complex fenced; Secured elevator; Key card entry
- Utilities: Cable available
- Home design: Condominium unit in a 6-story building; Single-level unit (1 story); Entry located on level 2; Property is attached
- Construction: Block construction; Exterior lighting
- Exterior features: Balcony (open, screened); Association pool; Canal-front waterfront; Has a view; Faces east
Interior
- Kitchen: Dishwasher; Electric range; Microwave; Refrigerator
- Bedrooms: Main level primary bedroom
- Flooring: Ceramic tile
- Bathrooms: 2 full bathrooms
- Heating & cooling: Central heating; Central air conditioning
- Interior features: Blinds on windows; Closet cabinetry; Dining area; Separate/formal dining room; Entrance foyer; Elevator access; First floor entry; Living/dining room combination; Main level primary suite; Main living area on entry level; Tub/shower; Walk-in closets; Storage room
- Laundry & utility: Common area laundry; Electric water heater
Neighborhood map
What this means for you Summary
Snapshot
- This is a 2-bed/2.0-bath condo listed at $270k. Condition is rated good.
Deal economics
- At list price, monthly cash flow is $182 ($2k/yr) — positive.
- The deal already cash-flows at list — no discount required.
- Meets the 1% rule at list price ($4k rent vs $270k).
- Recommended offer: $254k (6.0% below list) — sets the bar for market timing.
- Cap rate 7.1% vs local median 5.2% in North Miami Beach — top-decile yield for the area; either an underpriced asset or a hidden risk that comps aren't pricing in. Stress-test before assuming the spread holds.
Location & tenants
- Location reads 82/100 on livability (#71 in FL, #1,177 nationally) — a professional / high-income tenant draw. Strengths: commute A+, housing A+, health & safety A+; Watch: employment D+, crime F.
- Miami-Dade (suburban): math 45% / reading 54% proficiency, ranked #40 of 73 in FL (top 55%) — families likely to look elsewhere, expect single-tenant / working-renter base with shorter leases; 64% free/reduced lunch — lower-income household profile, screen leases tightly.
- Market conditions: Rents flat; 1870 active listings in the ZIP; 10,051 units permitted in Miami-Dade County in 2024 (7,758 in 5+ unit buildings).
- At $3,695/mo this rent would consume 66% of the median local household income ($67k/yr) (locally 3106% of renters already pay >50% of income on rent) — very limited rent-growth headroom before tenants either downsize or default.
Forward outlook
- In year one you build about $3k of equity ($2k loan paydown + $1k appreciation (0.5% local appreciation)).
- Miami-Dade County population projected at +28% by 2050 — long-run rental-demand tailwind backs the buy-and-hold thesis.
- By year 9, paydown + projected appreciation supports a ~$33k cash-out refi (75% LTV) — recoverable capital for the next deal without selling this one.
Negotiation context
- It's been on market 85 days — a 6% lower offer ($254k) is reasonable based on typical stale-listing flexibility.
Risks & watch-outs
- Watch-outs: HOA is 24% of rent.
Questions for the listing agent
- It's been on market 85 days. Have you received any prior offers? Is the seller open to a 6% concession, seller financing, or rate buy-down credit?
- Built in 1973 — when were the roof, HVAC, electrical panel, plumbing, and water heater last replaced?
- What does the HOA fee cover, when was the last increase, and are there any pending special assessments or reserve-fund shortfalls?
- Any open or pending special assessments — roof, HVAC, plumbing, elevator, façade? What's the per-unit balance and payoff schedule, and is the seller paying it off at close or rolling it to the buyer?
- Why hasn't it sold? Are there any deal-killer items the seller is aware of (foundation, flood, title, zoning, code violations)?
- Is there a deadline driving the sale (1031 exchange, divorce, estate, relocation)? That informs how much negotiation room exists.
- Crime grade is F in this area — have there been break-ins, vandalism, or insurance claims at this property in the last 3 years? What carrier currently insures it and at what premium?
- What's the average days-on-market for RENTAL listings here right now (not sales)? A rising rental-DOM trend means longer vacancies and softer asking-rent achievability than the comps imply.
- What's the recent tenant-quality profile in this submarket — average credit score on applications, eviction rate, late-payment / NSF rate, and stable-employment percentage? A property-management company in the area should have these aggregated.
- How much new apartment / multifamily construction is in the pipeline within 1–3 miles? Heavy new supply (>2% of stock underway) typically softens rents 12–24 months out; light construction supports rent growth.
Investment metrics
- 1% rule
- 1.37% ✓
- Cap rate
- 7.10%
- Cash-on-cash
- 2.90%
- DSCR
- 1.13
- GRM
- 6.1
CMA / ARV
No comps found within radius.
Projected returns pro-forma
0.53% appreciation · 0.94% rent growth · sell at horizon
- IRR
- 1.0%
- Equity multiple
- 1.05×
- Total profit
- $3,568
- Equity at exit
- $85,588
- IRR
- 4.2%
- Equity multiple
- 1.45×
- Total profit
- $34,155
- Equity at exit
- $108,809
Cash invested: $75,600 (down + closing). Projections, not guarantees.
Landlord ↔ Tenant lean methodology
- Overall (STATE)
- 87 Strongly Landlord-Friendly
- State Florida
- 87 Strongly Landlord-Friendly · R+3
- County
- — inherits STATE
- City
- — inherits STATE
ZIP-level market 33160
- Home prices YoY
- 0.2%
- Rents YoY
- 0.9%
- Active inventory
- 1870
- Price-to-rent
- 6.1×
Monthly cashflow live
- Estimated rent
- $3,695 medium interval (Pro) →
- Mortgage (P&I)
- −$1,416
- Tax est. 1.5%
- −$338 /mo · $4,050/yr
- Insurance
- −$112
- HOA
- −$871
- Vacancy / Maint / Mgmt
- −$776
- Net cashflow
- $182
Break-even live
UW: 25.0% down · 7.5% · 30yr · 1.5% tax · 5.0% vac · 8.0% maint · 8.0% mgmt
Financing live
Cash to close
- Down payment
- $67,500
- Closing costs
- $8,100
- Reserves months
- —
- Total cash needed
- —
Loan-product check · same deal, 3 products live
Conventional
25% down · 7.5% · 30yr
- Down + closing
- —
- Monthly P&I
- —
- Monthly cashflow
- —
- DSCR
- —
- Eligible?
- —
Personal DTI + credit; lowest rate.
DSCR
20% down · 8.5% · 30yr
- Down + closing
- —
- Monthly P&I
- —
- Monthly cashflow
- —
- DSCR
- —
- Eligible?
- —
No personal income docs; deal must DSCR.
Hard money
10% down · 12.0% · 12mo
- Down + closing
- —
- Monthly P&I
- —
- Monthly cashflow
- —
- DSCR
- —
- Eligible?
- —
Short-term bridge; refi at stabilization.
HOA detail condo
- Monthly dues
- $871 · $10,452/yr
- Likely covers
- pool
- Assessments
- None detected in remarks — confirm with the listing agent.
Listing history 15 events
-
2026-06-18days on market $270,000 Active 85 DOM
-
2026-06-17days on market $270,000 Active 84 DOM
-
2026-06-16days on market $270,000 Active 83 DOM
-
2026-06-15days on market $270,000 Active 82 DOM
-
2026-06-13days on market $270,000 Active 80 DOM
-
2026-06-09days on market $270,000 Active 76 DOM
-
2026-06-08days on market $270,000 Active 75 DOM
-
2026-06-07days on market $270,000 Active 74 DOM
-
2026-06-04days on market $270,000 Active 71 DOM
-
2026-06-03days on market $270,000 Active 70 DOM
-
2026-06-02days on market $270,000 Active 69 DOM
-
2026-06-01days on market $270,000 Active 68 DOM
-
2026-05-31days on market $270,000 Active 67 DOM
-
2026-05-14price $270,000
-
2026-03-25$280,000 Active
ⓘ Source: listings_history table (triggers on properties + properties_extension) + one-shot
backfill from property_details.listing_events for pre-trigger history.
Nearby sold comps map
Loading sold comps map…
Walkable amenities ~0.75 mi
Loading nearby amenities…
Taxation est. · year 1
- Rental income
- $44,345
- − Mortgage interest
- −$15,124
- − Property taxes
- −$4,050
- − Insurance
- −$1,350
- − Repairs & maintenance
- −$3,548
- − Management
- −$3,548
- − HOA
- −$10,452
- − Depreciation
- −$7,855
- Taxable loss
- −$1,581
- Est. tax savings @ 24.0%
- +$379
- After-tax cash flow
- $2,569/yr
For passive investors: Depreciation is non-cash, so a rental often shows a tax loss while cash-flowing — sheltering income. Rental losses are passive: they offset passive income freely, and up to $25,000/yr can offset ordinary (W-2) income if you actively participate and your MAGI is under $100k (phasing out to $0 by $150k); unused losses carry forward. On sale, claimed depreciation is recaptured at up to 25%, and gains may owe capital-gains tax (a 1031 exchange can defer both). Figures are a year-1 estimate at your 24.0% rate — not tax advice; consult a CPA.
Condition & rehab AI · 13 photos
This 2-bedroom, 2-bath unit in North Miami Beach is in good condition with a good condition score of 75. The property is located in a prime location and offers a comfortable, functional layout. The building is well-maintained with clean siding and a maintained landscaping. The interior is clean and well-lit, with no visible signs of wear or damage. The property is in good condition and would benefit from some cosmetic updates to increase its value.
Value-add opportunities
- Both Paint the exterior siding — Painting the exterior siding can improve the curb appeal and increase the property's value.
- Both Upgrade the flooring — Upgrading the flooring can improve the overall aesthetic and increase the property's value.
- Both Update the bathroom fixtures — Updating the bathroom fixtures can improve the property's value and make it more appealing to potential buyers or renters.
Renovation cost estimate screening
Value-add ROI direction
- Both Paint the exterior siding — Painting the exterior siding can improve the curb appeal and increase the property's value. ↑
- Both Upgrade the flooring — Upgrading the flooring can improve the overall aesthetic and increase the property's value. ↑
- Both Update the bathroom fixtures — Updating the bathroom fixtures can improve the property's value and make it more appealing to potential buyers or renters. ↑
ⓘ Cost ranges are severity-bucket heuristics (US national rule-of-thumb). Get contractor quotes + a written scope before underwriting a rehab budget.
Schools (NCES district)
- District
- Miami-Dade
- NCES district ID
- 1200390
- Math proficiency
- 45% ▼ -16.00%
- Reading proficiency
- 54% ▼ -5.00%
- Median HH income
- $43,928
- Composite
- 41.76/100
- National rank
- #3397
- State rank
- #40 of 73 in FL
Livability — North Miami Beach
- Score
- 82/100
- State rank
- #71
- US rank
- #1177
Category grades
Schools grade is shown separately in the Schools card above.
Census & demographics
- Census place
- North Miami Beach, FL
- County
- Miami-Dade County · 2,697,751 people
- City population
- 34,147
- Metro
- Miami-Fort Lauderdale-Pompano Beach, FL
- Population (ZIP)
- 43,718
- Household income
- $67,040
- Rent vs Own
- Severe rent burden
- 3106.0
Population outlook (Miami-Dade County) Hauer SSP2
- Today (2025)
- 3,126,439 people
- By 2030
- 3,325,765 · +6.4%
- By 2040
- 3,697,561 · +18.3%
- By 2050
- 4,012,134 · +28.3%
- By 2075
- 4,605,612 · +47.3%
- By 2100
- 4,866,598 · +55.7%
Race, ethnicity, and origin ACS 2023
- Neighborhood character
- Diverse neighborhood (Simpson 0.59)
- Race & ethnicity
- Hispanic / Latino 46% White 44% Two or more races 27% Black 4% Asian 2%
- Hispanic origin (detail)
- Mexican 1% Puerto Rican 3% Cuban 8% Dominican 1% Salvadoran 4%
- Common ancestry
- Scotch-Irish 8% Hispanic 3% Subsaharan African 3%
- Foreign-born
- 61% · Canada, Jamaica, Dominican Republic
- Languages at home
- 29% English-only · Spanish 45% Russian/Polish/Slavic 12% Other Indo-European 5%
Political lean MEDSL · Miami-Dade
- 2024 margin
- R (+11.4) · D 43.9% · R 55.4%
- 2008→2024 swing
- -27.6pp toward R · 2008: 16.1pp · 2024: -11.4pp
- All cycles
- 2024: R+11.4 2020: D+7.3 2016: D+29.6 2012: D+23.7 2008: D+16.1
Not yet ingested
- Civics
- —
Market trends
- HPI YoY
- ▲ 0.53%
- Current HPI
- 284.9293
- Rent YoY
- ▲ 0.94%
- Metro
- Miami-Fort Lauderdale-Pompano Beach, FL
- State GDP YoY
- ▲ 3.28%
- F500 in state
- 36
Industry mix (Fortune 500 HQ in FL)
| Industry | F500 HQs | Revenue |
|---|---|---|
| Industrial Technology | 2 | $29B |
|
||
| Insurance | 2 | $17B |
|
||
| Retail | 1 | $60B |
|
||
| Technology Distribution | 1 | $58B |
|
||
| Homebuilding | 1 | $35B |
|
||
| Technology Manufacturing | 1 | $35B |
|
||
Price history
-3.6% since first listed2 events — show timeline
- 2026-05-14 Price Changed $270,000 MARMLS
- 2026-03-25 Listed $280,000 MARMLS
Cash-flow waterfall
monthlySold comps — $/sqft
last 12 mo · ≤1 miLoading sold comps…