 Multi-family
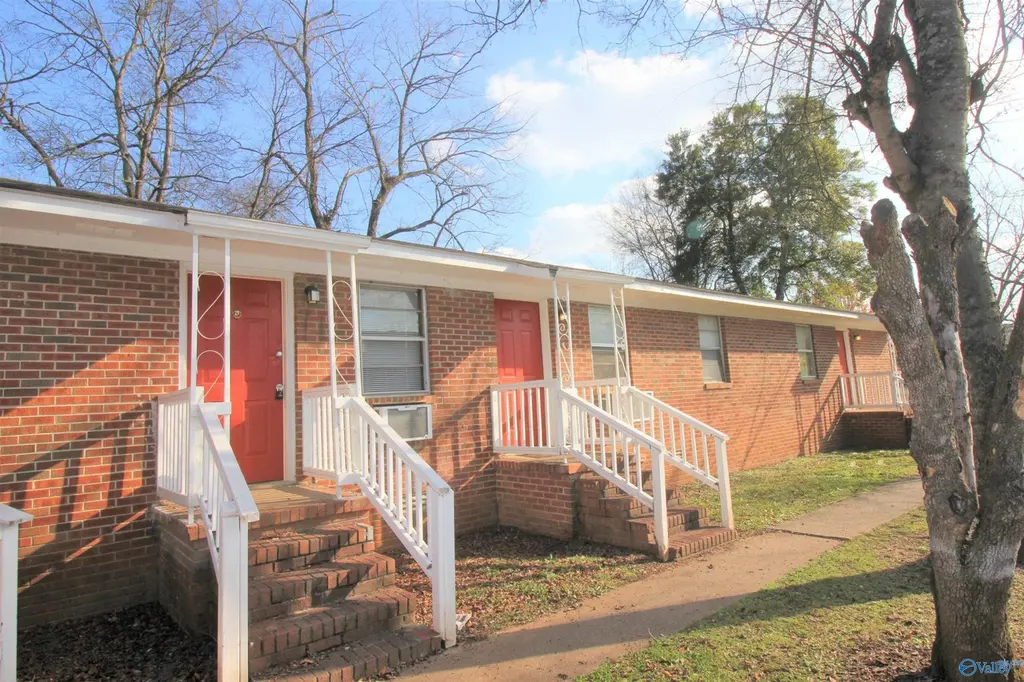
4100 Broyles Ave · Huntsville, AL
Flood risk No data
- FEMA flood zone
- —
- Chance of flooding over 30 yrs
- —
- Est. flood insurance / yr
- —
Fire risk No data
- Est. fire insurance / yr
- —
Heat risk No data
- Hot days now (above threshold)
- —
- Hot days in 30 yrs
- —
Wind risk No data
- Chance of severe wind over 30 yrs
- —
Air-quality risk No data
- Unhealthy air days now
- —
- Unhealthy air days in 30 yrs
- —
Risk factors via First Street. Map © Google.
Why this score? — see what drove the C+ grade
The composite is a weighted blend of 9 inputs, each scored 0–100. Each bar is that input's sub-score; the figure is the points it added to the 100-point composite (weight × sub-score).
- Cash flow +26.9/30.0
- DSCR +9.3/10.0
- ARV discount +7.5/15.0
- 1% rule +6.3/10.0
- Livability +4.1/5.0
- Rent growth +3.0/5.0
- Schools +2.9/10.0
- Condition / age +2.5/5.0
- Appreciation +0.0/10.0
$575,000
🖨 Deal sheet 📄 Offer letter ✓ Due diligence
Multi-family units
County records classify this as Multi-Family (5+ Unit). Listing-text estimate: 1 unit. estimate disagrees with records
5+ unit building — per-unit beds/baths from public records are typically unavailable; the breakdown below (if shown) is an estimate from the listing text.
Listing remarks MLS
Great investment property with lots of potential to add additional income value. 8 total units, with unit mix being 5 one bedrooms and 3 two bedroom units. Location is in close proximity to Redstone Arsenal and shopping, dining, with easy access to Memorial Parkway, 565, and downtown Huntsville. Roof, 2015. Some units have updated LVP flooring and new paint. Performance reports will be available upon request.
Key facts
- Total units
- Investment property
- New paint
Tags
Neighborhood map
What this means for you Summary
Snapshot
- This is a 3-bed/2.0-bath multifamily listed at $575k.
Deal economics
- At list price, monthly cash flow is $2k ($19k/yr) — positive.
- The deal already cash-flows at list — no discount required.
- Meets the 1% rule at list price ($7k rent vs $575k).
- Recommended offer: $506k (12.0% below list) — sets the bar for market timing.
- Cap rate 9.6% vs local median 3.8% in Huntsville — top-decile yield for the area; either an underpriced asset or a hidden risk that comps aren't pricing in. Stress-test before assuming the spread holds.
Location & tenants
- Location reads 82/100 on livability (#3 in AL, #1,082 nationally) — a professional / high-income tenant draw. Strengths: commute A+, cost of living A+, housing A+; Watch: crime F.
- Huntsville City (urban): math 21% / reading 46% proficiency, ranked #48 of 129 in AL (top 37%) — families likely to look elsewhere, expect single-tenant / working-renter base with shorter leases.
- Market conditions: Rents rising (+1.8%/yr); 133 active listings in the ZIP; lower-income renter base — watch delinquency; 4,709 units permitted in Madison County in 2024 (1,186 in 5+ unit buildings).
- At $6,514/mo this rent would consume 221% of the median local household income ($35k/yr) (locally 1750% of renters already pay >50% of income on rent) — very limited rent-growth headroom before tenants either downsize or default.
Forward outlook
- Local home prices are declining (-3.0%/yr); year-one equity from $4k of loan paydown is wiped out by about $17k of value loss. Plan a longer hold.
- Madison County population projected at +18% by 2050 — long-run rental-demand tailwind backs the buy-and-hold thesis.
Negotiation context
- It's been on market 136 days — a 12% lower offer ($506k) is reasonable based on typical stale-listing flexibility.
- 3 sale attempts since 12y ago with the ask held roughly flat each time — persistent listings suggest the price (not the market) is what's stuck; bring a comps-based counter.
- Current owner paid $185k; list at $575k implies a 211% gain — meaningful room to come down on a strong offer.
Questions for the listing agent
- It's been on market 136 days. Have you received any prior offers? Is the seller open to a 12% concession, seller financing, or rate buy-down credit?
- Built in 1964 — when were the roof, HVAC, electrical panel, plumbing, and water heater last replaced?
- Why hasn't it sold? Are there any deal-killer items the seller is aware of (foundation, flood, title, zoning, code violations)?
- Is there a deadline driving the sale (1031 exchange, divorce, estate, relocation)? That informs how much negotiation room exists.
- Crime grade is F in this area — have there been break-ins, vandalism, or insurance claims at this property in the last 3 years? What carrier currently insures it and at what premium?
- What's the average days-on-market for RENTAL listings here right now (not sales)? A rising rental-DOM trend means longer vacancies and softer asking-rent achievability than the comps imply.
- What's the recent tenant-quality profile in this submarket — average credit score on applications, eviction rate, late-payment / NSF rate, and stable-employment percentage? A property-management company in the area should have these aggregated.
- How much new apartment / multifamily construction is in the pipeline within 1–3 miles? Heavy new supply (>2% of stock underway) typically softens rents 12–24 months out; light construction supports rent growth.
Investment metrics
- 1% rule
- 1.13% ✓
- Cap rate
- 9.61%
- Cash-on-cash
- 11.83%
- DSCR
- 1.53
- GRM
- 7.4
CMA / ARV
- ARV (median comp)
- $219,161
- List price
- $575,000
- Delta
- 162.36%
- Verdict
- OVERPRICED
- Comps
- 20 within 1.0 mi
Projected returns pro-forma
-3.0% appreciation · 1.82% rent growth · sell at horizon
- IRR
- 0.0%
- Equity multiple
- 1.00×
- Total profit
- $136
- Equity at exit
- $85,734
- IRR
- 8.5%
- Equity multiple
- 1.62×
- Total profit
- $99,046
- Equity at exit
- $49,715
Cash invested: $161,000 (down + closing). Projections, not guarantees.
Landlord ↔ Tenant lean methodology
- Overall (STATE)
- 90 Strongly Landlord-Friendly
- State Alabama
- 90 Strongly Landlord-Friendly · R+15
- County
- — inherits STATE
- City
- — inherits STATE
ZIP-level market 35805
- Home prices YoY
- -17.4%
- Rents YoY
- 1.8%
- Active inventory
- 133
- Price-to-rent
- 60.4×
Monthly cashflow live
- Estimated rent
- $6,514 high interval (Pro) →
- Mortgage (P&I)
- −$3,015
- Tax from tax record
- −$304 /mo · $3,643/yr
- Insurance
- −$240
- HOA
- −$0
- Vacancy / Maint / Mgmt
- −$1,368
- Net cashflow
- $1,588
Break-even live
8-unit breakdown (identical units grouped — click to expand)
| Units | Beds | Baths | Est. rent |
|---|---|---|---|
| 5× units | 1 | 1 | $3,965 |
| #1 | 1 | 1 | $793 |
| #2 | 1 | 1 | $793 |
| #3 | 1 | 1 | $793 |
| #4 | 1 | 1 | $793 |
| #5 | 1 | 1 | $793 |
| 3× units | 2 | 1 | $2,550 |
| #6 | 2 | 1 | $850 |
| #7 | 2 | 1 | $850 |
| #8 | 2 | 1 | $850 |
| Total (8 units) | $6,514 | ||
UW: 25.0% down · 7.5% · 30yr · 1.5% tax · 5.0% vac · 8.0% maint · 8.0% mgmt
Financing live
Cash to close
- Down payment
- $143,750
- Closing costs
- $17,250
- Reserves months
- —
- Total cash needed
- —
Loan-product check · same deal, 3 products live
Conventional
25% down · 7.5% · 30yr
- Down + closing
- —
- Monthly P&I
- —
- Monthly cashflow
- —
- DSCR
- —
- Eligible?
- —
Personal DTI + credit; lowest rate.
DSCR
20% down · 8.5% · 30yr
- Down + closing
- —
- Monthly P&I
- —
- Monthly cashflow
- —
- DSCR
- —
- Eligible?
- —
No personal income docs; deal must DSCR.
Hard money
10% down · 12.0% · 12mo
- Down + closing
- —
- Monthly P&I
- —
- Monthly cashflow
- —
- DSCR
- —
- Eligible?
- —
Short-term bridge; refi at stabilization.
Listing history 23 events
-
2026-06-18days on market $575,000 Active 136 DOM
-
2026-06-17days on market $575,000 Active 135 DOM
-
2026-06-16days on market $575,000 Active 134 DOM
-
2026-06-15days on market $575,000 Active 133 DOM
-
2026-06-14days on market $575,000 Active 131 DOM
-
2026-06-10days on market $575,000 Active 128 DOM
-
2026-06-09days on market $575,000 Active 127 DOM
-
2026-06-08days on market $575,000 Active 126 DOM
-
2026-06-07days on market $575,000 Active 125 DOM
-
2026-06-03days on market $575,000 Active 121 DOM
-
2026-06-02days on market $575,000 Active 120 DOM
-
2026-06-01days on market $575,000 Active 119 DOM
-
2026-05-31days on market $575,000 Active 118 DOM
-
2026-05-30days on market $575,000 Active 117 DOM
-
2026-02-02$575,000 Active 412-char remark
Show marketing remark (412 chars)
Great investment property with lots of potential to add additional income value. 8 total units, with unit mix being 5 one bedrooms and 3 two bedroom units. Location is in close proximity to Redstone Arsenal and shopping, dining, with easy access to Memorial Parkway, 565, and downtown Huntsville. Roof, 2015. Some units have updated LVP flooring and new paint. Performance reports will be available upon request.
-
2018-12-28soldstatus $185,000
-
2018-10-19soldstatus $185,000 480-char remark
Show marketing remark (480 chars)
Affordable investment with added income potential. Ideal location close to Redstone Arsenal gate and convenient to shopping. New roof in 2015. Rents range between $260-$450/mo. (Two tenants are long-term at $260/mo. each) Area market rents are $375/mo. for one bedroom units and $475/mo. for two bedroom units. With upgrades and improvements market rents would be more. Viewing of the property is by appointment only. Property is sold as is. Tenants are not to be disturbed.
-
2018-10-19soldstatus $85,000
Show marketing remark (480 chars)
Affordable investment with added income potential. Ideal location close to Redstone Arsenal gate and convenient to shopping. New roof in 2015. Rents range between $260-$450/mo. (Two tenants are long-term at $260/mo. each) Area market rents are $375/mo. for one bedroom units and $475/mo. for two bedroom units. With upgrades and improvements market rents would be more. Viewing of the property is by appointment only. Property is sold as is. Tenants are not to be disturbed.
-
2018-07-15$199,900 480-char remark
Show marketing remark (480 chars)
Affordable investment with added income potential. Ideal location close to Redstone Arsenal gate and convenient to shopping. New roof in 2015. Rents range between $260-$450/mo. (Two tenants are long-term at $260/mo. each) Area market rents are $375/mo. for one bedroom units and $475/mo. for two bedroom units. With upgrades and improvements market rents would be more. Viewing of the property is by appointment only. Property is sold as is. Tenants are not to be disturbed.
-
2016-05-04soldstatus $150,000
-
2016-05-04soldstatus $150,000
-
2015-03-20soldstatus $105,000
-
2014-08-08$120,000
ⓘ Source: listings_history table (triggers on properties + properties_extension) + one-shot
backfill from property_details.listing_events for pre-trigger history.
Tax reassessment forecast AL · Resets to sale price
- Current annual tax
- $3,643 · $304/mo
- Projected year-2 tax
- $3,643 · $304/mo
- Expected delta
- $0/yr ($0/mo · -0.0%)
ⓘ Screening estimate from a state-policy table — verify with the county assessor before closing.
Nearby sold comps map
Loading sold comps map…
Walkable amenities ~0.75 mi
Loading nearby amenities…
Taxation est. · year 1
- Rental income
- $78,168
- − Mortgage interest
- −$32,209
- − Property taxes
- −$3,643
- − Insurance
- −$2,875
- − Repairs & maintenance
- −$6,253
- − Management
- −$6,253
- − Depreciation
- −$16,727
- Taxable income
- $10,207
- Est. tax owed @ 24.0%
- −$2,450
- After-tax cash flow
- $16,601/yr
For passive investors: Depreciation is non-cash, so a rental often shows a tax loss while cash-flowing — sheltering income. Rental losses are passive: they offset passive income freely, and up to $25,000/yr can offset ordinary (W-2) income if you actively participate and your MAGI is under $100k (phasing out to $0 by $150k); unused losses carry forward. On sale, claimed depreciation is recaptured at up to 25%, and gains may owe capital-gains tax (a 1031 exchange can defer both). Figures are a year-1 estimate at your 24.0% rate — not tax advice; consult a CPA.
Schools (NCES district)
- District
- Huntsville City
- NCES district ID
- 0101800
- Math proficiency
- 21% ▼ -23.00%
- Reading proficiency
- 46% ▬ 0.00%
- Median HH income
- $48,264
- Composite
- 28.84/100
- National rank
- #6647
- State rank
- #48 of 129 in AL
Livability — Huntsville
- Score
- 82/100
- State rank
- #3
- US rank
- #1082
Category grades
Schools grade is shown separately in the Schools card above.
Census & demographics
- Census place
- Huntsville, AL
- County
- Madison County · 380,832 people
- City population
- 220,435
- Metro
- Huntsville, AL
- Population (ZIP)
- 20,856
- Household income
- $35,385
- Rent vs Own
- Severe rent burden
- 1750.0
Population outlook (Madison County) Hauer SSP2
- Today (2025)
- 392,086 people
- By 2030
- 409,788 · +4.5%
- By 2040
- 440,557 · +12.4%
- By 2050
- 460,990 · +17.6%
- By 2075
- 502,872 · +28.3%
- By 2100
- 513,623 · +31.0%
Race, ethnicity, and origin ACS 2023
- Neighborhood character
- Diverse neighborhood (Simpson 0.69)
- Race & ethnicity
- White 40% Black 31% Hispanic / Latino 24% Two or more races 8%
- Hispanic origin (detail)
- Mexican 17% Puerto Rican 2%
- Common ancestry
- Lithuanian 1% Slovak 1% Serbian 1%
- Foreign-born
- 16% · Canada, Jamaica
- Languages at home
- 76% English-only · Spanish 22% German/W. Germanic 1%
Political lean MEDSL · Madison
- 2024 margin
- Lean R (+9.0) · D 44.7% · R 53.7% · Other 1.6%
- 2008→2024 swing
- +6.0pp toward D · 2008: -14.9pp · 2024: -9.0pp
- All cycles
- 2024: R+9.0 2020: R+8.0 2016: R+16.8 2012: R+18.7 2008: R+14.9
Not yet ingested
- Civics
- —
Market trends
- HPI YoY
- ▼ -48.03%
- Current HPI
- 228.6963
- Rent YoY
- ▲ 1.82%
- Metro
- Huntsville, AL
- State GDP YoY
- ▲ 2.94%
- F500 in state
- 4
Industry mix (Fortune 500 HQ in AL)
| Industry | F500 HQs | Revenue |
|---|---|---|
| Financial Services | 1 | $8B |
|
||
| Healthcare | 1 | $5B |
|
||
Price history
+379.2% since first listed9 events — show timeline
- 2026-02-02 Listed $575,000 VMLS
- 2018-12-28 Sold (Public Records) $185,000 Public Records
- 2018-10-19 Sold (Public Records) $85,000 Public Records
- 2018-10-19 Sold (MLS) $185,000 VMLS
- 2018-07-15 Listed $199,900 VMLS
- 2016-05-04 Sold (Public Records) $150,000 Public Records
- 2016-05-04 Sold (Public Records) $150,000 Public Records
- 2015-03-20 Sold (MLS) $105,000 VMLS
- 2014-08-08 Listed $120,000 VMLS
Property tax history
+11.4%/yrLatest (2024): $3,643 · +1.1% YoY. Source: county tax records.
Cash-flow waterfall
monthlySold comps — $/sqft
last 12 mo · ≤1 miLoading sold comps…