8249 N Us Hwy 87 · Grape Creek, TX
Flood risk 1/10 · Minimal
- FEMA flood zone
- X (shaded)
- Chance of flooding over 30 yrs
- 0.0%
- Est. flood insurance / yr
- $507 – $1,088
Fire risk 8/10 · Major
- Est. fire insurance / yr
- $1,222 – $2,270
Heat risk 7/10 · Major
- Hot days now (above 104°F)
- 7 days/yr
- Hot days in 30 yrs
- 23 days/yr
Wind risk 4/10 · Minor
- Chance of severe wind over 30 yrs
- 15.0%
Air-quality risk 2/10 · Minimal
- Unhealthy air days now
- 0 days/yr
- Unhealthy air days in 30 yrs
- 1 days/yr
Risk factors via First Street. Map © Google.
Why this score? — see what drove the B grade
The composite is a weighted blend of 9 inputs, each scored 0–100. Each bar is that input's sub-score; the figure is the points it added to the 100-point composite (weight × sub-score).
- Cash flow +24.0/30.0
- ARV discount +15.0/15.0
- Appreciation +10.0/10.0
- DSCR +7.7/10.0
- 1% rule +6.0/10.0
- Rent growth +3.9/5.0
- Livability +3.4/5.0
- Condition / age +2.5/5.0
- Schools +2.4/10.0
$149,900
🖨 Deal sheet (PDF) 📄 Offer letter ✓ Due diligence
Listing remarks
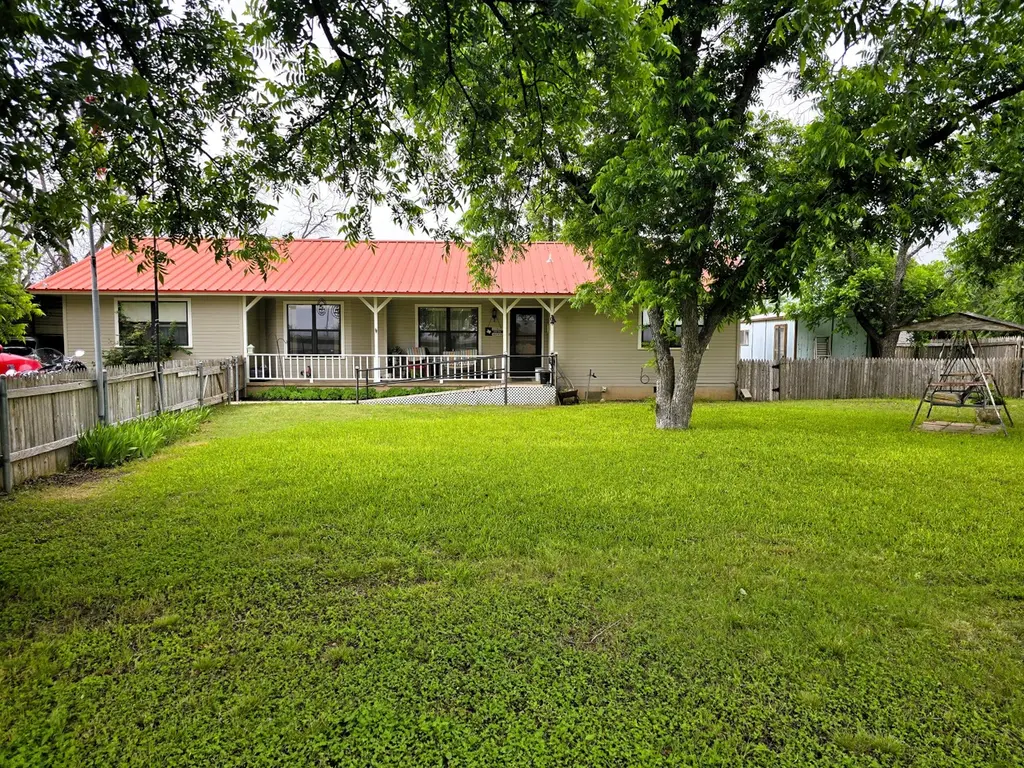
Come see this super clean home in Grape Creek! Located just minutes from Grape Creek schools and San Angelo, this 3-bedroom, 2-bath home offers a semi-open floorplan with a spacious kitchen and dining area, plus a split bedroom arrangement for added privacy. Enjoy the convenience of a large laundry room, central heat and air, and connection to the local rural water system—plus your own water well. With 1,497 sq ft of comfortable living space, this home is move-in ready and perfect for families or anyone seeking a peaceful retreat. The mature pecan trees are simply gorgeous. Schedule your showing today!
Key facts
- Mature pecan trees
- Water well
- Central heat and air
Tags
Property features AI
Finance
- HOA & community: No community features listed
Exterior
- Parking: Carport (2 spaces); Additional off-street parking
- Security: Smoke detector(s)
- Utilities: Public and well water available; Septic tank; Electricity connected; Water connected
- Home design: Single-family residence; One story; Residential property; Highway frontage; Interior, landscaped lot (approx. 0.23 acres; 100 x 100)
- Construction: Frame construction; Metal roof; Pillar/post/pier foundation; Built as a single-story structure
- Exterior features: Front porch; Chain link fencing; Outbuilding
Interior
- Kitchen: Dishwasher; Electric range; Microwave; Laminate countertops
- Bedrooms: Total rooms: 7
- Flooring: Carpet; Laminate
- Bathrooms: 2 full bathrooms
- Heating & cooling: Central heating (electric); Central air; Ceiling fans
- Interior features: Pantry; Storage; Laminate countertops; Ceiling fans; Double-pane windows; Smoke detector(s)
- Laundry & utility: Laundry room with washer and electric dryer hookups; Electric water heater
Neighborhood map
What this means for you Summary
Snapshot
- This is a 3-bed/2.0-bath single-family listed at $150k.
Deal economics
- At list price, monthly cash flow is $293 ($4k/yr) — positive.
- The deal already cash-flows at list — no discount required.
- Meets the 1% rule at list price ($2k rent vs $150k).
- Recommended offer: $145k (3.0% below list) — sets the bar for market timing.
- Cap rate 8.6% vs local median 2.6% in Grape Creek — top-decile yield for the area; either an underpriced asset or a hidden risk that comps aren't pricing in. Stress-test before assuming the spread holds.
Location & tenants
- Location reads 67/100 on livability (#545 in TX) — a middle-class / working-renter tenant base. Strengths: cost of living A+, housing A+, crime B; Watch: health & safety C-, amenities F, commute F.
- Grape Creek ISD (rural): math 25% / reading 29% proficiency, ranked #675 of 826 in TX (top 82%) — low school quality limits family demand, transient renter base, plan for 1-2y turnover.
- Zoned schools: Grape Creek Pri (316 students, 74% FRL); Grape Creek Middle (math 18% / reading 26%, grade F, #1,360 of 1,662 statewide, top 83%, 270 students, 60% FRL); Grape Creek H S (math 27% / reading 37%, grade F, #1,044 of 1,632 statewide, top 66%, 308 students, 63% FRL).
- Market conditions: Rents rising fast (+5.8%/yr); 334 active listings in the ZIP; 233 units permitted in Tom Green County in 2024 (0 in 5+ unit buildings).
Forward outlook
- In year one you build about $16k of equity ($1k loan paydown + $15k appreciation (10.0% local appreciation)).
- Tom Green County population projected at +35% by 2050 — long-run rental-demand tailwind backs the buy-and-hold thesis.
- At projected returns (10.0% appreciation + 5.8% rent growth), your $42k cash investment doubles in ~3 years — after that, you're playing with house money.
- By year 3, paydown + projected appreciation supports a ~$41k cash-out refi (75% LTV) — recoverable capital for the next deal without selling this one.
Negotiation context
- It's been on market 43 days — a 3% lower offer ($145k) is reasonable based on typical stale-listing flexibility.
- 5 sale attempts since 2y ago; this cycle's ask has dropped $50k (25%) from the opening price — seller is motivated, your offer sets the floor, not the list.
Risks & watch-outs
- Climate carrying-cost: severe wildfire risk; extreme-heat days projected 7→23/yr by 2055 (HVAC capex compounding) — expect insurance premiums to compound above CPI over the hold.
Questions for the listing agent
- It's been on market 43 days. Have you received any prior offers? Is the seller open to a 3% concession, seller financing, or rate buy-down credit?
- Is there a deadline driving the sale (1031 exchange, divorce, estate, relocation)? That informs how much negotiation room exists.
- Schools are F-rated, which usually means shorter tenancies and higher turnover. Who's the typical renter profile here, and what's been the actual vacancy rate?
- What's the average days-on-market for RENTAL listings here right now (not sales)? A rising rental-DOM trend means longer vacancies and softer asking-rent achievability than the comps imply.
- What's the recent tenant-quality profile in this submarket — average credit score on applications, eviction rate, late-payment / NSF rate, and stable-employment percentage? A property-management company in the area should have these aggregated.
- How much new for-sale + rental construction is in the pipeline within 1–3 miles? Heavy new supply typically softens prices + rents 12–24 months out; constrained supply supports both.
Investment metrics
- 1% rule
- 1.10% ✓
- Cap rate
- 8.64%
- Cash-on-cash
- 8.38%
- DSCR
- 1.37
- GRM
- 7.6
CMA / ARV
- ARV (median comp)
- $220,893
- List price
- $149,900
- Delta
- -32.14%
- Verdict
- UNDERPRICED
- Comps
- 20 within 1.0 mi
Show comp detail 10 sales within ~0.75 mi
| Address | Dist | Beds/Ba | Sqft | Sold | Price | $/sf | Match |
|---|---|---|---|---|---|---|---|
| 8586 Marigold Ave | 0.46mi | 3/2.5 | 1,508 (+1%) | 2mo | $160,000 | $106 | 74 |
| 8485 Marigold Ave | 0.36mi | 3/2.0 | 1,508 (+1%) | 12mo | $225,000 | $149 | 72 |
| 7585 Verbena St | 0.38mi | 3/1.5 | 1,456 (-3%) | 6mo | $189,000 | $130 | 70 |
| 8485 Burrell Rd | 0.25mi | 3/2.0 | 1,656 (+11%) | 14mo | $225,000 | $136 | 59 |
| 7490 Canna St | 0.67mi | 3/2.0 | 1,428 (-5%) | 5mo | $110,000 | $77 | 57 |
| 8850 Blue Quail Ln | 0.63mi | 3/2.0 | 1,478 (-1%) | 18mo | $250,000 | $169 | 53 |
| 7454 Canna St | 0.70mi | 4/2.5 (+1) | 1,426 (-5%) | 2mo | $239,000 | $168 | 51 |
| 8577 Marigold Ave | 0.43mi | 3/2.0 | 1,688 (+13%) | 9mo | $285,000 | $169 | 51 |
| 8625 Pansy Ave | 0.60mi | 3/2.0 | 1,424 (-5%) | 22mo | $184,900 | $130 | 45 |
| 8381 Petunia Ave | 0.55mi | 2/1.0 (-1) | 1,329 (-11%) | 12mo | $120,000 | $90 | 37 |
Match score weights: distance 35% · size 25% · config 20% · recency 20%. Top-matched comps best support the ARV.
Projected returns pro-forma
10.0% appreciation · 5.78% rent growth · sell at horizon
- IRR
- 31.6%
- Equity multiple
- 3.50×
- Total profit
- $105,042
- Equity at exit
- $135,042
- IRR
- 28.2%
- Equity multiple
- 8.28×
- Total profit
- $305,427
- Equity at exit
- $291,223
Cash invested: $41,972 (down + closing). Projections, not guarantees.
Landlord ↔ Tenant lean methodology
- Overall (STATE)
- 87 Strongly Landlord-Friendly
- State Texas
- 87 Strongly Landlord-Friendly · R+5
- County
- — inherits STATE
- City
- — inherits STATE
ZIP-level market 76901
- Home prices YoY
- 6.4%
- Rents YoY
- 5.8%
- Active inventory
- 334
- Price-to-rent
- 7.6×
Monthly cashflow live
- Estimated rent
- $1,648 medium interval (Pro) →
- Mortgage (P&I)
- −$786
- Tax from tax record
- −$160 /mo · $1,921/yr
- Insurance
- −$62
- HOA
- −$0
- Vacancy / Maint / Mgmt
- −$346
- Net cashflow
- $293
Break-even live
Sensitivity live
| Price | -10% $378 | -5% $335 | +0% $293 | +5% $251 | +10% $208 |
|---|---|---|---|---|---|
| Rent | -10% $163 | -5% $228 | +0% $293 | +5% $358 | +10% $423 |
| Rate | -1.0pp $368 | -0.5pp $331 | base $293 | +0.5pp $254 | +1.0pp $215 |
UW: 25.0% down · 7.5% · 30yr · 1.5% tax · 5.0% vac · 8.0% maint · 8.0% mgmt
Financing live
Cash to close
- Down payment
- $37,475
- Closing costs
- $4,497
- Reserves months
- —
- Total cash needed
- —
Loan-product check · same deal, 3 products live
Conventional
25% down · 7.5% · 30yr
- Down + closing
- —
- Monthly P&I
- —
- Monthly cashflow
- —
- DSCR
- —
- Eligible?
- —
Personal DTI + credit; lowest rate.
DSCR
20% down · 8.5% · 30yr
- Down + closing
- —
- Monthly P&I
- —
- Monthly cashflow
- —
- DSCR
- —
- Eligible?
- —
No personal income docs; deal must DSCR.
Hard money
10% down · 12.0% · 12mo
- Down + closing
- —
- Monthly P&I
- —
- Monthly cashflow
- —
- DSCR
- —
- Eligible?
- —
Short-term bridge; refi at stabilization.
Listing history 26 events
-
2026-06-22days on market $149,900 Active 43 DOM
-
2026-06-19days on market $149,900 Active 41 DOM
-
2026-06-18days on market $149,900 Active 40 DOM
-
2026-06-17days on market $149,900 Active 39 DOM
-
2026-06-16days on market $149,900 Active 38 DOM
-
2026-06-15days on market $149,900 Active 37 DOM
-
2026-06-14days on market $149,900 Active 35 DOM
-
2026-06-13pricedays on market $149,900 Active 34 DOM
-
2026-06-10days on market $164,900 Active 32 DOM
-
2026-06-09days on market $164,900 Active 31 DOM
-
2026-06-08days on market $164,900 Active 30 DOM
-
2026-06-07days on market $164,900 Active 29 DOM
-
2026-06-05statusdays on market $164,900 Active 26 DOM
-
2026-06-03status $164,900 Pending 25 DOM
-
2026-06-02days on market $164,900 Active 25 DOM
-
2026-06-01days on market $164,900 Active 24 DOM
-
2026-05-31days on market $164,900 Active 23 DOM
-
2026-05-30days on market $164,900 Active 22 DOM
-
2026-05-17price $179,900 615-char remark
-
2026-05-08$199,900 Active 615-char remark
-
2024-07-02status Pending
-
2024-06-22$185,580 Active
-
2024-06-10price $173,900
-
2024-05-24price $179,250
-
2024-05-07$185,580 Active
-
2024-04-26$185,580 Active
ⓘ Source: listings_history table (triggers on properties + properties_extension) + one-shot
backfill from property_details.listing_events for pre-trigger history.
Tax reassessment forecast TX · Resets to sale price
- Current annual tax
- $1,921 · $160/mo
- Projected year-2 tax
- $2,743 · $229/mo
- Expected delta
- +$822/yr (+$69/mo · 42.8%)
ⓘ Screening estimate from a state-policy table — verify with the county assessor before closing.
Climate risk First Street
- Flood 1/10 Low FEMA zone X (shaded) · 0% chance over 30 yrs
- Wildfire 8/10 Severe
- Heat 7/10 Severe 7 d/yr ≥104°F today · 23 d/yr by 30 yrs out
- Wind 4/10 Moderate 15% chance of damaging wind over 30 yrs
- Air quality 2/10 Low 0 unhealthy d/yr today · 1 by 30 yrs out
Nearby sold comps map
Loading sold comps map…
Walkable amenities ~0.75 mi
Loading nearby amenities…
Taxation est. · year 1
- Rental income
- $19,770
- − Mortgage interest
- −$8,397
- − Property taxes
- −$1,921
- − Insurance
- −$750
- − Repairs & maintenance
- −$1,582
- − Management
- −$1,582
- − Depreciation
- −$4,361
- Taxable income
- $1,179
- Est. tax owed @ 24.0%
- −$283
- After-tax cash flow
- $3,232/yr
For passive investors: Depreciation is non-cash, so a rental often shows a tax loss while cash-flowing — sheltering income. Rental losses are passive: they offset passive income freely, and up to $25,000/yr can offset ordinary (W-2) income if you actively participate and your MAGI is under $100k (phasing out to $0 by $150k); unused losses carry forward. On sale, claimed depreciation is recaptured at up to 25%, and gains may owe capital-gains tax (a 1031 exchange can defer both). Figures are a year-1 estimate at your 24.0% rate — not tax advice; consult a CPA.
Schools (NCES district)
- District
- Grape Creek ISD
- NCES district ID
- 4821600
- Math proficiency
- 25% ▼ -12.00%
- Reading proficiency
- 29% ▲ 1.00%
- Median HH income
- $48,891
- Composite
- 23.6/100
- National rank
- #7849
- State rank
- #675 of 826 in TX
Livability — Grape Creek
- Score
- 67/100
- State rank
- #545
- US rank
- #10581
Category grades
Schools grade is shown separately in the Schools card above.
Census & demographics
- Census place
- Grape Creek, TX
- County
- Tom Green County · 113,188 people
- Metro
- San Angelo, TX
- Population (ZIP)
- 31,831
- Household income
- $69,450
- Rent vs Own
- Severe rent burden
- 1034.0
Population outlook (Tom Green County) Hauer SSP2
- Today (2025)
- 135,110 people
- By 2030
- 144,090 · +6.6%
- By 2040
- 162,561 · +20.3%
- By 2050
- 182,158 · +34.8%
- By 2075
- 232,274 · +71.9%
- By 2100
- 268,218 · +98.5%
Race, ethnicity, and origin ACS 2023
- Neighborhood character
- Majority White (55%)
- Race & ethnicity
- White 55% Hispanic / Latino 41% Two or more races 17% Black 2%
- Hispanic origin (detail)
- Mexican 38%
- Common ancestry
- Lithuanian 3% Slovak 3% Iranian 1%
- Foreign-born
- 5% · Canada
- Languages at home
- 77% English-only · Spanish 21% German/W. Germanic 1%
Political lean MEDSL · Tom Green
- 2024 margin
- Solid R (+48.0) · D 25.5% · R 73.5% · Other 1.0%
- 2008→2024 swing
- -6.3pp toward R · 2008: -41.7pp · 2024: -48.0pp
- All cycles
- 2024: R+48.0 2020: R+44.4 2016: R+47.9 2012: R+47.9 2008: R+41.7
Not yet ingested
- Civics
- —
Market trends
- HPI YoY
- ▲ 47.96%
- Current HPI
- 798.58
- Rent YoY
- ▲ 5.78%
- Metro
- San Angelo, TX
- State GDP YoY
- ▲ 3.95%
- F500 in state
- 110
Industry mix (Fortune 500 HQ in TX)
| Industry | F500 HQs | Revenue |
|---|---|---|
| Energy | 16 | $1,198B |
|
||
| Technology | 5 | $198B |
|
||
| Engineering / Construction | 4 | $72B |
|
||
| Energy Services | 3 | $60B |
|
||
| Utilities | 3 | $41B |
|
||
| Healthcare | 2 | $330B |
|
||
Price history
-19.2% since first listed12 events — show timeline
- 2026-06-12 Price Changed $149,900 SAAR TX
- 2026-06-03 Relisted — SAAR TX
- 2026-06-02 Pending — SAAR TX
- 2026-05-30 Price Changed $164,900 SAAR TX
- 2026-05-17 Price Changed $179,900 SAAR TX
- 2026-05-08 Listed $199,900 SAAR TX
- 2024-07-02 Pending — SAAR TX
- 2024-06-22 Listed $185,580 SAAR TX
- 2024-06-10 Price Changed $173,900 SAAR TX
- 2024-05-24 Price Changed $179,250 SAAR TX
- 2024-05-07 Listed $185,580 SAAR TX
- 2024-04-26 Listed $185,580 SAAR TX
Property tax history
-1.4%/yrLatest (2025): $1,921 · -7.4% YoY. Source: county tax records.
Cash-flow waterfall
monthlySold comps — $/sqft
last 12 mo · ≤1 miLoading sold comps…