 98-Plex
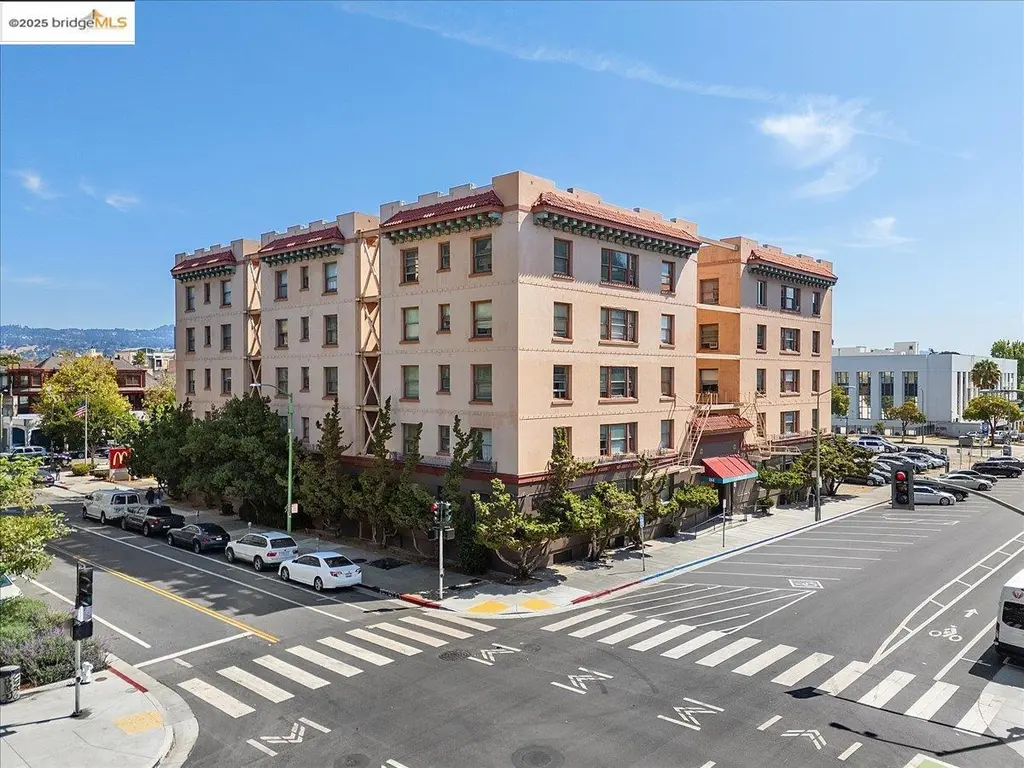
184 13th St · Oakland, CA
Flood risk 1/10 · Minimal
- FEMA flood zone
- X (unshaded)
- Chance of flooding over 30 yrs
- 0.0%
- Est. flood insurance / yr
- $507 – $1,088
Fire risk 1/10 · Minimal
- Est. fire insurance / yr
- $659 – $1,223
Heat risk 3/10 · Minor
- Hot days now (above 84°F)
- 7 days/yr
- Hot days in 30 yrs
- 14 days/yr
Wind risk 1/10 · Minimal
- Chance of severe wind over 30 yrs
- —
Air-quality risk 9/10 · Severe
- Unhealthy air days now
- 16 days/yr
- Unhealthy air days in 30 yrs
- 16 days/yr
Risk factors via First Street. Map © Google.
Why this score? — see what drove the A- grade
The composite is a weighted blend of 9 inputs, each scored 0–100. Each bar is that input's sub-score; the figure is the points it added to the 100-point composite (weight × sub-score).
- Cash flow +30.0/30.0
- ARV discount +15.0/15.0
- 1% rule +10.0/10.0
- DSCR +10.0/10.0
- Rent growth +4.3/5.0
- Livability +3.6/5.0
- Schools +3.0/10.0
- Condition / age +2.5/5.0
- Appreciation +2.3/10.0
$11,500,000
🖨 Deal sheet 📄 Offer letter ✓ Due diligence
Multi-family units
County records classify this as Multi-Family (5+ Unit). Listing-text estimate: 98 units. confirmed
5+ unit building — per-unit beds/baths from public records are typically unavailable; the breakdown below (if shown) is an estimate from the listing text.
Listing remarks MLS
184 13th Street is 98-unit multifamily investment opportunity in the heart of Downtown Oakland. This six-story, elevator-served building spans 76,562 square feet on a 16,000-square-foot corner parcel and features a well-balanced unit mix of studios, one-, two-, and three-bedroom apartments, along with secure lobby access, on-site laundry facilities, and a leasing office. The property has benefited from more than $500,000 in recent capital improvements, including electrical and plumbing upgrades, a new roof, and elevator modernization. Offered at just $126,020 per unit, the asset provides an exceptional entry point into one of Oakland’s most dynamic neighborhoods—less than three blocks from Lake Merritt. The property is being offered at a 33% discount to its 2022 sale price, creating an incredible basis and a rare opportunity to acquire a stabilized asset well below replacement cost.
Key facts
- Secure lobby access
- New roof
- 0.37 acre lot
Tags
Neighborhood map
What this means for you Summary
Snapshot
- This is a 98 × 1-bed/1-bath units multifamily listed at $11.50M.
Deal economics
- At list price, monthly cash flow is $90k ($1.08M/yr) — positive. Per door: $922/mo.
- The deal already cash-flows at list — no discount required.
- Meets the 1% rule at list price ($231k rent vs $11.50M).
- Recommended offer: $10.12M (12.0% below list) — sets the bar for market timing.
- Cap rate 15.7% vs local median 2.4% in Oakland — top-decile yield for the area; either an underpriced asset or a hidden risk that comps aren't pricing in. Stress-test before assuming the spread holds.
Location & tenants
- Location reads 71/100 on livability (#224 in CA) — a middle-class / working-renter tenant base. Strengths: amenities A+, commute A+, employment A+; Watch: schools C-, crime F, cost of living F.
- Oakland Unified (urban): math 27% / reading 33% proficiency, ranked #1,007 of 1,400 in CA (top 72%) — families likely to look elsewhere, expect single-tenant / working-renter base with shorter leases; 68% free/reduced lunch — lower-income household profile, screen leases tightly.
- Market conditions: Rents rising fast (+7.2%/yr); 37 active listings in the ZIP; 1,742 units permitted in Alameda County in 2024 (856 in 5+ unit buildings).
- At $230,689/mo this rent would consume 3739% of the median local household income ($74k/yr) (locally 2526% of renters already pay >50% of income on rent) — very limited rent-growth headroom before tenants either downsize or default.
Forward outlook
- Local home prices are declining (-3.0%/yr); year-one equity from $80k of loan paydown is wiped out by about $345k of value loss. Plan a longer hold.
- Alameda County population projected at +34% by 2050 — long-run rental-demand tailwind backs the buy-and-hold thesis.
- At projected returns (-3.0% appreciation + 7.2% rent growth), your $3.22M cash investment doubles in ~4 years — after that, you're playing with house money.
Negotiation context
- It's been on market 279 days — a 12% lower offer ($10.12M) is reasonable based on typical stale-listing flexibility.
Risks & watch-outs
- Watch-outs: property tax is 2.8% of price; built in 1920 — expect roof / HVAC / electrical / plumbing capex.
Questions for the listing agent
- It's been on market 279 days. Have you received any prior offers? Is the seller open to a 12% concession, seller financing, or rate buy-down credit?
- Can we see the unit-by-unit rent roll, current vacancy, and any below-market leases? What's the average tenancy length?
- What capital expenditures (roof, boiler, parking lot, exteriors) have been made in the last 5 years, and what's planned in the next 2?
- Built in 1920 — when were the roof, HVAC, electrical panel, plumbing, and water heater last replaced?
- Property tax is high relative to price — has the assessment been appealed recently, and will the sale trigger a re-assessment?
- Why hasn't it sold? Are there any deal-killer items the seller is aware of (foundation, flood, title, zoning, code violations)?
- Is there a deadline driving the sale (1031 exchange, divorce, estate, relocation)? That informs how much negotiation room exists.
- Crime grade is F in this area — have there been break-ins, vandalism, or insurance claims at this property in the last 3 years? What carrier currently insures it and at what premium?
- What's the average days-on-market for RENTAL listings here right now (not sales)? A rising rental-DOM trend means longer vacancies and softer asking-rent achievability than the comps imply.
- What's the recent tenant-quality profile in this submarket — average credit score on applications, eviction rate, late-payment / NSF rate, and stable-employment percentage? A property-management company in the area should have these aggregated.
- How much new apartment / multifamily construction is in the pipeline within 1–3 miles? Heavy new supply (>2% of stock underway) typically softens rents 12–24 months out; light construction supports rent growth.
Investment metrics
- 1% rule
- 2.01% ✓
- Cap rate
- 15.72%
- Cash-on-cash
- 33.66%
- DSCR
- 2.50
- GRM
- 4.2
CMA / ARV
- ARV (median comp)
- $21,122,583
- List price
- $11,500,000
- Delta
- -45.56%
- Verdict
- UNDERPRICED
- Comps
- 1 within 2.0 mi
Projected returns pro-forma
-3.0% appreciation · 7.23% rent growth · sell at horizon
- IRR
- 34.0%
- Equity multiple
- 2.53×
- Total profit
- $4,923,463
- Equity at exit
- $1,714,687
- IRR
- 43.3%
- Equity multiple
- 6.07×
- Total profit
- $16,323,227
- Equity at exit
- $994,310
Cash invested: $3,220,000 (down + closing). Projections, not guarantees.
Landlord ↔ Tenant lean methodology
- Overall (CITY)
- 0 Strongly Tenant-Friendly
- State California
- 18 Strongly Tenant-Friendly · D+13
- County
- — inherits STATE
- City Oakland
- 0 Strongly Tenant-Friendly · D+62
ZIP-level market 94612
- Home prices YoY
- -2.5%
- Rents YoY
- 7.2%
- Active inventory
- 37
- Price-to-rent
- 407.1×
Monthly cashflow live
- Estimated rent
- $230,689 high interval (Pro) →
- Mortgage (P&I)
- −$60,307
- Tax from tax record
- −$26,830 /mo · $321,963/yr
- Insurance
- −$4,792
- HOA
- −$0
- Vacancy / Maint / Mgmt
- −$48,445
- Net cashflow
- $90,315
Break-even live
98-unit breakdown (identical units grouped — click to expand)
| Units | Beds | Baths | Est. rent |
|---|---|---|---|
| 98× units | 1 | 1 | $230,692 |
| #1 | 1 | 1 | $2,354 |
| #2 | 1 | 1 | $2,354 |
| #3 | 1 | 1 | $2,354 |
| #4 | 1 | 1 | $2,354 |
| #5 | 1 | 1 | $2,354 |
| #6 | 1 | 1 | $2,354 |
| #7 | 1 | 1 | $2,354 |
| #8 | 1 | 1 | $2,354 |
| #9 | 1 | 1 | $2,354 |
| #10 | 1 | 1 | $2,354 |
| #11 | 1 | 1 | $2,354 |
| #12 | 1 | 1 | $2,354 |
| #13 | 1 | 1 | $2,354 |
| #14 | 1 | 1 | $2,354 |
| #15 | 1 | 1 | $2,354 |
| #16 | 1 | 1 | $2,354 |
| #17 | 1 | 1 | $2,354 |
| #18 | 1 | 1 | $2,354 |
| #19 | 1 | 1 | $2,354 |
| #20 | 1 | 1 | $2,354 |
| #21 | 1 | 1 | $2,354 |
| #22 | 1 | 1 | $2,354 |
| #23 | 1 | 1 | $2,354 |
| #24 | 1 | 1 | $2,354 |
| #25 | 1 | 1 | $2,354 |
| #26 | 1 | 1 | $2,354 |
| #27 | 1 | 1 | $2,354 |
| #28 | 1 | 1 | $2,354 |
| #29 | 1 | 1 | $2,354 |
| #30 | 1 | 1 | $2,354 |
| #31 | 1 | 1 | $2,354 |
| #32 | 1 | 1 | $2,354 |
| #33 | 1 | 1 | $2,354 |
| #34 | 1 | 1 | $2,354 |
| #35 | 1 | 1 | $2,354 |
| #36 | 1 | 1 | $2,354 |
| #37 | 1 | 1 | $2,354 |
| #38 | 1 | 1 | $2,354 |
| #39 | 1 | 1 | $2,354 |
| #40 | 1 | 1 | $2,354 |
| #41 | 1 | 1 | $2,354 |
| #42 | 1 | 1 | $2,354 |
| #43 | 1 | 1 | $2,354 |
| #44 | 1 | 1 | $2,354 |
| #45 | 1 | 1 | $2,354 |
| #46 | 1 | 1 | $2,354 |
| #47 | 1 | 1 | $2,354 |
| #48 | 1 | 1 | $2,354 |
| #49 | 1 | 1 | $2,354 |
| #50 | 1 | 1 | $2,354 |
| #51 | 1 | 1 | $2,354 |
| #52 | 1 | 1 | $2,354 |
| #53 | 1 | 1 | $2,354 |
| #54 | 1 | 1 | $2,354 |
| #55 | 1 | 1 | $2,354 |
| #56 | 1 | 1 | $2,354 |
| #57 | 1 | 1 | $2,354 |
| #58 | 1 | 1 | $2,354 |
| #59 | 1 | 1 | $2,354 |
| #60 | 1 | 1 | $2,354 |
| #61 | 1 | 1 | $2,354 |
| #62 | 1 | 1 | $2,354 |
| #63 | 1 | 1 | $2,354 |
| #64 | 1 | 1 | $2,354 |
| #65 | 1 | 1 | $2,354 |
| #66 | 1 | 1 | $2,354 |
| #67 | 1 | 1 | $2,354 |
| #68 | 1 | 1 | $2,354 |
| #69 | 1 | 1 | $2,354 |
| #70 | 1 | 1 | $2,354 |
| #71 | 1 | 1 | $2,354 |
| #72 | 1 | 1 | $2,354 |
| #73 | 1 | 1 | $2,354 |
| #74 | 1 | 1 | $2,354 |
| #75 | 1 | 1 | $2,354 |
| #76 | 1 | 1 | $2,354 |
| #77 | 1 | 1 | $2,354 |
| #78 | 1 | 1 | $2,354 |
| #79 | 1 | 1 | $2,354 |
| #80 | 1 | 1 | $2,354 |
| #81 | 1 | 1 | $2,354 |
| #82 | 1 | 1 | $2,354 |
| #83 | 1 | 1 | $2,354 |
| #84 | 1 | 1 | $2,354 |
| #85 | 1 | 1 | $2,354 |
| #86 | 1 | 1 | $2,354 |
| #87 | 1 | 1 | $2,354 |
| #88 | 1 | 1 | $2,354 |
| #89 | 1 | 1 | $2,354 |
| #90 | 1 | 1 | $2,354 |
| #91 | 1 | 1 | $2,354 |
| #92 | 1 | 1 | $2,354 |
| #93 | 1 | 1 | $2,354 |
| #94 | 1 | 1 | $2,354 |
| #95 | 1 | 1 | $2,354 |
| #96 | 1 | 1 | $2,354 |
| #97 | 1 | 1 | $2,354 |
| #98 | 1 | 1 | $2,354 |
| Total (98 units) | $230,689 | ||
UW: 25.0% down · 7.5% · 30yr · 1.5% tax · 5.0% vac · 8.0% maint · 8.0% mgmt
Financing live
Cash to close
- Down payment
- $2,875,000
- Closing costs
- $345,000
- Reserves months
- —
- Total cash needed
- —
Loan-product check · same deal, 3 products live
Conventional
25% down · 7.5% · 30yr
- Down + closing
- —
- Monthly P&I
- —
- Monthly cashflow
- —
- DSCR
- —
- Eligible?
- —
Personal DTI + credit; lowest rate.
DSCR
20% down · 8.5% · 30yr
- Down + closing
- —
- Monthly P&I
- —
- Monthly cashflow
- —
- DSCR
- —
- Eligible?
- —
No personal income docs; deal must DSCR.
Hard money
10% down · 12.0% · 12mo
- Down + closing
- —
- Monthly P&I
- —
- Monthly cashflow
- —
- DSCR
- —
- Eligible?
- —
Short-term bridge; refi at stabilization.
Listing history 18 events
-
2026-06-18days on market $11,500,000 Active 279 DOM
-
2026-06-17days on market $11,500,000 Active 278 DOM
-
2026-06-16days on market $11,500,000 Active 277 DOM
-
2026-06-15days on market $11,500,000 Active 276 DOM
-
2026-06-13days on market $11,500,000 Active 274 DOM
-
2026-06-13days on market $11,500,000 Active 273 DOM
-
2026-06-09days on market $11,500,000 Active 270 DOM
-
2026-06-08days on market $11,500,000 Active 269 DOM
-
2026-06-07days on market $11,500,000 Active 268 DOM
-
2026-06-04days on market $11,500,000 Active 265 DOM
-
2026-06-03days on market $11,500,000 Active 264 DOM
-
2026-06-02days on market $11,500,000 Active 263 DOM
-
2026-06-01days on market $11,500,000 Active 262 DOM
-
2026-05-31days on market $11,500,000 Active 261 DOM
-
2025-11-04price $11,500,000 907-char remark
Show marketing remark (907 chars)
184 13th Street is 98-unit multifamily investment opportunity in the heart of Downtown Oakland. This six-story, elevator-served building spans 76,562 square feet on a 16,000-square-foot corner parcel and features a well-balanced unit mix of studios, one-, two-, and three-bedroom apartments, along with secure lobby access, on-site laundry facilities, and a leasing office. The property has benefited from more than $500,000 in recent capital improvements, including electrical and plumbing upgrades, a new roof, and elevator modernization. Offered at just $126,020 per unit, the asset provides an exceptional entry point into one of Oakland’s most dynamic neighborhoods—less than three blocks from Lake Merritt. The property is being offered at a 33% discount to its 2022 sale price, creating an incredible basis and a rare opportunity to acquire a stabilized asset well below replacement cost.
-
2025-09-12$12,350,000 Active 907-char remark
Show marketing remark (907 chars)
184 13th Street is 98-unit multifamily investment opportunity in the heart of Downtown Oakland. This six-story, elevator-served building spans 76,562 square feet on a 16,000-square-foot corner parcel and features a well-balanced unit mix of studios, one-, two-, and three-bedroom apartments, along with secure lobby access, on-site laundry facilities, and a leasing office. The property has benefited from more than $500,000 in recent capital improvements, including electrical and plumbing upgrades, a new roof, and elevator modernization. Offered at just $126,020 per unit, the asset provides an exceptional entry point into one of Oakland’s most dynamic neighborhoods—less than three blocks from Lake Merritt. The property is being offered at a 33% discount to its 2022 sale price, creating an incredible basis and a rare opportunity to acquire a stabilized asset well below replacement cost.
-
2022-04-26soldstatus $18,500,000
-
1997-07-10soldstatus $1,650,000
ⓘ Source: listings_history table (triggers on properties + properties_extension) + one-shot
backfill from property_details.listing_events for pre-trigger history.
Tax reassessment forecast CA · Resets to sale price
- Current annual tax
- $321,963 · $26,830/mo
- Projected year-2 tax
- $321,963 · $26,830/mo
- Expected delta
- $0/yr ($0/mo · 0.0%)
ⓘ Screening estimate from a state-policy table — verify with the county assessor before closing.
Climate risk First Street
- Flood 1/10 Low FEMA zone X (unshaded) · 0% chance over 30 yrs
- Wildfire 1/10 Low
- Heat 3/10 Moderate 7 d/yr ≥84°F today · 14 d/yr by 30 yrs out
- Wind 1/10 Low
- Air quality 9/10 Extreme 16 unhealthy d/yr today · 16 by 30 yrs out
Nearby sold comps map
Loading sold comps map…
Walkable amenities ~0.75 mi
Loading nearby amenities…
Taxation est. · year 1
- Rental income
- $2,768,268
- − Mortgage interest
- −$644,179
- − Property taxes
- −$321,963
- − Insurance
- −$57,500
- − Repairs & maintenance
- −$221,461
- − Management
- −$221,461
- − Depreciation
- −$334,545
- Taxable income
- $967,158
- Est. tax owed @ 24.0%
- −$232,118
- After-tax cash flow
- $851,664/yr
For passive investors: Depreciation is non-cash, so a rental often shows a tax loss while cash-flowing — sheltering income. Rental losses are passive: they offset passive income freely, and up to $25,000/yr can offset ordinary (W-2) income if you actively participate and your MAGI is under $100k (phasing out to $0 by $150k); unused losses carry forward. On sale, claimed depreciation is recaptured at up to 25%, and gains may owe capital-gains tax (a 1031 exchange can defer both). Figures are a year-1 estimate at your 24.0% rate — not tax advice; consult a CPA.
Schools (NCES district)
- District
- Oakland Unified
- NCES district ID
- 0628050
- Math proficiency
- 27% ▬ 0.00%
- Reading proficiency
- 33% ▬ 0.00%
- Median HH income
- $55,194
- Composite
- 29.52/100
- National rank
- #11769
- State rank
- #1007 of 1400 in CA
Livability — Oakland
- Score
- 71/100
- State rank
- #224
- US rank
- #7245
Category grades
Schools grade is shown separately in the Schools card above.
Census & demographics
- Census place
- Oakland, CA
- County
- Alameda County · 1,614,355 people
- City population
- 385,993
- Metro
- San Francisco-Oakland-Berkeley, CA
- Population (ZIP)
- 18,175
- Household income
- $74,037
- Rent vs Own
- Severe rent burden
- 2526.0
Population outlook (Alameda County) Hauer SSP2
- Today (2025)
- 1,928,884 people
- By 2030
- 2,069,146 · +7.3%
- By 2040
- 2,338,405 · +21.2%
- By 2050
- 2,586,608 · +34.1%
- By 2075
- 3,061,911 · +58.7%
- By 2100
- 3,234,133 · +67.7%
Race, ethnicity, and origin ACS 2023
- Neighborhood character
- Highly diverse neighborhood (Simpson 0.76)
- Race & ethnicity
- White 30% Asian 27% Black 26% Hispanic / Latino 10% Two or more races 8%
- Hispanic origin (detail)
- Mexican 7%
- Common ancestry
- Romanian 2% Slovak 2% Italian 2%
- Foreign-born
- 32% · China, Canada, South Korea
- Languages at home
- 65% English-only · Chinese 14% Spanish 5% Other Indo-European 3%
Political lean MEDSL · Alameda
- 2024 margin
- Solid D (+53.6) · D 74.6% · R 21.0% · Other 4.4%
- 2008→2024 swing
- -5.9pp toward R · 2008: 59.5pp · 2024: 53.6pp
- All cycles
- 2024: D+53.6 2020: D+62.5 2016: D+64.4 2012: D+59.8 2008: D+59.5
Not yet ingested
- Civics
- —
Market trends
- HPI YoY
- ▼ -5.34%
- Current HPI
- 212.2879
- Rent YoY
- ▲ 7.23%
- Metro
- San Francisco-Oakland-Berkeley, CA
- State GDP YoY
- ▲ 3.21%
- F500 in state
- 116
Industry mix (Fortune 500 HQ in CA)
| Industry | F500 HQs | Revenue |
|---|---|---|
| Technology | 27 | $1,492B |
|
||
| Financial Services | 3 | $174B |
|
||
| Retail | 3 | $44B |
|
||
| Insurance | 3 | $26B |
|
||
| Media / Entertainment | 2 | $115B |
|
||
| Pharmaceuticals / Biotech | 2 | $62B |
|
||
Price history
+597.0% since first listed4 events — show timeline
- 2025-11-04 Price Changed $11,500,000 bridgeMLS, Bay East AOR, or Contra Costa AOR
- 2025-09-12 Listed $12,350,000 bridgeMLS, Bay East AOR, or Contra Costa AOR
- 2022-04-26 Sold (Public Records) $18,500,000 Public Records
- 1997-07-10 Sold (Public Records) $1,650,000 Public Records
Property tax history
+13.2%/yrLatest (2025): $321,963 · +6.0% YoY. Source: county tax records.
Cash-flow waterfall
monthlySold comps — $/sqft
last 12 mo · ≤1 miLoading sold comps…