 Fourplex
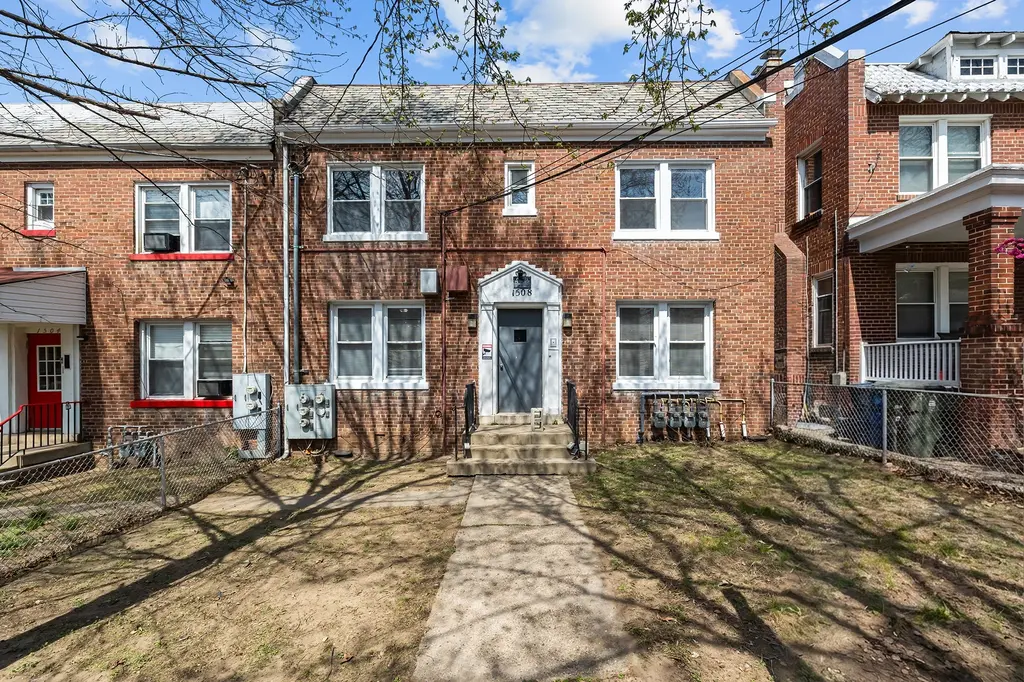
1508 V St SE · Washington, DC
Flood risk 1/10 · Minimal
- FEMA flood zone
- X (unshaded)
- Chance of flooding over 30 yrs
- 0.0%
- Est. flood insurance / yr
- $507 – $1,088
Fire risk 1/10 · Minimal
- Est. fire insurance / yr
- $631 – $1,173
Heat risk 8/10 · Major
- Hot days now (above 104°F)
- 7 days/yr
- Hot days in 30 yrs
- 15 days/yr
Wind risk 4/10 · Minor
- Chance of severe wind over 30 yrs
- 20.0%
Air-quality risk 4/10 · Minor
- Unhealthy air days now
- 4 days/yr
- Unhealthy air days in 30 yrs
- 5 days/yr
Risk factors via First Street. Map © Google.
Why this score? — see what drove the D+ grade
The composite is a weighted blend of 9 inputs, each scored 0–100. Each bar is that input's sub-score; the figure is the points it added to the 100-point composite (weight × sub-score).
- Cash flow +21.8/30.0
- DSCR +7.0/10.0
- 1% rule +5.2/10.0
- Livability +3.7/5.0
- Schools +3.6/10.0
- Rent growth +3.5/5.0
- Condition / age +2.5/5.0
- ARV discount +0.0/15.0
- Appreciation +0.0/10.0
$740,000
🖨 Deal sheet 📄 Offer letter ✓ Due diligence
Multi-family units
County records classify this as Multi-Family (2-4 Unit). Listing-text estimate: 4 units. confirmed
Listing remarks
1508 V St SE is a fully vacant four-unit quadruplex situated in the Anacostia neighborhood, just minutes from the Anacostia Metro Station and provides easy access to Downtown DC, Navy Yard, and Capitol Hill. The property features four 2-bedroom, 1-bath units with functional layouts designed for comfortable and functional living. Delivered completely vacant, the property offers the opportunity to lease all units immediately or implement upgrades prior to leasing to further enhance income potential. Residents will also enjoy close proximity to popular neighborhood spots like Grounded Cafe and Wellness Studio, Capital One Cafe, and Busboys and Poets, adding convenience and lifestyle appeal. Th
Key facts
- 4,182 sq ft lot
- Built 1936
- Listed 72 days
Tags
Property features AI
Finance
- Financial info: Four-unit multifamily building with all units currently listed (4 vacant units noted)
Exterior
- Parking: On-street parking
- Utilities: Public water; Public sewer; Electric cooling fuel; Natural gas hot water
- Home design: End of row/townhouse structure; Fee simple ownership
- Construction: Brick construction; Crawl space foundation; Above-grade and below-grade structures noted
- Exterior features: No tidal water
Interior
- Bedrooms: Four 2-bedroom units (Unit 1, Unit 2, Unit 3, Unit 4)
- Heating & cooling: Central heating; Central air conditioning; Natural gas for heating and hot water
- Interior features: Assessor as source for living area
- Laundry & utility: Washer and dryer located in each unit
Neighborhood map
What this means for you Summary
Snapshot
- This is a 4 × 2-bed/1-bath units multifamily listed at $740k.
Deal economics
- At list price, monthly cash flow is $1k ($14k/yr) — positive. Per door: $289/mo.
- The deal already cash-flows at list — no discount required.
- Meets the 1% rule at list price ($8k rent vs $740k).
- Recommended offer: $696k (6.0% below list) — sets the bar for market timing.
- Cap rate 8.2% vs local median 2.5% in Washington — top-decile yield for the area; either an underpriced asset or a hidden risk that comps aren't pricing in. Stress-test before assuming the spread holds.
Location & tenants
- Location reads 73/100 on livability (#1 in DC) — a middle-class / working-renter tenant base. Strengths: amenities A+, commute A+, employment A+; Watch: crime F, cost of living F.
- District Of Columbia Public Schools (urban): math 33% / reading 40% proficiency, ranked #8 of 32 in DC (top 25%) — families likely to look elsewhere, expect single-tenant / working-renter base with shorter leases; 65% free/reduced lunch — lower-income household profile, screen leases tightly.
- Zoned schools: Kramer Ms (203 students, 0% FRL); Anacostia Hs (287 students, 0% FRL) — zoned schools average 0% FRL vs 65% district-wide (65 pts lower); this property's tenant base skews higher-income than the district average.
- Market conditions: Rents rising (+3.9%/yr); 296 active listings in the ZIP; 12 comparable units currently listed for rent nearby; rentals at typical pace (median 24d on market — plan ~3-4 weeks tenant-placement turnaround); 1,737 units permitted in District of Columbia in 2024 (1,506 in 5+ unit buildings).
- At $7,527/mo this rent would consume 167% of the median local household income ($54k/yr) (locally 5148% of renters already pay >50% of income on rent) — very limited rent-growth headroom before tenants either downsize or default.
Forward outlook
- Local home prices are declining (-3.0%/yr); year-one equity from $5k of loan paydown is wiped out by about $22k of value loss. Plan a longer hold.
- District of Columbia County population projected at +50% by 2050 — long-run rental-demand tailwind backs the buy-and-hold thesis.
Negotiation context
- It's been on market 72 days — a 6% lower offer ($696k) is reasonable based on typical stale-listing flexibility.
- 18 sale attempts since 17y ago with the ask held roughly flat each time — persistent listings suggest the price (not the market) is what's stuck; bring a comps-based counter.
Risks & watch-outs
- Watch-outs: built in 1936 — expect roof / HVAC / electrical / plumbing capex.
- Climate carrying-cost: extreme-heat days projected 7→15/yr by 2055 (HVAC capex compounding) — expect insurance premiums to compound above CPI over the hold.
Questions for the listing agent
- It's been on market 72 days. Have you received any prior offers? Is the seller open to a 6% concession, seller financing, or rate buy-down credit?
- Can we see the unit-by-unit rent roll, current vacancy, and any below-market leases? What's the average tenancy length?
- What capital expenditures (roof, boiler, parking lot, exteriors) have been made in the last 5 years, and what's planned in the next 2?
- Built in 1936 — when were the roof, HVAC, electrical panel, plumbing, and water heater last replaced?
- Why hasn't it sold? Are there any deal-killer items the seller is aware of (foundation, flood, title, zoning, code violations)?
- Is there a deadline driving the sale (1031 exchange, divorce, estate, relocation)? That informs how much negotiation room exists.
- Crime grade is F in this area — have there been break-ins, vandalism, or insurance claims at this property in the last 3 years? What carrier currently insures it and at what premium?
- The area grade is low — what's the realistic commute time and amenity access for the typical tenant pool here? Any planned neighborhood developments (good or bad) we should know about?
- What's the average days-on-market for RENTAL listings here right now (not sales)? A rising rental-DOM trend means longer vacancies and softer asking-rent achievability than the comps imply.
- What's the recent tenant-quality profile in this submarket — average credit score on applications, eviction rate, late-payment / NSF rate, and stable-employment percentage? A property-management company in the area should have these aggregated.
- How much new apartment / multifamily construction is in the pipeline within 1–3 miles? Heavy new supply (>2% of stock underway) typically softens rents 12–24 months out; light construction supports rent growth.
Investment metrics
- 1% rule
- 1.02% ✓
- Cap rate
- 8.17%
- Cash-on-cash
- 6.69%
- DSCR
- 1.30
- GRM
- 8.2
CMA / ARV
- ARV (on-the-fly)
- $550,964
- Comps found
- 1
Show comp detail 1 sale within ~0.75 mi
| Address | Dist | Beds/Ba | Sqft | Sold | Price | $/sf | Match |
|---|---|---|---|---|---|---|---|
| 1515 17th St SE | 0.47mi | 4/— | 2,720 (-11%) | 3mo | $492,500 | $181 | 58 |
Match score weights: distance 35% · size 25% · config 20% · recency 20%. Top-matched comps best support the ARV.
Projected returns pro-forma
-3.0% appreciation · 3.86% rent growth · sell at horizon
- IRR
- -5.1%
- Equity multiple
- 0.81×
- Total profit
- $-39,871
- Equity at exit
- $110,336
- IRR
- 5.5%
- Equity multiple
- 1.42×
- Total profit
- $87,084
- Equity at exit
- $63,982
Cash invested: $207,200 (down + closing). Projections, not guarantees.
Landlord ↔ Tenant lean methodology
- Overall (CITY)
- 0 Strongly Tenant-Friendly
- State District of Columbia
- 12 Strongly Tenant-Friendly · D+43
- County
- — inherits STATE
- City Washington
- 0 Strongly Tenant-Friendly · D+43
ZIP-level market 20020
- Rents YoY
- 3.9%
- Active inventory
- 296
- Price-to-rent
- 32.8×
Monthly cashflow live
- Estimated rent
- $7,527 high interval (Pro) →
- Mortgage (P&I)
- −$3,881
- Tax from tax record
- −$602 /mo · $7,229/yr
- Insurance
- −$308
- HOA
- −$0
- Vacancy / Maint / Mgmt
- −$1,581
- Net cashflow
- $1,155
Break-even live
4-unit breakdown (identical units grouped — click to expand)
| Units | Beds | Baths | Est. rent |
|---|---|---|---|
| 4× units | 2 | 1 | $7,528 |
| #1 | 2 | 1 | $1,882 |
| #2 | 2 | 1 | $1,882 |
| #3 | 2 | 1 | $1,882 |
| #4 | 2 | 1 | $1,882 |
| Total (4 units) | $7,527 | ||
UW: 25.0% down · 7.5% · 30yr · 1.5% tax · 5.0% vac · 8.0% maint · 8.0% mgmt
Financing live
Cash to close
- Down payment
- $185,000
- Closing costs
- $22,200
- Reserves months
- —
- Total cash needed
- —
Loan-product check · same deal, 3 products live
Conventional
25% down · 7.5% · 30yr
- Down + closing
- —
- Monthly P&I
- —
- Monthly cashflow
- —
- DSCR
- —
- Eligible?
- —
Personal DTI + credit; lowest rate.
DSCR
20% down · 8.5% · 30yr
- Down + closing
- —
- Monthly P&I
- —
- Monthly cashflow
- —
- DSCR
- —
- Eligible?
- —
No personal income docs; deal must DSCR.
Hard money
10% down · 12.0% · 12mo
- Down + closing
- —
- Monthly P&I
- —
- Monthly cashflow
- —
- DSCR
- —
- Eligible?
- —
Short-term bridge; refi at stabilization.
Rent comps 12 comps
| Address | Beds | Baths | Sqft | Rent | $/sqft | DOM | Units | Dist |
|---|---|---|---|---|---|---|---|---|
| 1505 West St SE Unit 1 Washington, DC | 3.0 | 2.5 | 2100 | $3,300 | $1.57 | 1d | 1 | 0.10mi |
| 1325 Valley Pl SE Washington, DC | 4.0 | 2.0 | 2138 | $6,500 | $3.04 | 24d | 1 | 0.30mi |
| 2390 Elvans Rd SE Washington, DC | 3.0 | 2.5 | 2176 | $3,190 | $1.47 | 7d | 1 | 0.73mi |
| 2520 Elvans Rd SE Washington, DC | 3.0 | 2.5 | 2760 | $3,800 | $1.38 | 24d | 1 | 0.84mi |
| 2530 Elvans Rd SE Unit B Washington, DC | 5.0 | 3.5 | 2760 | $7,500 | $2.72 | 7d | 1 | 0.85mi |
| 3010 V Pl SE Washington, DC | 4.0 | 3.0 | 2232 | $3,500 | $1.57 | 24d | 1 | 1.01mi |
| 1354 Pennsylvania Ave SE Washington, DC | 3.0 | 2.5 | 3200 | $4,500 | $1.41 | 7d | 1 | 1.10mi |
| 2928 Nelson Pl SE Unit 1 Washington, DC | 3.0 | 1.0 | 2720 | $2,300 | $0.85 | 24d | 1 | 1.19mi |
| 1205 30th St SE Washington, DC | 3.0 | 1.0 | 3480 | $1,750 | $0.50 | 24d | 1 | 1.20mi |
| 2121 32nd Pl SE Unit Main Washington, DC | 3.0 | 3.0 | 3100 | $5,500 | $1.77 | 21d | 1 | 1.20mi |
| 1016 G St SE Washington, DC | 3.0 | 2.5 | 2277 | $6,000 | $2.64 | 24d | 1 | 1.24mi |
| 629 S Carolina Ave SE Washington, DC | 4.0 | 4.5 | 4069 | $12,000 | $2.95 | 5d | 1 | 1.48mi |
Listing history 50 events
-
2026-06-18days on market $740,000 Active 72 DOM
-
2026-06-17days on market $740,000 Active 71 DOM
-
2026-06-16days on market $740,000 Active 70 DOM
-
2026-06-15days on market $740,000 Active 69 DOM
-
2026-06-13days on market $740,000 Active 67 DOM
-
2026-06-09days on market $740,000 Active 63 DOM
-
2026-06-08days on market $740,000 Active 62 DOM
-
2026-06-07days on market $740,000 Active 61 DOM
-
2026-06-04days on market $740,000 Active 58 DOM
-
2026-06-03days on market $740,000 Active 57 DOM
-
2026-06-02days on market $740,000 Active 56 DOM
-
2026-06-01days on market $740,000 Active 55 DOM
-
2026-05-31pricedays on market $740,000 Active 54 DOM
-
2026-04-28price $750,000
-
2026-04-07$775,000 Active
-
2026-01-31historical
-
2026-01-07price $799,900
-
2025-10-23$814,900 Active
-
2025-10-23historical
-
2025-08-18$815,000 Active
-
2025-07-30historical
-
2025-07-30$820,000
-
2025-06-13historical
-
2025-05-28status Active
-
2025-04-10status Pending
-
2025-04-08$820,000 Active
-
2025-04-04historical
-
2025-04-01historical
-
2025-03-14$850,000 Active
-
2024-07-22soldstatus $700,000
-
2024-07-05soldstatus $700,000 Closed
-
2024-06-07historical Active Under Contract
-
2024-04-05status Active
-
2024-03-28historical
-
2024-03-28$749,000 Active
-
2024-03-20historical
-
2023-12-01historical Active Under Contract
-
2023-11-17status Active
-
2023-11-16historical
-
2023-09-19price $749,000
-
2023-08-25$800,000 Active
-
2022-10-15historical
-
2022-09-19status Active
-
2022-09-17historical
-
2022-08-05price $870,000
-
2022-06-27$895,000 Active
-
2022-06-27historical
-
2022-06-03$895,000 Active
-
2022-02-28price $1,250
-
2013-09-04soldstatus $400,000
ⓘ Source: listings_history table (triggers on properties + properties_extension) + one-shot
backfill from property_details.listing_events for pre-trigger history.
Tax reassessment forecast DC · Partial reset (capped growth)
- Current annual tax
- $7,229 · $602/mo
- Projected year-2 tax
- $7,229 · $602/mo
- Expected delta
- $0/yr ($0/mo · 0.0%)
ⓘ Screening estimate from a state-policy table — verify with the county assessor before closing.
Climate risk First Street
- Flood 1/10 Low FEMA zone X (unshaded) · 0% chance over 30 yrs
- Wildfire 1/10 Low
- Heat 8/10 Severe 7 d/yr ≥104°F today · 15 d/yr by 30 yrs out
- Wind 4/10 Moderate 20% chance of damaging wind over 30 yrs
- Air quality 4/10 Moderate 4 unhealthy d/yr today · 5 by 30 yrs out
Nearby sold comps map
Loading sold comps map…
Walkable amenities ~0.75 mi
Loading nearby amenities…
Taxation est. · year 1
- Rental income
- $90,324
- − Mortgage interest
- −$41,452
- − Property taxes
- −$7,229
- − Insurance
- −$3,700
- − Repairs & maintenance
- −$7,226
- − Management
- −$7,226
- − Depreciation
- −$21,527
- Taxable income
- $1,964
- Est. tax owed @ 24.0%
- −$471
- After-tax cash flow
- $13,388/yr
For passive investors: Depreciation is non-cash, so a rental often shows a tax loss while cash-flowing — sheltering income. Rental losses are passive: they offset passive income freely, and up to $25,000/yr can offset ordinary (W-2) income if you actively participate and your MAGI is under $100k (phasing out to $0 by $150k); unused losses carry forward. On sale, claimed depreciation is recaptured at up to 25%, and gains may owe capital-gains tax (a 1031 exchange can defer both). Figures are a year-1 estimate at your 24.0% rate — not tax advice; consult a CPA.
Schools (NCES district)
- District
- District Of Columbia Public Schools
- NCES district ID
- 1100030
- Math proficiency
- 33% ▲ 3.00%
- Reading proficiency
- 40% ▲ 5.00%
- Median HH income
- $67,671
- Composite
- 35.84/100
- National rank
- #9606
- State rank
- #8 of 32 in DC
Livability — Washington
- Score
- 73/100
- State rank
- #1
- US rank
- #5327
Category grades
Schools grade is shown separately in the Schools card above.
Census & demographics
- Census place
- Washington, DC
- County
- District of Columbia · 671,873 people
- City population
- 671,873
- Metro
- Washington-Arlington-Alexandria, DC-VA-MD-WV
- Population (ZIP)
- 53,005
- Household income
- $54,032
- Rent vs Own
- Severe rent burden
- 5148.0
Population outlook (District of Columbia County) Hauer SSP2
- Today (2025)
- 821,926 people
- By 2030
- 899,517 · +9.4%
- By 2040
- 1,061,162 · +29.1%
- By 2050
- 1,231,493 · +49.8%
- By 2075
- 1,603,312 · +95.1%
- By 2100
- 1,847,141 · +124.7%
Race, ethnicity, and origin ACS 2023
- Neighborhood character
- Predominantly Black (90%)
- Race & ethnicity
- Black 90% Two or more races 3% Hispanic / Latino 3% White 3%
- Common ancestry
- Lithuanian 1%
- Foreign-born
- 3% · Canada
- Languages at home
- 95% English-only · Spanish 2% French/Haitian/Cajun 1%
Political lean MEDSL · District of Columbia
- 2024 margin
- Solid D (+86.1) · D 91.2% · R 5.1% · Other 3.8%
- 2008→2024 swing
- +0.1pp no change · 2008: 85.9pp · 2024: 86.1pp
- All cycles
- 2024: D+86.1 2020: D+86.8 2016: D+88.7 2012: D+84.2 2008: D+85.9
Not yet ingested
- Civics
- —
Market trends
- HPI YoY
- ▼ -415.44%
- Current HPI
- 306.5068
- Rent YoY
- ▲ 3.86%
- Metro
- Washington-Arlington-Alexandria, DC-VA-MD-WV
- State GDP YoY
- ▲ 1.33%
- F500 in state
- 6
Industry mix (Fortune 500 HQ in DC)
| Industry | F500 HQs | Revenue |
|---|---|---|
| Financial Services | 1 | $153B |
|
||
| Life Sciences / Industrials | 1 | $25B |
|
||
| Industrial Machinery | 1 | $8B |
|
||
Price history
+1279.9% since first listed57 events — show timeline
- 2026-04-28 Price Changed $750,000 BRIGHT MLS
- 2026-04-07 Listed $775,000 BRIGHT MLS
- 2026-01-31 Listing Removed — BRIGHT MLS
- 2026-01-07 Price Changed $799,900 BRIGHT MLS
- 2025-10-23 Listing Removed — BRIGHT MLS
- 2025-10-23 Listed $814,900 BRIGHT MLS
- 2025-08-18 Listed $815,000 BRIGHT MLS
- 2025-07-30 Listed $820,000 BRIGHT MLS
- 2025-07-30 Listing Removed — BRIGHT MLS
- 2025-06-13 Listing Removed — BRIGHT MLS
- 2025-05-28 Relisted — BRIGHT MLS
- 2025-04-10 Pending — BRIGHT MLS
- 2025-04-08 Listed $820,000 BRIGHT MLS
- 2025-04-04 Coming Soon — BRIGHT MLS
- 2025-04-01 Listing Removed — BRIGHT MLS
- 2025-03-14 Listed $850,000 BRIGHT MLS
- 2024-07-22 Sold (Public Records) $700,000 Public Records
- 2024-07-05 Sold (MLS) $700,000 BRIGHT MLS
- 2024-06-07 Contingent — BRIGHT MLS
- 2024-04-05 Relisted — BRIGHT MLS
- 2024-03-28 Listed $749,000 BRIGHT MLS
- 2024-03-28 Listing Removed — BRIGHT MLS
- 2024-03-20 Listing Removed — BRIGHT MLS
- 2023-12-01 Contingent — BRIGHT MLS
- 2023-11-17 Relisted — BRIGHT MLS
- 2023-11-16 Listing Removed — BRIGHT MLS
- 2023-09-19 Price Changed $749,000 BRIGHT MLS
- 2023-08-25 Listed $800,000 BRIGHT MLS
- 2022-10-15 Listing Removed — BRIGHT MLS
- 2022-09-19 Relisted — BRIGHT MLS
- 2022-09-17 Listing Removed — BRIGHT MLS
- 2022-08-05 Price Changed $870,000 BRIGHT MLS
- 2022-06-27 Listing Removed — BRIGHT MLS
- 2022-06-27 Listed $895,000 BRIGHT MLS
- 2022-06-03 Listed $895,000 BRIGHT MLS
- 2022-02-28 Price Changed $1,250 RENT.
- 2013-09-04 Sold (Public Records) $400,000 Public Records
- 2013-03-11 Sold (Public Records) $210,000 Public Records
- 2013-03-09 Delisted — MRIS
- 2013-03-08 Sold (MLS) $210,000 BRIGHT MLS
- 2013-03-08 Sold (MLS) $210,000 MRIS
- 2013-02-17 Pending — MRIS
- 2013-02-16 Listing Removed — BRIGHT MLS
- 2013-02-14 Listed $189,000 MRIS
- 2013-02-14 Listed $189,000 BRIGHT MLS
- 2009-11-24 Sold (Public Records) $150,000 Public Records
- 2009-11-23 Sold (MLS) $150,000 MRIS
- 2009-11-23 Sold (MLS) $150,000 BRIGHT MLS
- 2009-10-26 Pending — MRIS
- 2009-10-24 Listing Removed — BRIGHT MLS
- 2009-09-24 Price Changed $190,000 MRIS
- 2009-06-11 Price Changed $300,000 MRIS
- 2009-05-15 Price Changed $340,000 MRIS
- 2009-04-22 Listed $395,000 MRIS
- 2009-04-22 Listed $190,000 BRIGHT MLS
- 1991-05-07 Sold (Public Records) $73,000 Public Records
- 1982-11-15 Sold (Public Records) $54,350 Public Records
Property tax history
+6.0%/yrLatest (2025): $7,229 · +1.5% YoY. Source: county tax records.
Cash-flow waterfall
monthlySold comps — $/sqft
last 12 mo · ≤1 miLoading sold comps…