58-03 Calloway St Unit 5E · New York, NY
Flood risk 8/10 · Major
- FEMA flood zone
- X (unshaded)
- Chance of flooding over 30 yrs
- 0.78%
- Est. flood insurance / yr
- $507 – $1,088
Fire risk 1/10 · Minimal
- Est. fire insurance / yr
- $691 – $1,283
Heat risk 7/10 · Major
- Hot days now (above 99°F)
- 7 days/yr
- Hot days in 30 yrs
- 15 days/yr
Wind risk 6/10 · Moderate
- Chance of severe wind over 30 yrs
- 27.0%
Air-quality risk 5/10 · Moderate
- Unhealthy air days now
- 6 days/yr
- Unhealthy air days in 30 yrs
- 8 days/yr
Risk factors via First Street. Map © Google.
Why this score? — see what drove the D grade
The composite is a weighted blend of 9 inputs, each scored 0–100. Each bar is that input's sub-score; the figure is the points it added to the 100-point composite (weight × sub-score).
- Appreciation +8.7/10.0
- 1% rule +7.6/10.0
- ARV discount +7.5/15.0
- Schools +5.0/10.0
- Livability +3.8/5.0
- Condition / age +3.8/5.0
- Rent growth +2.5/5.0
- Cash flow +2.0/30.0
- DSCR +0.0/10.0
$208,000
🖨 Deal sheet (PDF) 📄 Offer letter ✓ Due diligence
Listing remarks
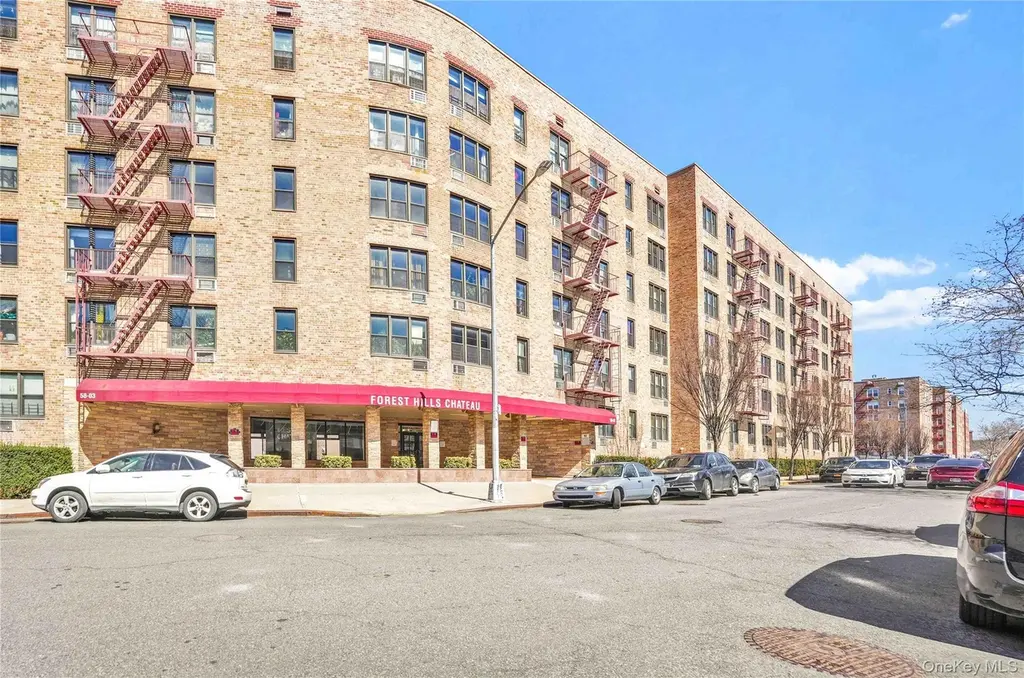
Welcome to 58-03 Calloway Street, Unit 5E—a bright and well-appointed residence in the desirable Forest Hills Chateau cooperative in Corona, Queens. This inviting home features a spacious living and dining area, a functional kitchen, and generously sized rooms with ample natural light, offering comfort and versatility. Residents enjoy elevator access, on-site laundry, and well-maintained common areas. Ideally located near shopping at Queens Center Mall and Rego Center, as well as diverse dining and everyday conveniences. Outdoor recreation is just minutes away at Flushing Meadows–Corona Park. Commuting is easy with nearby M and R trains at 63rd Drive–Rego Park and Woodhave
Key facts
- Near shopping
- Near diverse dining
- Elevator access
Tags
Property features AI
Finance
- HOA & community: Association: Forest Hills Chateau Corp
Exterior
- Parking: Parking on waitlist; Parking fee required
- Utilities: Public sewer; Electricity available and connected
- Home design: Stock cooperative; Measured living area
- Construction: Brick exterior
- Exterior features: Brick construction; Not waterfront
Interior
- Kitchen: Refrigerator
- Bedrooms: 3 rooms total (entry on level 5)
- Bathrooms: 1 full bathroom
- Heating & cooling: Other heating; No central cooling
- Interior features: Formal dining area; Unfinished basement
Neighborhood map
What this means for you Summary
Snapshot
- This is a 1-bed/1.0-bath condo listed at $208k. Condition is rated good.
Deal economics
- At list price, monthly cash flow is $-830 ($-10k/yr) — negative.
- The deal already cash-flows at list — no discount required.
- Meets the 1% rule at list price ($3k rent vs $208k).
- Recommended offer: $196k (6.0% below list) — sets the bar for market timing.
- Cap rate 1.9% vs local median 2.6% in New York — below-typical yield; the buyer is paying a premium for something (appreciation thesis, condition, location) that the cap rate doesn't capture.
Location & tenants
- Location reads 75/100 on livability (#268 in NY, #4,188 nationally) — a middle-class / working-renter tenant base. Strengths: amenities A+, commute A+, health & safety A; Watch: crime F, cost of living F.
- Market conditions: 243 active listings in the ZIP; 40 comparable units currently listed for rent nearby; rentals at typical pace (median 20d on market — plan ~3-4 weeks tenant-placement turnaround); 5,302 units permitted in Queens County in 2024 (4,918 in 5+ unit buildings).
- This rent runs 43% of the median local income ($72k/yr) — at the standard rent-burdened threshold; future hikes will face affordability resistance.
Forward outlook
- In year one you build about $17k of equity ($1k loan paydown + $15k appreciation (7.4% local appreciation)).
- Queens County population projected at +16% by 2050 — long-run rental-demand tailwind backs the buy-and-hold thesis.
- By year 3, paydown + projected appreciation supports a ~$42k cash-out refi (75% LTV) — recoverable capital for the next deal without selling this one.
Negotiation context
- It's been on market 80 days — a 6% lower offer ($196k) is reasonable based on typical stale-listing flexibility.
Risks & watch-outs
- Watch-outs: flood insurance adds $66/mo; HOA is 53% of rent.
- Climate carrying-cost: severe flood risk; major wind risk, 27% chance of damaging wind over 30y; extreme-heat days projected 7→15/yr by 2055 (HVAC capex compounding) — expect insurance premiums to compound above CPI over the hold.
Questions for the listing agent
- What do current leases actually rent for vs. the listed asking? Can we see a recent rent roll and the last 12 months of T-12 income?
- It's been on market 80 days. Have you received any prior offers? Is the seller open to a 6% concession, seller financing, or rate buy-down credit?
- Built in 1968 — when were the roof, HVAC, electrical panel, plumbing, and water heater last replaced?
- What's the actual annual flood-insurance premium (NFIP or private), and is the property in a SFHA with mandatory coverage?
- What does the HOA fee cover, when was the last increase, and are there any pending special assessments or reserve-fund shortfalls?
- Any open or pending special assessments — roof, HVAC, plumbing, elevator, façade? What's the per-unit balance and payoff schedule, and is the seller paying it off at close or rolling it to the buyer?
- Why hasn't it sold? Are there any deal-killer items the seller is aware of (foundation, flood, title, zoning, code violations)?
- Is there a deadline driving the sale (1031 exchange, divorce, estate, relocation)? That informs how much negotiation room exists.
- Schools are B-rated — typically a magnet for longer-tenancy family renters. What's the average tenant stay here, and is there a school-zone premium baked into asking?
- Crime grade is F in this area — have there been break-ins, vandalism, or insurance claims at this property in the last 3 years? What carrier currently insures it and at what premium?
- The area grade is low — what's the realistic commute time and amenity access for the typical tenant pool here? Any planned neighborhood developments (good or bad) we should know about?
- What's the average days-on-market for RENTAL listings here right now (not sales)? A rising rental-DOM trend means longer vacancies and softer asking-rent achievability than the comps imply.
- What's the recent tenant-quality profile in this submarket — average credit score on applications, eviction rate, late-payment / NSF rate, and stable-employment percentage? A property-management company in the area should have these aggregated.
- How much new apartment / multifamily construction is in the pipeline within 1–3 miles? Heavy new supply (>2% of stock underway) typically softens rents 12–24 months out; light construction supports rent growth.
Investment metrics
- 1% rule
- 1.26% ✓
- Cap rate
- 1.89%
- Cash-on-cash
- -15.74%
- DSCR
- 0.30
- GRM
- 6.6
CMA / ARV
No comps found within radius.
Projected returns pro-forma
7.4% appreciation · 3.0% rent growth · sell at horizon
- IRR
- 6.0%
- Equity multiple
- 1.44×
- Total profit
- $25,811
- Equity at exit
- $149,605
- IRR
- 8.3%
- Equity multiple
- 2.99×
- Total profit
- $116,103
- Equity at exit
- $289,276
Cash invested: $58,240 (down + closing). Projections, not guarantees.
Landlord ↔ Tenant lean methodology
- Overall (CITY)
- 0 Strongly Tenant-Friendly
- State New York
- 15 Strongly Tenant-Friendly · D+10
- County
- — inherits STATE
- City New York
- 0 Strongly Tenant-Friendly · D+34
ZIP-level market 11368
- Home prices YoY
- 2.7%
- Active inventory
- 243
- Price-to-rent
- 6.6×
Monthly cashflow live
- Estimated rent
- $2,611 high interval (Pro) →
- Mortgage (P&I)
- −$1,091
- Tax est. 1.5%
- −$260 /mo · $3,120/yr
- Insurance
- −$87
- Flood insurance flood zone
- −$66 /mo · $798/yr
- HOA est. from 1 same-building comp
- −$1,389
- Vacancy / Maint / Mgmt
- −$548
- Net cashflow
- $-830
Break-even live
Sensitivity live
| Price | -10% $-687 | -5% $-759 | +0% $-830 | +5% $-902 | +10% $-974 |
|---|---|---|---|---|---|
| Rent | -10% $-1,037 | -5% $-934 | +0% $-830 | +5% $-727 | +10% $-624 |
| Rate | -1.0pp $-726 | -0.5pp $-778 | base $-830 | +0.5pp $-884 | +1.0pp $-939 |
UW: 25.0% down · 7.5% · 30yr · 1.5% tax · 5.0% vac · 8.0% maint · 8.0% mgmt
Financing live
Cash to close
- Down payment
- $52,000
- Closing costs
- $6,240
- Reserves months
- —
- Total cash needed
- —
Loan-product check · same deal, 3 products live
Conventional
25% down · 7.5% · 30yr
- Down + closing
- —
- Monthly P&I
- —
- Monthly cashflow
- —
- DSCR
- —
- Eligible?
- —
Personal DTI + credit; lowest rate.
DSCR
20% down · 8.5% · 30yr
- Down + closing
- —
- Monthly P&I
- —
- Monthly cashflow
- —
- DSCR
- —
- Eligible?
- —
No personal income docs; deal must DSCR.
Hard money
10% down · 12.0% · 12mo
- Down + closing
- —
- Monthly P&I
- —
- Monthly cashflow
- —
- DSCR
- —
- Eligible?
- —
Short-term bridge; refi at stabilization.
Rent comps 40 comps
| Address | Beds | Baths | Sqft | Rent | $/sqft | DOM | Units | Dist |
|---|---|---|---|---|---|---|---|---|
| 102-45 62nd Rd Unit 7J Forest Hills, NY | 1.0 | 1.0 | 770 | $2,950 | $3.83 | 25d | 1 | 0.25mi |
| 6155 98th St Unit 8B Rego Park, NY | 1.0 | 1.0 | 700 | $2,500 | $3.57 | 5d | 1 | 0.26mi |
| 6145 98th St Rego Park, NY | 1.0–3.0 | 1.0 | 825 | $2,500 | $3.03 | 25d | 3 | 0.29mi |
| 6145 98th St Rego Park, NY | 1.0–3.0 | 1.0 | 825 | $2,350 | $2.85 | 3d | 3 | 0.29mi |
| 102-06 63rd Ave #2 Queens, NY | 2.0 | 1.0 | 1000 | $3,000 | $3.00 | 25d | 1 | 0.35mi |
| 54-01 108th St Unit 2R Flushing, NY | 2.0 | 1.0 | 1000 | $3,050 | $3.05 | 25d | 1 | 0.35mi |
| 6125 97th St Unit 4D Rego Park, NY | — | 1.0 | 650 | $2,300 | $3.54 | 5d | 1 | 0.37mi |
| 9710 62nd Dr Unit 9F Rego Park, NY | 1.0 | 1.0 | 750 | $2,700 | $3.60 | 5d | 1 | 0.41mi |
| 9430 58th Ave Unit 3A Elmhurst, NY | — | 1.0 | 530 | $1,800 | $3.40 | 11d | 1 | 0.44mi |
| 9941 64th Ave Unit C16 Rego Park, NY | 2.0 | 1.0 | 1100 | $3,200 | $2.91 | 0d | 1 | 0.46mi |
| 9707 63rd Rd Unit 15B Rego Park, NY | 1.0 | 1.0 | 700 | $2,300 | $3.29 | 2d | 1 | 0.46mi |
| 9941 64th Ave Rego Park, NY | 1.0–2.0 | 1.0 | 975 | $2,400 | $2.46 | 19d | 2 | 0.48mi |
| 10849 63rd Ave Unit 2C Forest Hills, NY | — | 1.0 | 600 | $1,900 | $3.17 | 25d | 1 | 0.50mi |
| 9810 64th Ave Rego Park, NY | 1.0 | 1.0 | 825 | $2,125 | $2.58 | 18d | 2 | 0.53mi |
| 9810 64th Ave Unit 3A Rego Park, NY | 1.0 | 1.0 | 850 | $2,450 | $2.88 | 3d | 1 | 0.53mi |
| 6405 Yellowstone Blvd Flushing, NY | 1.0 | 1.0–1.5 | 920 | $3,075 | $3.34 | 25d | 2 | 0.53mi |
| 6405 Yellowstone Blvd Unit 403S Forest Hills, NY | 1.0 | 1.0 | 720 | $3,100 | $4.31 | 25d | 1 | 0.53mi |
| 9825 64th Rd Unit 8F Rego Park, NY | 2.0 | 1.0 | 850 | $2,400 | $2.82 | 2d | 1 | 0.55mi |
| 9725 64th Ave Rego Park, NY | 1.0 | 1.0 | 760 | $1,800 | $2.37 | 19d | 1 | 0.55mi |
| 61-20 Grand Central Pkwy Unit Bb706 Forest Hills, NY | 2.0 | 1.0 | 970 | $2,850 | $2.94 | 19d | 1 | 0.56mi |
| 6435 Yellowstone Blvd Unit 6G Forest Hills, NY | — | 1.0 | 575 | $1,900 | $3.30 | 19d | 1 | 0.60mi |
| 10525 65th Ave Unit 4F Forest Hills, NY | 2.0 | 1.0 | 980 | $3,998 | $4.08 | 15d | 1 | 0.61mi |
| 10523 65th Rd Forest Hills, NY | 2.0 | 2.0 | 760 | $3,200 | $4.21 | 25d | 1 | 0.65mi |
| 102-39 66th Ave Unit 1 Flushing, NY | 2.0 | 1.0 | 981 | $3,000 | $3.06 | 2d | 1 | 0.68mi |
| 97-12 65th Rd Unit 18-E Rego Park, NY | 1.0 | 1.0 | 600 | $3,650 | $6.08 | 0d | 1 | 0.68mi |
| 97-12 65th Rd Unit 4-C Rego Park, NY | 1.0 | 1.0 | 650 | $3,350 | $5.15 | 6d | 1 | 0.68mi |
| 6347 Booth St Unit 3C Rego Park, NY | 1.0 | 1.0 | 700 | $3,400 | $4.86 | 25d | 1 | 0.69mi |
| 97-12 65th Rd Apt 5D Rego Park, NY | 1.0 | 1.0 | 800 | $3,395 | $4.24 | 6d | 1 | 0.70mi |
| 10533 66th Ave Unit 3F Forest Hills, NY | 1.0 | 1.0 | 775 | $2,200 | $2.84 | 5d | 1 | 0.71mi |
| 10302 42nd Ave Unit 4D Corona, NY | 2.0 | 1.5 | 761 | $3,400 | $4.47 | 19d | 1 | 0.71mi |
| 98-81 Queens Blvd Unit 15E Rego Park, NY | 1.0 | 1.0 | 700 | $3,335 | $4.76 | 6d | 1 | 0.71mi |
| 98-81 Queens Blvd Unit 14K Rego Park, NY | 2.0 | 2.0 | 950 | $4,490 | $4.73 | 13d | 1 | 0.71mi |
| 10530 66th Ave Unit 3F Forest Hills, NY | 1.0 | 1.0 | 800 | $2,200 | $2.75 | 25d | 1 | 0.74mi |
| 9876 Queens Blvd Unit 3A Rego Park, NY | 1.0 | 1.0 | 820 | $2,900 | $3.54 | 25d | 1 | 0.75mi |
| 11105 66th Ave Unit 2B Forest Hills, NY | 1.0 | 1.0 | 850 | $2,600 | $3.06 | 16d | 1 | 0.77mi |
| 10025 Queens Blvd Unit 3M Forest Hills, NY | 2.0 | 1.0 | 925 | $2,900 | $3.14 | 25d | 1 | 0.80mi |
| 102-45 67th Rd Forest Hills, NY | 1.0 | 1.0 | 700 | $2,350 | $3.36 | 19d | 1 | 0.82mi |
| 102-55 67th Rd Unit 2V Forest Hills, NY | 1.0 | 1.0 | 633 | $2,350 | $3.71 | 20d | 1 | 0.83mi |
| 11131 66th Ave Unit 3C Forest Hills, NY | 1.0 | 1.0 | 600 | $2,000 | $3.33 | 5d | 1 | 0.84mi |
| 105-25 67th Rd Forest Hills, NY | 1.0 | 1.0 | 750 | $1,800 | $2.40 | 19d | 1 | 0.84mi |
HOA detail condo
- Monthly dues
- $0 · $0/yr
- Assessments
- None detected in remarks — confirm with the listing agent.
Listing history 12 events
-
2026-06-18days on market $208,000 Active 80 DOM
-
2026-06-17days on market $208,000 Active 79 DOM
-
2026-06-15days on market $208,000 Active 77 DOM
-
2026-06-13days on market $208,000 Active 75 DOM
-
2026-06-10days on market $208,000 Active 71 DOM
-
2026-06-08days on market $208,000 Active 70 DOM
-
2026-06-08days on market $208,000 Active 69 DOM
-
2026-06-04days on market $208,000 Active 66 DOM
-
2026-06-03days on market $208,000 Active 65 DOM
-
2026-06-01days on market $208,000 Active 63 DOM
-
2026-05-31days on market $208,000 Active 62 DOM
-
2026-03-30$208,000 Active
ⓘ Source: listings_history table (triggers on properties + properties_extension) + one-shot
backfill from property_details.listing_events for pre-trigger history.
Climate risk First Street
- Flood 8/10 Severe FEMA zone X (unshaded) · 78% chance over 30 yrs
- Wildfire 1/10 Low
- Heat 7/10 Severe 7 d/yr ≥99°F today · 15 d/yr by 30 yrs out
- Wind 6/10 Major 27% chance of damaging wind over 30 yrs
- Air quality 5/10 Major 6 unhealthy d/yr today · 8 by 30 yrs out
Nearby sold comps map
Loading sold comps map…
Walkable amenities ~0.75 mi
Loading nearby amenities…
Taxation est. · year 1
- Rental income
- $31,328
- − Mortgage interest
- −$11,651
- − Property taxes
- −$3,120
- − Insurance
- −$1,838
- − Repairs & maintenance
- −$2,506
- − Management
- −$2,506
- − HOA
- −$16,668
- − Depreciation
- −$6,051
- Taxable loss
- −$13,012
- Est. tax savings @ 24.0%
- +$3,123
- After-tax cash flow
- $-6,843/yr
For passive investors: Depreciation is non-cash, so a rental often shows a tax loss while cash-flowing — sheltering income. Rental losses are passive: they offset passive income freely, and up to $25,000/yr can offset ordinary (W-2) income if you actively participate and your MAGI is under $100k (phasing out to $0 by $150k); unused losses carry forward. On sale, claimed depreciation is recaptured at up to 25%, and gains may owe capital-gains tax (a 1031 exchange can defer both). Figures are a year-1 estimate at your 24.0% rate — not tax advice; consult a CPA.
Condition & rehab AI · 14 photos
This well-maintained and updated condo in Forest Hills Chateau offers a good investment opportunity with minimal repairs needed and high potential for value appreciation.
Value-add opportunities
- Resale Paint the exterior walls — A fresh coat of paint can significantly enhance the curb appeal and resale value of the property.
- Both Replace the flooring — Replacing the hardwood flooring with a more modern material can increase both the resale and rental value.
- Resale Update the kitchen appliances — Upgrading the kitchen appliances can make the space more appealing to potential buyers.
Renovation cost estimate screening
Value-add ROI direction
- Resale Paint the exterior walls — A fresh coat of paint can significantly enhance the curb appeal and resale value of the property. ↑
- Both Replace the flooring — Replacing the hardwood flooring with a more modern material can increase both the resale and rental value. ↑
- Resale Update the kitchen appliances — Upgrading the kitchen appliances can make the space more appealing to potential buyers. ↑
ⓘ Cost ranges are severity-bucket heuristics (US national rule-of-thumb). Get contractor quotes + a written scope before underwriting a rehab budget.
Schools (NCES district)
No district data.
Livability — New York
- Score
- 75/100
- State rank
- #268
- US rank
- #4188
Category grades
Schools grade is shown separately in the Schools card above.
Census & demographics
- Census place
- New York, NY
- County
- Queens County · 1,914,869 people
- City population
- 7,731,280
- Metro
- New York-Newark-Jersey City, NY-NJ-PA
- Population (ZIP)
- 105,716
- Household income
- $72,270
- Rent vs Own
- Severe rent burden
- 6817.0
Population outlook (Queens County) Hauer SSP2
- Today (2025)
- 2,546,320 people
- By 2030
- 2,643,059 · +3.8%
- By 2040
- 2,815,563 · +10.6%
- By 2050
- 2,944,423 · +15.6%
- By 2075
- 3,123,338 · +22.7%
- By 2100
- 3,098,688 · +21.7%
Race, ethnicity, and origin ACS 2023
- Neighborhood character
- Predominantly Hispanic (75%)
- Race & ethnicity
- Hispanic / Latino 75% Two or more races 14% Asian 12% Black 8% White 4% Native American 1%
- Hispanic origin (detail)
- Mexican 20% Puerto Rican 2% Dominican 14%
- Foreign-born
- 60% · Canada, China, Jamaica
- Languages at home
- 15% English-only · Spanish 70% Chinese 6% Other Indo-European 3%
Political lean MEDSL · Queens
- 2024 margin
- Strong D (+24.6) · D 62.3% · R 37.7%
- 2008→2024 swing
- -26.2pp toward R · 2008: 50.8pp · 2024: 24.6pp
- All cycles
- 2024: D+24.6 2020: D+45.2 2016: D+53.4 2012: D+58.5 2008: D+50.8
Not yet ingested
- Civics
- —
Market trends
- HPI YoY
- ▲ 7.40%
- Current HPI
- 282.8276
- Rent YoY
- —
- Metro
- New York-Newark-Jersey City, NY-NJ-PA
- State GDP YoY
- ▲ 2.60%
- F500 in state
- 92
Industry mix (Fortune 500 HQ in NY)
| Industry | F500 HQs | Revenue |
|---|---|---|
| Financial Services | 10 | $950B |
|
||
| Consumer Goods | 9 | $162B |
|
||
| Insurance | 4 | $225B |
|
||
| Telecommunications | 2 | $144B |
|
||
| Pharmaceuticals | 2 | $112B |
|
||
| Media / Entertainment | 2 | $69B |
|
||
Price history
1 event — show timeline
- 2026-03-30 Listed $208,000 OneKey® MLS as Distributed by MLS Grid
Cash-flow waterfall
monthlySold comps — $/sqft
last 12 mo · ≤1 miLoading sold comps…