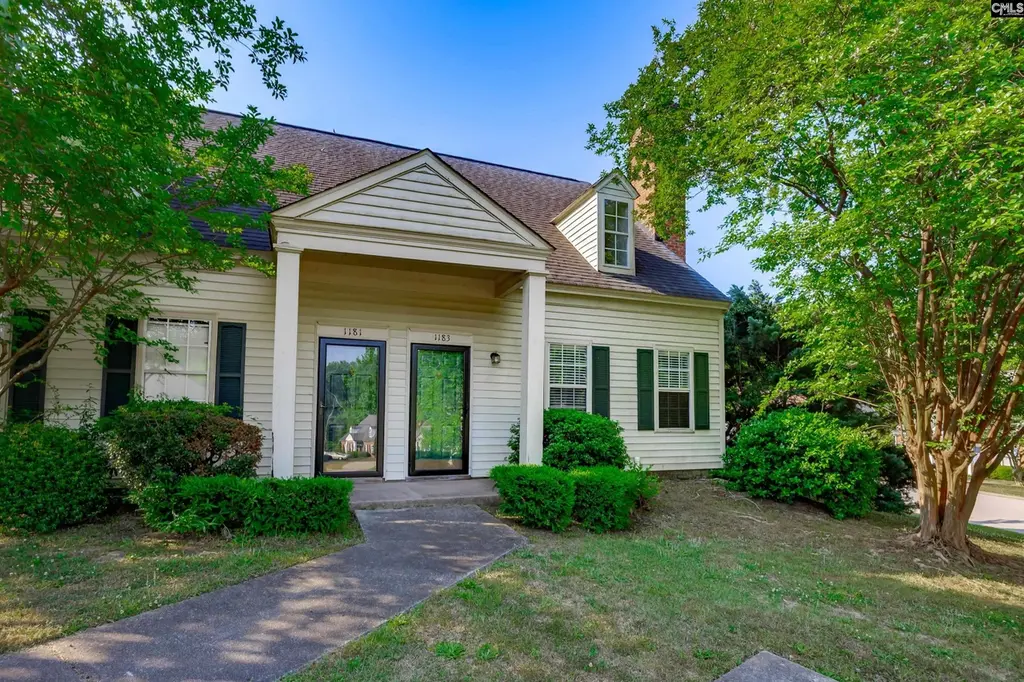
1183 Hulon Ln · West Columbia, SC
Flood risk 1/10 · Minimal
- FEMA flood zone
- X (unshaded)
- Chance of flooding over 30 yrs
- 0.0%
- Est. flood insurance / yr
- $507 – $1,088
Fire risk 3/10 · Minor
- Est. fire insurance / yr
- $783 – $1,453
Heat risk 6/10 · Moderate
- Hot days now (above 109°F)
- 7 days/yr
- Hot days in 30 yrs
- 16 days/yr
Wind risk 6/10 · Moderate
- Chance of severe wind over 30 yrs
- 64.0%
Air-quality risk 3/10 · Minor
- Unhealthy air days now
- 2 days/yr
- Unhealthy air days in 30 yrs
- 2 days/yr
Risk factors via First Street. Map © Google.
Why this score? — see what drove the C grade
The composite is a weighted blend of 9 inputs, each scored 0–100. Each bar is that input's sub-score; the figure is the points it added to the 100-point composite (weight × sub-score).
- Cash flow +22.6/30.0
- ARV discount +7.5/15.0
- DSCR +7.2/10.0
- 1% rule +6.7/10.0
- Rent growth +3.4/5.0
- Livability +3.2/5.0
- Schools +2.9/10.0
- Condition / age +2.5/5.0
- Appreciation +0.0/10.0
$172,900
🖨 Deal sheet (PDF) 📄 Offer letter ✓ Due diligence
Listing remarks
Your NEW Home is here! This 3 bedroom/2 bath corner lot townhome is conveniently located behind Lexington Medical Center and minutes to downtown Columbia and Lexington. Absolute perfect starter home, rental or investment opportunity. The primary bedroom and full bath are located on the main and two additional bedrooms and full bathroom upstairs. Downstairs is complete with a spacious great room with cozy wood burning fireplace, eat-in kitchen with stainless steel appliances and sliding door out to the private patio area perfect for grilling out or relaxing after a long day. Pool community and Low regime fees (includes front yard lawn service) Disclaimer: CMLS has not reviewed and, therefor
Key facts
- Pool community
- Private patio area
- Corner lot
Tags
Property features AI
Finance
- Other: Paved road access
- HOA & community: Homeowner association present; Association maintains common areas and front yard; community amenities include playground, pool and green areas
Exterior
- Parking: Two parking spaces
- Utilities: Public water; Public sewer
- Home design: Two-story property
- Construction: Vinyl exterior finish; Slab foundation
- Exterior features: Covered front porch; Patio; Partial privacy wood fence in rear
Interior
- Kitchen: Eat-in kitchen with painted cabinets, Formica countertops and luxury vinyl plank flooring; Microwave (above stove); Free-standing smooth-surface range; Dishwasher; Garbage disposal; Refrigerator
- Bedrooms: Primary bedroom on main level with private closet and luxury vinyl plank flooring; bath shared; Second bedroom on second level with walk-in closet, private closet, tub/shower and ceiling fan; shared bath; Third bedroom on second level with walk-in closet, private closet, tub/shower and ceiling fan; shared bath
- Flooring: Luxury vinyl plank flooring in primary bedroom, living areas and kitchen
- Bathrooms: Two full baths total (one main level full bath, one second-level full bath)
- Heating & cooling: Central heating; Central air conditioning; One wood-burning fireplace
- Interior features: Ceiling fans; Smoke detector; Attic with pull-down access
- Laundry & utility: Washer and dryer included; Laundry in closet on main level (heated space, located in kitchen area)
Neighborhood map
What this means for you Summary
Snapshot
- This is a 3-bed/2.0-bath townhouse listed at $173k.
Deal economics
- At list price, monthly cash flow is $294 ($4k/yr) — positive.
- The deal already cash-flows at list — no discount required.
- Meets the 1% rule at list price ($2k rent vs $173k).
- Recommended offer: $170k (1.5% below list) — sets the bar for market timing.
Location & tenants
- Location reads 63/100 on livability (#168 in SC) — a middle-class / working-renter tenant base. Strengths: cost of living A+, housing A+, health & safety A+; Watch: employment D+, schools D, crime F.
- Lexington 02 (suburban): math 30% / reading 38% proficiency, ranked #45 of 80 in SC (top 56%) — families likely to look elsewhere, expect single-tenant / working-renter base with shorter leases.
- Market conditions: Rents rising (+3.5%/yr); 136 active listings in the ZIP; 6 comparable units currently listed for rent nearby; rentals at typical pace (median 25d on market — plan ~3-4 weeks tenant-placement turnaround); 1,712 units permitted in Lexington County in 2024 (0 in 5+ unit buildings).
- This rent runs 43% of the median local income ($57k/yr) — at the standard rent-burdened threshold; future hikes will face affordability resistance.
Forward outlook
- Local home prices are declining (-3.0%/yr); year-one equity from $1k of loan paydown is wiped out by about $5k of value loss. Plan a longer hold.
- Lexington County population projected at +26% by 2050 — long-run rental-demand tailwind backs the buy-and-hold thesis.
Negotiation context
- It's been on market 17 days — a 2% lower offer ($170k) is reasonable based on typical stale-listing flexibility.
- 4 sale attempts since 6y ago with the ask held roughly flat each time — persistent listings suggest the price (not the market) is what's stuck; bring a comps-based counter.
- Current owner paid $142k; 21% above their basis — modest negotiation headroom, anchor on the comps not their cost.
Risks & watch-outs
- Climate carrying-cost: major wind risk, 64% chance of damaging wind over 30y; extreme-heat days projected 7→16/yr by 2055 (HVAC capex compounding) — expect insurance premiums to compound above CPI over the hold.
Questions for the listing agent
- What does the HOA fee cover, when was the last increase, and are there any pending special assessments or reserve-fund shortfalls?
- Is there a deadline driving the sale (1031 exchange, divorce, estate, relocation)? That informs how much negotiation room exists.
- Schools are D-rated, which usually means shorter tenancies and higher turnover. Who's the typical renter profile here, and what's been the actual vacancy rate?
- Crime grade is F in this area — have there been break-ins, vandalism, or insurance claims at this property in the last 3 years? What carrier currently insures it and at what premium?
- What's the average days-on-market for RENTAL listings here right now (not sales)? A rising rental-DOM trend means longer vacancies and softer asking-rent achievability than the comps imply.
- What's the recent tenant-quality profile in this submarket — average credit score on applications, eviction rate, late-payment / NSF rate, and stable-employment percentage? A property-management company in the area should have these aggregated.
- How much new for-sale + rental construction is in the pipeline within 1–3 miles? Heavy new supply typically softens prices + rents 12–24 months out; constrained supply supports both.
Investment metrics
- 1% rule
- 1.17% ✓
- Cap rate
- 8.33%
- Cash-on-cash
- 7.29%
- DSCR
- 1.32
- GRM
- 7.1
CMA / ARV
No comps found within radius.
Projected returns pro-forma
-3.0% appreciation · 3.48% rent growth · sell at horizon
- IRR
- -4.5%
- Equity multiple
- 0.83×
- Total profit
- $-8,199
- Equity at exit
- $25,780
- IRR
- 5.8%
- Equity multiple
- 1.44×
- Total profit
- $21,467
- Equity at exit
- $14,949
Cash invested: $48,412 (down + closing). Projections, not guarantees.
Landlord ↔ Tenant lean methodology
- Overall (STATE)
- 90 Strongly Landlord-Friendly
- State South Carolina
- 90 Strongly Landlord-Friendly · R+6
- County
- — inherits STATE
- City
- — inherits STATE
ZIP-level market 29169
- Home prices YoY
- -15.8%
- Rents YoY
- 3.5%
- Active inventory
- 136
- Price-to-rent
- 7.1×
Monthly cashflow live
- Estimated rent
- $2,028 high interval (Pro) →
- Mortgage (P&I)
- −$907
- Tax from tax record
- −$246 /mo · $2,952/yr
- Insurance
- −$72
- HOA
- −$83
- Vacancy / Maint / Mgmt
- −$426
- Net cashflow
- $294
Break-even live
Sensitivity live
| Price | -10% $392 | -5% $343 | +0% $294 | +5% $245 | +10% $196 |
|---|---|---|---|---|---|
| Rent | -10% $134 | -5% $214 | +0% $294 | +5% $374 | +10% $454 |
| Rate | -1.0pp $381 | -0.5pp $338 | base $294 | +0.5pp $249 | +1.0pp $204 |
UW: 25.0% down · 7.5% · 30yr · 1.5% tax · 5.0% vac · 8.0% maint · 8.0% mgmt
Financing live
Cash to close
- Down payment
- $43,225
- Closing costs
- $5,187
- Reserves months
- —
- Total cash needed
- —
Loan-product check · same deal, 3 products live
Conventional
25% down · 7.5% · 30yr
- Down + closing
- —
- Monthly P&I
- —
- Monthly cashflow
- —
- DSCR
- —
- Eligible?
- —
Personal DTI + credit; lowest rate.
DSCR
20% down · 8.5% · 30yr
- Down + closing
- —
- Monthly P&I
- —
- Monthly cashflow
- —
- DSCR
- —
- Eligible?
- —
No personal income docs; deal must DSCR.
Hard money
10% down · 12.0% · 12mo
- Down + closing
- —
- Monthly P&I
- —
- Monthly cashflow
- —
- DSCR
- —
- Eligible?
- —
Short-term bridge; refi at stabilization.
Rent comps 6 comps
| Address | Beds | Baths | Sqft | Rent | $/sqft | DOM | Units | Dist |
|---|---|---|---|---|---|---|---|---|
| 2720 Sunset Blvd West Columbia, SC | 1.0–3.0 | 1.0–2.0 | 1187 | $2,540 | $2.14 | 20d | 35 | 0.43mi |
| 133 Brewers Oak Ln West Columbia, SC | 3.0 | 2.5 | 1600 | $2,049 | $1.28 | 3d | 1 | 1.15mi |
| 3220 Woodsen Cir West Columbia, SC | 3.0 | 2.0 | 1475 | $1,800 | $1.22 | 24d | 1 | 1.29mi |
| 308 Chisolm Ct Lexington, SC | 3.0 | 2.0 | 1305 | $1,800 | $1.38 | 24d | 1 | 1.43mi |
| 1208 Bush River Rd Columbia, SC | 2.0 | 1.0–2.0 | 1000 | $1,072 | $1.07 | 24d | 3 | 1.47mi |
| 1208 Bush River Rd Columbia, SC | 2.0 | 1.0–2.0 | 1050 | $1,050 | $1.00 | 15d | 4 | 1.47mi |
HOA detail
- Monthly dues
- $83 · $996/yr
- Likely covers
- pool
Listing history 18 events
-
2026-05-12status Pending
-
2026-04-27historical Active - Contingent
-
2026-04-25historical $1,400
-
2026-04-25$172,900 Active
-
2026-03-20price $1,400
-
2026-03-09price $1,450
-
2026-03-03price $1,500
-
2026-03-02price $1,550
-
2026-02-06$1,500
-
2023-02-08soldstatus $142,500
-
2023-01-13$142,500 Active
-
2020-09-30soldstatus $119,000
-
2020-08-21historical
-
2020-08-19$119,000 Active
-
2017-03-21soldstatus $92,900
-
2003-10-03soldstatus $84,500
-
1997-05-01soldstatus $14,926
-
1997-02-01soldstatus $125,990
ⓘ Source: listings_history table (triggers on properties + properties_extension) + one-shot
backfill from property_details.listing_events for pre-trigger history.
Tax reassessment forecast SC · Resets to sale price
- Current annual tax
- $2,952 · $246/mo
- Projected year-2 tax
- $2,952 · $246/mo
- Expected delta
- $0/yr ($0/mo · 0.0%)
ⓘ Screening estimate from a state-policy table — verify with the county assessor before closing.
Climate risk First Street
- Flood 1/10 Low FEMA zone X (unshaded) · 0% chance over 30 yrs
- Wildfire 3/10 Moderate
- Heat 6/10 Major 7 d/yr ≥109°F today · 16 d/yr by 30 yrs out
- Wind 6/10 Major 64% chance of damaging wind over 30 yrs
- Air quality 3/10 Moderate 2 unhealthy d/yr today · 2 by 30 yrs out
Nearby sold comps map
Loading sold comps map…
Walkable amenities ~0.75 mi
Loading nearby amenities…
Taxation est. · year 1
- Rental income
- $24,333
- − Mortgage interest
- −$9,685
- − Property taxes
- −$2,952
- − Insurance
- −$864
- − Repairs & maintenance
- −$1,947
- − Management
- −$1,947
- − HOA
- −$996
- − Depreciation
- −$5,030
- Taxable income
- $912
- Est. tax owed @ 24.0%
- −$219
- After-tax cash flow
- $3,311/yr
For passive investors: Depreciation is non-cash, so a rental often shows a tax loss while cash-flowing — sheltering income. Rental losses are passive: they offset passive income freely, and up to $25,000/yr can offset ordinary (W-2) income if you actively participate and your MAGI is under $100k (phasing out to $0 by $150k); unused losses carry forward. On sale, claimed depreciation is recaptured at up to 25%, and gains may owe capital-gains tax (a 1031 exchange can defer both). Figures are a year-1 estimate at your 24.0% rate — not tax advice; consult a CPA.
Schools (NCES district)
- District
- Lexington 02
- NCES district ID
- 4502730
- Math proficiency
- 30% ▼ -6.00%
- Reading proficiency
- 38% ▬ 0.00%
- Median HH income
- $42,532
- Composite
- 28.78/100
- National rank
- #6669
- State rank
- #45 of 80 in SC
Livability — West Columbia
- Score
- 63/100
- State rank
- #168
- US rank
- #15166
Category grades
Schools grade is shown separately in the Schools card above.
Census & demographics
- County
- Lexington County · 232,571 people
- City population
- 21,647
- Metro
- Columbia, SC
- Population (ZIP)
- 21,647
- Household income
- $57,122
- Rent vs Own
- Severe rent burden
- 1172.0
Population outlook (Lexington County) Hauer SSP2
- Today (2025)
- 322,999 people
- By 2030
- 342,356 · +6.0%
- By 2040
- 377,715 · +16.9%
- By 2050
- 406,984 · +26.0%
- By 2075
- 465,447 · +44.1%
- By 2100
- 485,674 · +50.4%
Race, ethnicity, and origin ACS 2023
- Neighborhood character
- Predominantly White (66%)
- Race & ethnicity
- White 66% Black 16% Two or more races 11% Hispanic / Latino 10% Asian 3%
- Hispanic origin (detail)
- Mexican 6%
- Common ancestry
- Serbian 2% Italian 2% Lithuanian 2%
- Foreign-born
- 8% · Canada, China
- Languages at home
- 88% English-only · Spanish 8% Other Indo-European 1% Chinese 1%
Political lean MEDSL · Lexington
- 2024 margin
- Solid R (+33.5) · D 32.5% · R 66.0% · Other 1.4%
- 2008→2024 swing
- +4.6pp toward D · 2008: -38.0pp · 2024: -33.5pp
- All cycles
- 2024: R+33.5 2020: R+30.1 2016: R+36.7 2012: R+37.8 2008: R+38.0
Not yet ingested
- Civics
- —
Market trends
- HPI YoY
- ▼ -53.87%
- Current HPI
- 287.4791
- Rent YoY
- ▲ 3.48%
- Metro
- Columbia, SC
- State GDP YoY
- ▲ 4.51%
- F500 in state
- 2
Industry mix (Fortune 500 HQ in SC)
| Industry | F500 HQs | Revenue |
|---|---|---|
| Packaging | 1 | $7B |
|
||
Price history
-98.9% since first listed18 events — show timeline
- 2026-05-12 Pending — Consolidated MLS
- 2026-04-27 Contingent — Consolidated MLS
- 2026-04-25 Rental Removed $1,400 APPFOLIO
- 2026-04-25 Listed $172,900 Consolidated MLS
- 2026-03-20 Price Changed $1,400 APPFOLIO
- 2026-03-09 Price Changed $1,450 APPFOLIO
- 2026-03-03 Price Changed $1,500 APPFOLIO
- 2026-03-02 Price Changed $1,550 APPFOLIO
- 2026-02-06 Listed for Rent $1,500 APPFOLIO
- 2023-02-08 Sold (Public Records) $142,500 Public Records
- 2023-01-13 Listed $142,500 Consolidated MLS
- 2020-09-30 Sold (Public Records) $119,000 Public Records
- 2020-08-21 Delisted — Consolidated MLS
- 2020-08-19 Listed $119,000 Consolidated MLS
- 2017-03-21 Sold (Public Records) $92,900 Public Records
- 2003-10-03 Sold (Public Records) $84,500 Public Records
- 1997-05-01 Sold (Public Records) $14,926 Public Records
- 1997-02-01 Sold (Public Records) $125,990 Public Records
Property tax history
+5.2%/yrLatest (2024): $2,952 · +352.5% YoY. Source: county tax records.
Cash-flow waterfall
monthlySold comps — $/sqft
last 12 mo · ≤1 miLoading sold comps…